. 2015 Dec 22:9:483.
doi: 10.3389/fncel.2015.00483. eCollection 2015.

Acid-Sensing Ion Channels Expression, Identity and Role in the Excitability of the Cochlear Afferent Neurons

Affiliations

Acid-Sensing Ion Channels Expression, Identity and Role in the Excitability of the Cochlear Afferent Neurons

Antonia González-Garrido et al. Front Cell Neurosci. .

Abstract

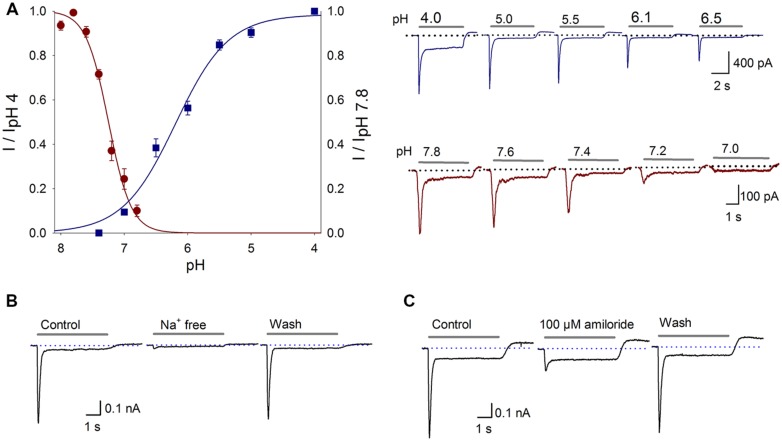
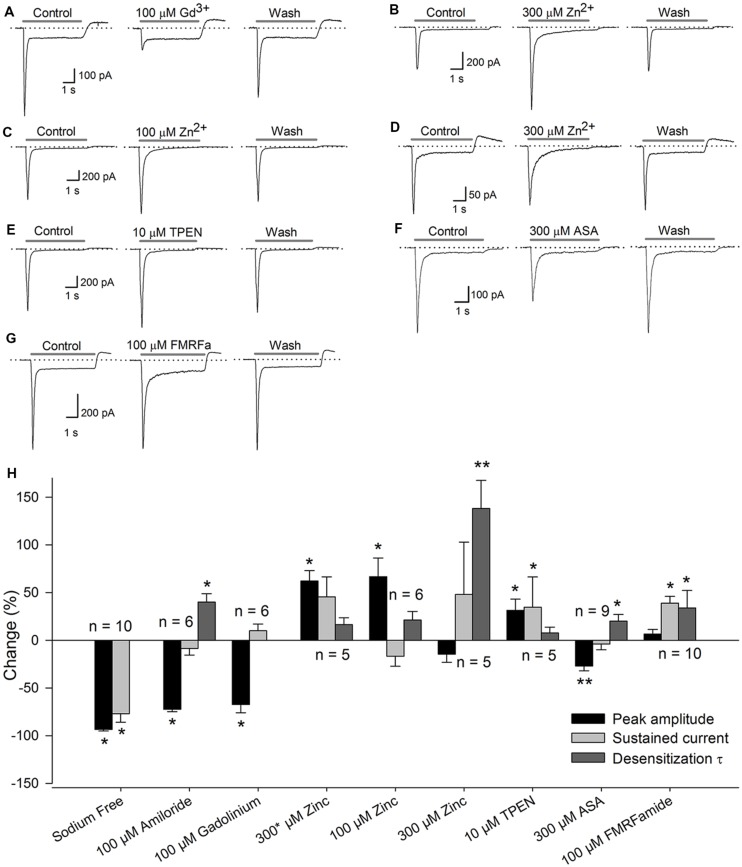
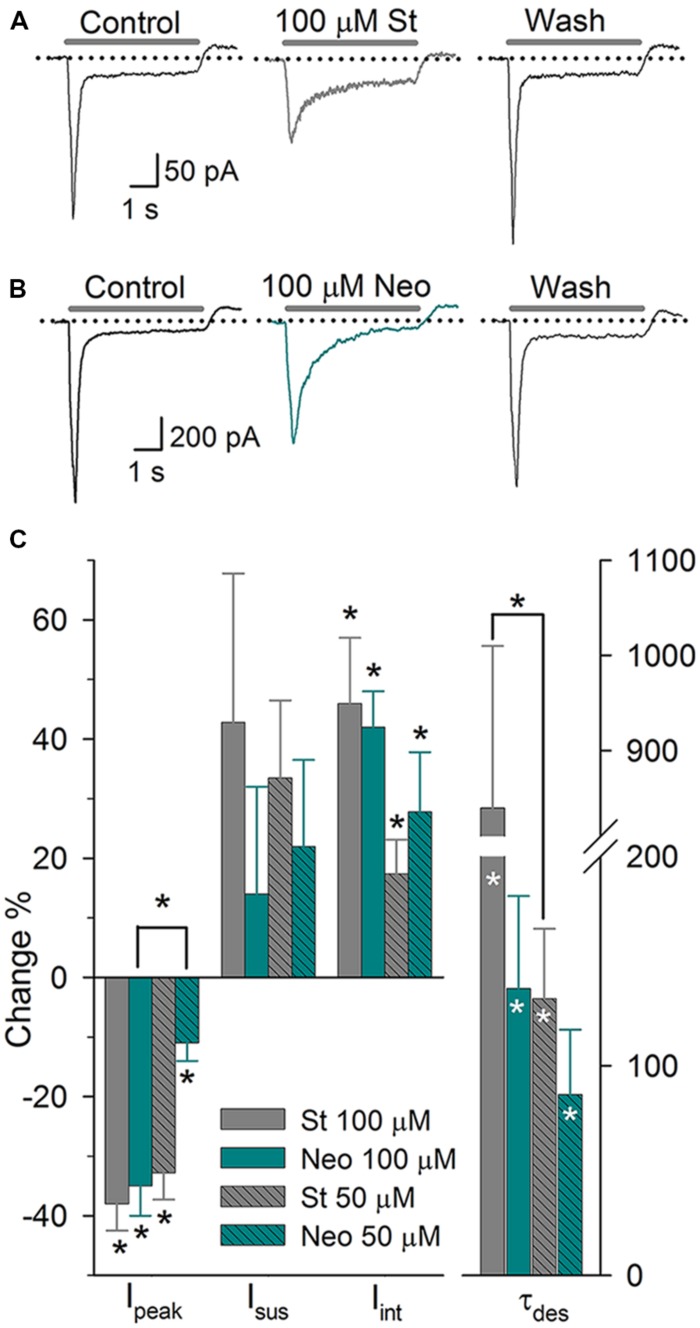
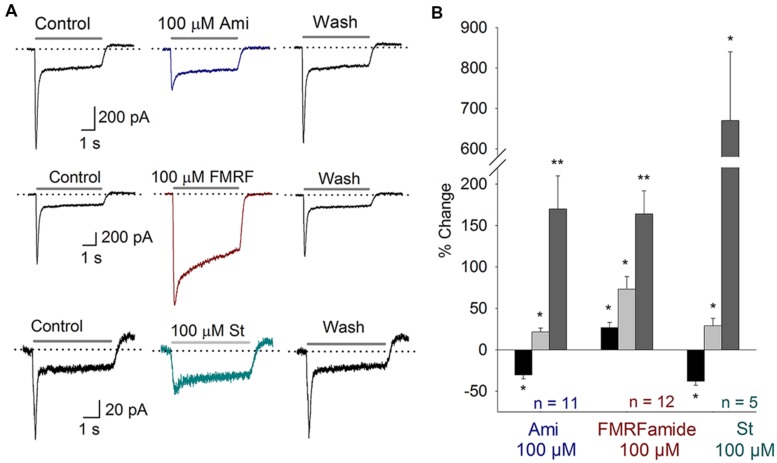
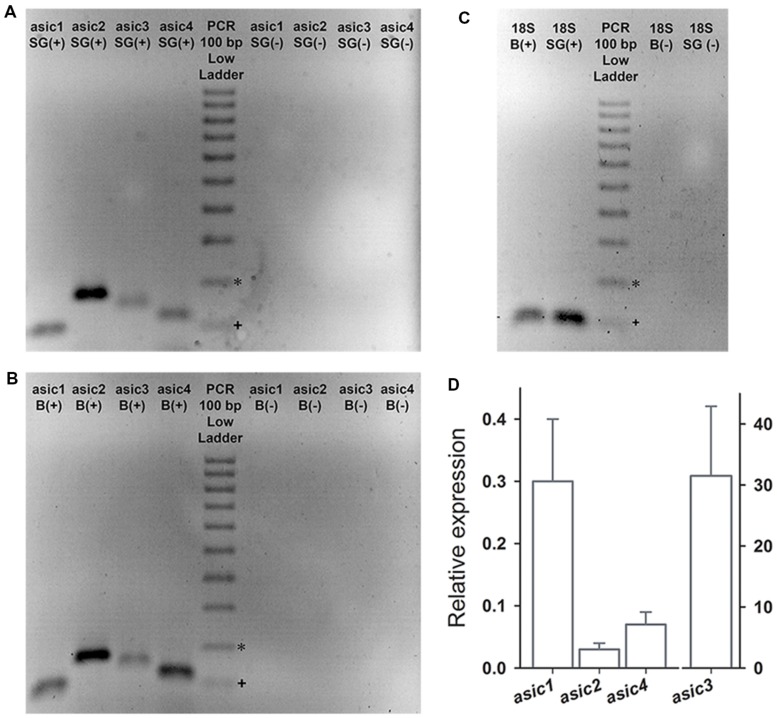
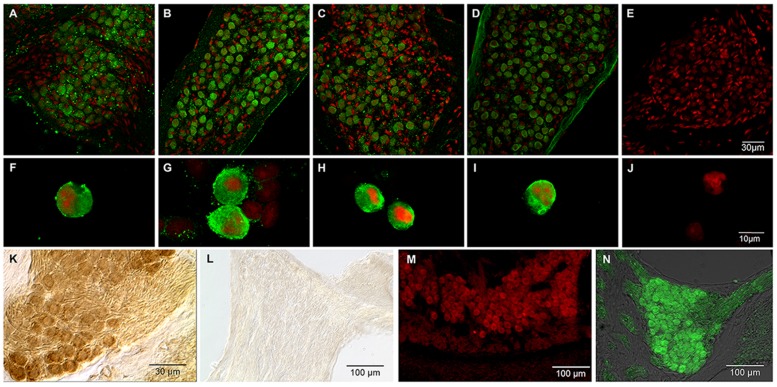
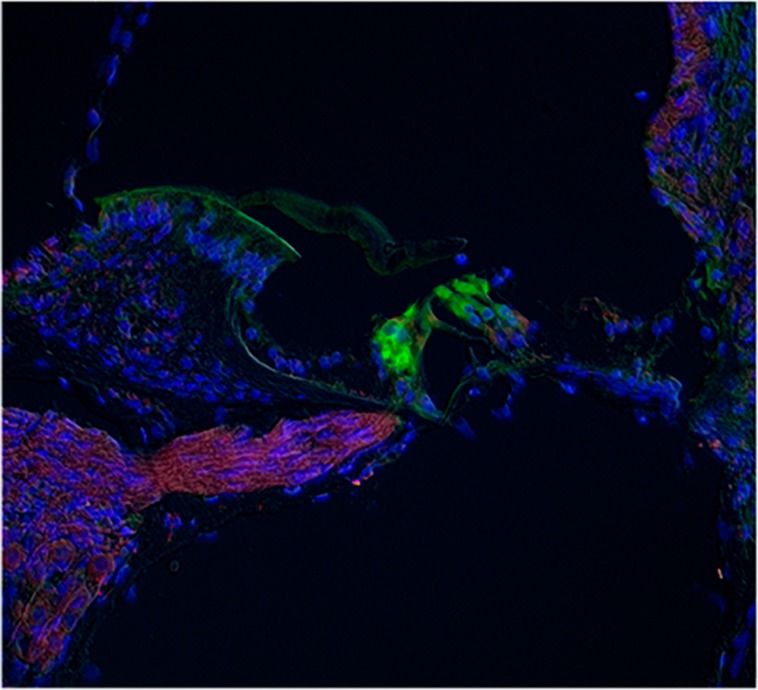
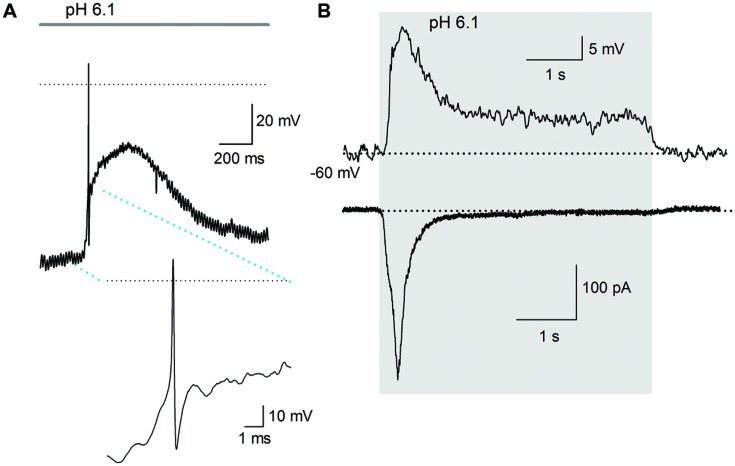
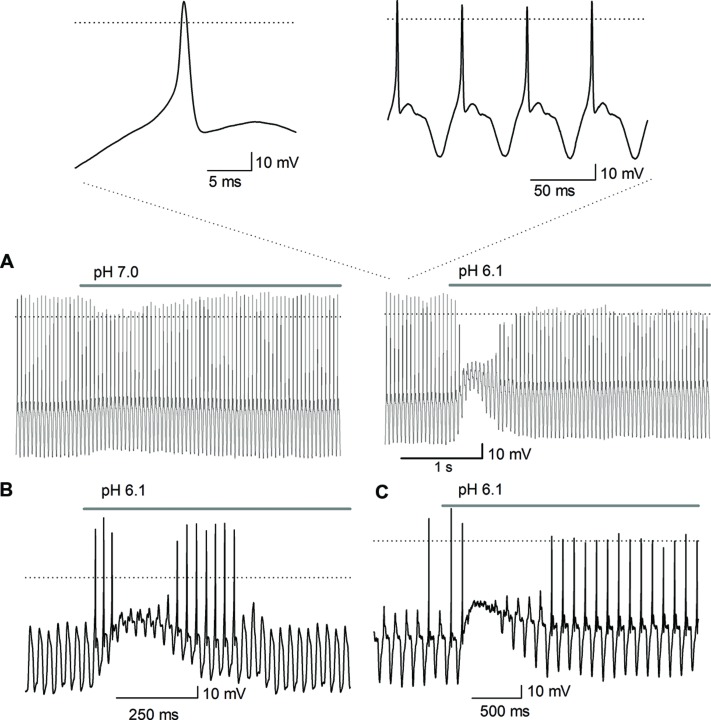
Acid-sensing ion channels (ASICs) are activated by an increase in the extracellular proton concentration. There are four genes (ASIC1-4) that encode six subunits, and they are involved in diverse neuronal functions, such as mechanosensation, learning and memory, nociception, and modulation of retinal function. In this study, we characterize the ASIC currents of spiral ganglion neurons (SGNs). These ASIC currents are primarily carried by Na(+), exhibit fast activation and desensitization, display a pH50 of 6.2 and are blocked by amiloride, indicating that these are ASIC currents. The ASIC currents were further characterized using several pharmacological tools. Gadolinium and acetylsalicylic acid reduced these currents, and FMRFamide, zinc (at high concentrations) and N,N,N',N'-tetrakis-(2-piridilmetil)-ethylenediamine increased them, indicating that functional ASICs are composed of the subunits ASIC1, ASIC2, and ASIC3. Neomycin and streptomycin reduced the desensitization rate of the ASIC current in SGNs, indicating that ASICs may contribute to the ototoxic action of aminoglycosides. RT-PCR of the spiral ganglion revealed significant expression of all ASIC subunits. By immunohistochemistry the expression of the ASIC1a, ASIC2a, ASIC2b, and ASIC3 subunits was detected in SGNs. Although only a few SGNs exhibited action potential firing in response to an acidic stimulus, protons in the extracellular solution modulated SGN activity during sinusoidal stimulation. Our results show that protons modulate the excitability of SGNs via ASICs.

Keywords: ASIC; Corti; FMRFamide; acetylsalicylic acid; aminglycosides; auditory; inner ear; spiral ganglion.


Figures

FIGURE 1
FIGURE 1
Proton-gated currents in SGNs. (A) Current–pH curves. ASIC activation (blue squares) was fitted with a sigmoidal equation, resulting in a pH50 of 6.17 ± 0.05 and a slope of 0.43 ± 0.05; r2 = 0.99. The data represent the means ± SEM of at least six neurons. The top recordings show the activation of the proton-gated current by the different pH values indicated above each trace. The grey bar shows the pH change (5 s), and the dotted line indicates zero current. ASIC steady state desensitization (red circles) was fitted with a sigmoidal equation, resulting in a pH50 of 7.3 ± 0.03 and a slope of 0.14 ± 0.03; r2 = 0.99. The points represent the means ± SEM of at least four neurons. The bottom recordings show the currents activated by the pH 6.1 solution after perfusion in the conditional pH. (B) Na+-free solution reversibly abolished the proton-gated current. (C) Amiloride (100 μM), a non-specific ASIC blocker, reversibly blocked the proton-gated current.
FIGURE 2
FIGURE 2
Pharmacology of the ASICs in SGNs. Recordings of the ASIC current activated by a pH 6.1 solution (gray bar) under control conditions, after drug application, or after drug washout. The dotted line represents zero current. (A) coapplication of 100 μM Gd3+ reduced the Ipeak. (B) Coapplication of 300 μM Zn2+ () increased the Ipeak. (C) Sustained application of 100 μM Zn2+ also increased the Ipeak. (D) sustained application of 300 μM Zn2+ increased the τdes. (E) Coapplication of 10 μM TPEN increased the Ipeak. (F) Sustained application of 300 μM ASA significantly decreased the Ipeak and increased the τdes. (G) Preapplication of 100 μM FMRFamide reversibly increased the τdes and the Isus. (H) Bar graph summarizing the effects of the drugs used (A–G) The bars represent the means ± SE of the Ipeak (black bars), the Isus (light gray bars) or the τdes (dark gray bars). The data are expressed as the percent-change relative to the control value. (P < 0.05, ∗∗P < 0.01, paired Student’s t-test).
FIGURE 3
FIGURE 3
The effect of aminoglycosides on the ASIC current in SGNs. (A) Sustained application of 100 μM St produced a reversible reduction in the Ipeak and the τdes. (B) Sustained application of 100 μM Neo produced similar effects but at a reduced potency. (C) Bar graph summarizing the actions of the aminoglycosides. The bars represent the means ± SE of the Ipeak, the Isus, the Iint, or the τdes. The data are expressed as the percent-change relative to the control value (P < 0.05, paired Student’s t-test). Differences between concentrations were evaluated via one-way ANOVA (P < 0.05)
FIGURE 4
FIGURE 4
ASIC currents in SGN from P14–16 mice. (A) Top, Amiloride (Ami) blocks the peak of the ASIC current; Middle, FMRFamide (FMRF) increases the peak and sustained currents and reduces the desensitization rate; Bottom, St blocks the peak current, increases the sustained current and reduces the desensitization rate. (B) Bar plot summarizing the effects of the drugs from (A). The bars represent the means ± SE of the Ipeak (black bars), the Isus (light gray bars) or the τdes (dark gray bars). The data are expressed as the percent-change relative to the control value (P < 0.05, ∗∗P < 0.01, and paired Student’s t-test).
FIGURE 5
FIGURE 5
The RT-PCR products were separated in a 2% agarose gel electrophoresis and were stained with ethidium bromide. PCR was performed either in the presence (+) or absence (-) of reverse transcription (RT). (A,B) The PCR products corresponding to Asic1-4 were detected in the B and in the SG. (C) Expression of the housekeeping gene 18S was detected in B and SG. (D) Bar graph showing the expression of Asic1–4 in SG relative to that in B. The expected band sizes (bp) were 99, 169, 142, 116, and 129 for asic1, asic2, asic3, asic4, and 18S, respectively. 200 bp, +100 bp.
FIGURE 6
FIGURE 6
Immunostaining for ASICs in SGNs. Green, signal corresponding to a specific antibody for the indicated ASIC subunit; red, propidium iodide staining of the nuclei. (A–D) Immunohistochemistry of SG slices for ASIC subunits 1–4, respectively. (F–I) Immunocytochemistry of primary cultured cells for ASIC subunits 1–4 respectively. (E, J) control SG slices and cultured neurons, respectively, for which the primary antibody was omitted. In both the slices and the primary cultured neurons, all four ASIC subunits were detected. (K,L) Immunoperoxidase for ASIC1a and ASIC1b, respectively. Only ASIC1a subunit was localized to the SG. (M) Immunofluorescence staining for ASIC2a in the SG. (N) ASIC2b immunostaining in the SG.
FIGURE 7
FIGURE 7
Immunostaining for ASIC1 in whole cochlea slices. The IR for ASIC1 (red) was found in the fibers running from spiral ganglion to the OC, and a faint staining at the hair cell base region, most likely due to the presence of afferent terminals. The IR to calmodulin (green) was located at the hair cells. Blue staining corresponds to nuclei stained with DAPI.
FIGURE 8
FIGURE 8
Action potential discharges are activated by acidic solution. (A) An AP evoked in response to a pH 6.1 solution; inset shows the AP in larger scale. Only one AP discharge occurred, followed by a large depolarization of about 40 mV. The dotted line represents zero voltage, and line at the top indicates the duration of acidic extracellular perfusion. The membrane potential was set at about -90 mV. (B) Current and voltage clamp recording from a cell. Above the current clamp recording shows that acid perfusion (from pH 7.4–6.1 -grey area), evoked no AP discharge although a slowly raising depolarization of >20 mV was induced in response to a pH 6.1 solution perfusion. The time course of the depolarization and its decay neatly follows the time course of the inward current (below) caused by the acidic solution. The dotted line indicates -60 mV for current clamp and 0 pA for voltage clamp recording.
FIGURE 9
FIGURE 9
Effect of acidic pH perfusion on the AP response to sinusoidal stimulation. The AP discharge was evoked by sinusoidal current injection (20 Hz). (A) The depolarization produced by pH 7.0 perfusion reduced the AP amplitude (left trace); pH 6.1 transiently blocked the AP discharge (right trace). The bar above traces indicates perfusion of the acidic solution, either pH 6.1 or pH 7.0. The acidic solution produced a depolarization (about 10 mV for pH 7.0 and of >20 mV for pH 6.1), inhibiting the AP discharge after the beginning of the acidic solution application in a pH-dependent form. The insets above shows the AP in an expanded scale which demonstrate they display a typical AP morphology, with a rapid depolarizing phase, upstroke above 0 mV and repolarization followed by a hyperpolarization period. The AP discharge is phase locked to the sinusoidal stimulation one-cycle to one-AP. (B,C) The sinusoidal stimulation was set just below threshold to generate AP. (B) The acid perfusion produced a brief burst of AP followed by inhibition of AP discharge during the largest depolarization (accompanied by a significant decrease of input resistance which produced the decay of membrane response to sinusoidal stimuli), and then again a brief burst of APs. (C) The acid perfusion produced a brief burst followed by inhibition of AP discharge during the maximal depolarization and followed by sustained discharge during the whole-acid pulse.
FIGURE 10
FIGURE 10
Substitution of Na+ with Li+ in the recording solution (pH 7.4 or 6.1). (A) ASIC current recording under control conditions, after the substitution of extracellular Na+ with Li+ (blue), or after washout of the Li+ solution. The outward current after ASIC activation was clearly reduced. (B) Bar graph of the effects of Li+ on the ASIC current components (n = 7): Ipeak (red), Isus (blue), τdes (cyan), and the outward current (grey). The data are presented as the percent-change relative to the control value. (P < 0.05, ∗∗P < 0.01, and paired Student’s t-test).

Similar articles

Cited by

References

    1. Almanza A., Mercado F., Vega R., Soto E. (2008). Extracellular pH modulates the voltage-dependent Ca2+ current and low threshold K+ current in hair cells. Neurochem. Res. 33 1435–1441. 10.1007/s11064-007-9565-9 - DOI - PubMed
    1. Askwith C. C., Cheng C., Ikuma M., Benson C., Price M. P., Welsh M. J. (2000). Neuropeptide FF and FMRFamide potentiate acid-evoked currents from sensory neurons and proton-gated DEG/ENaC channels. Neuron 2 133–141. 10.1016/S0896-6273(00)81144-7 - DOI - PubMed
    1. Babinski K., Catarsi S., Biagini G., Seguela P. (2000). Mammalian ASIC2a and ASIC3 subunits co-assemble into heteromeric proton-gated channels sensitive to Gd3+. J. Biol. Chem. 275 28519–28525. 10.1074/jbc.M004114200 - DOI - PubMed
    1. Baron A., Schaefer L., Lingueglia E., Champigny G., Lazdunski M. (2001). Zn2+ and H+ are coactivators of acid-sensing ion channels. J. Biol. Chem. 276 35361–35367. 10.1074/jbc.M105208200 - DOI - PubMed
    1. Benson C. J., Xie J., Wemmie J. A., Price M. P., Henss J. M., Welsh M. J., et al. (2002). Heteromultimers o DEG/ENaC subunits form H+-gated channels in mouse sensory neurons. Proc. Natl. Acad. Sci. U.S.A. 99 2338–2343. 10.1073/pnas.032678399 - DOI - PMC - PubMed

LinkOut - more resources