Review
. 2015 Dec 17:6:383.
doi: 10.3389/fphys.2015.00383. eCollection 2015.

Pathway Analysis: State of the Art

Affiliations
Review

Pathway Analysis: State of the Art

Miguel A García-Campos et al. Front Physiol. .

Abstract

Pathway analysis is a set of widely used tools for research in life sciences intended to give meaning to high-throughput biological data. The methodology of these tools settles in the gathering and usage of knowledge that comprise biomolecular functioning, coupled with statistical testing and other algorithms. Despite their wide employment, pathway analysis foundations and overall background may not be fully understood, leading to misinterpretation of analysis results. This review attempts to comprise the fundamental knowledge to take into consideration when using pathway analysis as a hypothesis generation tool. We discuss the key elements that are part of these methodologies, their capabilities and current deficiencies. We also present an overview of current and all-time popular methods, highlighting different classes across them. In doing so, we show the exploding diversity of methods that pathway analysis encompasses, point out commonly overlooked caveats, and direct attention to a potential new class of methods that attempt to zoom the analysis scope to the sample scale.

Keywords: bioinformatics; functional class scoring; high-throughput biological data; over representation; pathway analysis; pathway-topology; systems biology.


Figures
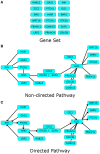
Figure 1
Figure 1
Pathway data-types. Different types of pathway data can represent one pathway in different levels of detail. Here we use the Hedgehog signaling pathway modified from Kyoto Encyclopedia of Genes and Genomes (KEGG) as toy example. (A) Gene sets are lists of biological components pertaining a definite biological theme; while (B) Non-directed pathways describe the existence of definite interactions between the same components in the form of a network; finally (C) directed pathways disclose the character of the interactions in the network. Arrows depict an activating impact from the pointer component over the pointed one, and blunt edges an inhibiting one.
Figure 2
Figure 2
Common outputs of PA tools. (A) Heatmap. Each cell of a heatmap represents a numerical value with a color code. In this case lower values are represented in blue, while higher values turn to red. This example shows data analyzed with Pathifier (Drier et al., 2013), the phenotypic information for data used in these calculations is irrelevant, it was used only for illustrative purposes. (B) Directed Acyclic Graph (DAG). DAGs can be used to represent partially ordered items. In this case, relevant GO categories are highlighted in red with their respective confidence values. This DAG is a partial result from the example data provided in WebGestalt (Zhang et al., 2005) website. (C) Statistical Relevance List. This kind of lists is the most common output in PA methods. In it, the statistical significance of the top pathways ranked on their p-values (NOM = nominal, FWER = Family wise error rate corrected, Size = size of the pathway) is shown. This is an example of data analyzed through Gene Set Enrichment Analysis (GSEA; Subramanian et al., 2005), used only for illustrative purposes.
Figure 3
Figure 3
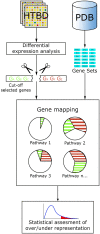
ORA general workflow. The main input for ORA methods is information from HTBD in the form of cut-off lists derived from expression analysis, and the pathway data in gene set format. Selected genes are mapped in the pathways, and statistical assessment of each pathway is performed using different tests.
Figure 4
Figure 4
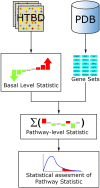
FCS general workflow. The main input for FCS methods are the HTBD and the pathways extracted from PDBs, in gene set format. All HTBD is used to calculate the basal level statistics, giving each component a value dependent of its differential expression. After this, the basal-level statistics of the components of each pathway is aggregated in a pathway-level statistic. Finally statistical assessment of the pathway-level statistics is performed.
Figure 5
Figure 5
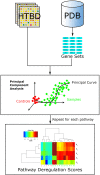
Pathifier workflow. Pathifier needs two inputs, a list of pathways in the gene set format, and HTBD labeled for two groups (controls vs. samples). It analyzes HTBD one pathway at a time. In this manner it gives a PDS for each sample-pathway pair, resulting in a matrix that can be examined through data driven approaches, in this case a hierarchical clustering analysis.
Figure 6
Figure 6
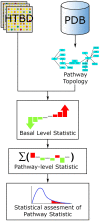
PTB analysis general workflow. The main inputs for PTB methods are the HTBD and the pathways extracted from PDBs, in pathway topology format. All HTBD and pathway topology is used to calculate the basal-level statistics. After this, the basal-level statistics of the components of each pathway is aggregated into a pathway-level statistic. Finally statistical assessment of the pathway-level statistics is performed.

References

    1. Ackermann M., Strimmer K. (2009). A general modular framework for gene set enrichment analysis. BMC Bioinformatics 10:47. 10.1186/1471-2105-10-47 - DOI - PMC - PubMed
    1. Adriaens M. E., Jaillard M., Waagmeester A., Coort S. L., Pico A. R., Evelo C. T. (2008). The public road to high-quality curated biological pathways. Drug Discov. Today 13, 856–862. 10.1016/j.drudis.2008.06.013 - DOI - PMC - PubMed
    1. Allison D. B., Cui X., Page G. P., Sabripour M. (2006). Microarray data analysis: from disarray to consolidation and consensus. Nat. Rev. Genet. 7, 55–65. 10.1038/nrg1749 - DOI - PubMed
    1. Amaral L. A., Ottino J. M. (2004). Complex networks. Eur. Phys. J. B Condens. Matter Complex Syst. 38, 147–162. 10.1140/epjb/e2004-00110-5 - DOI - PubMed
    1. Ashburner M., Ball C. A., Blake J. A., Botstein D., Butler H., Cherry J. M., et al. . (2000). Gene ontology: tool for the unification of biology. Nat. Genet. 25, 25–29. 10.1038/75556 - DOI - PMC - PubMed