. 2015 Dec 16:6:1405.
doi: 10.3389/fmicb.2015.01405. eCollection 2015.

Year-Long Metagenomic Study of River Microbiomes Across Land Use and Water Quality

Affiliations

Year-Long Metagenomic Study of River Microbiomes Across Land Use and Water Quality

Thea Van Rossum et al. Front Microbiol. .

Abstract

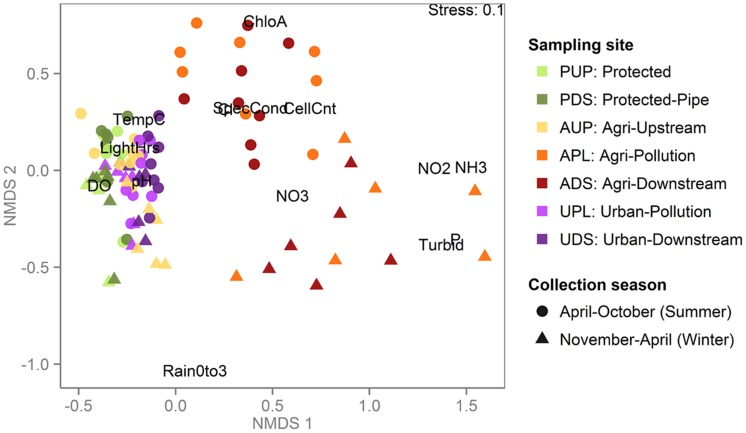
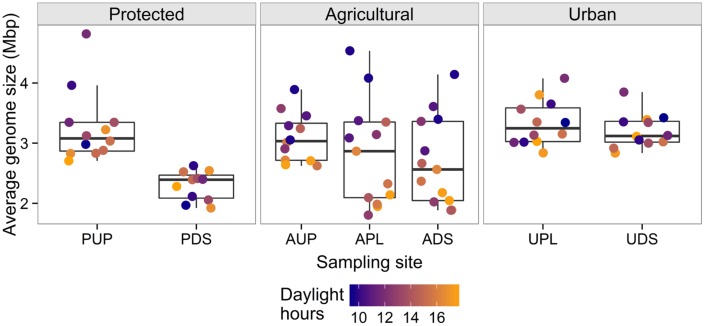
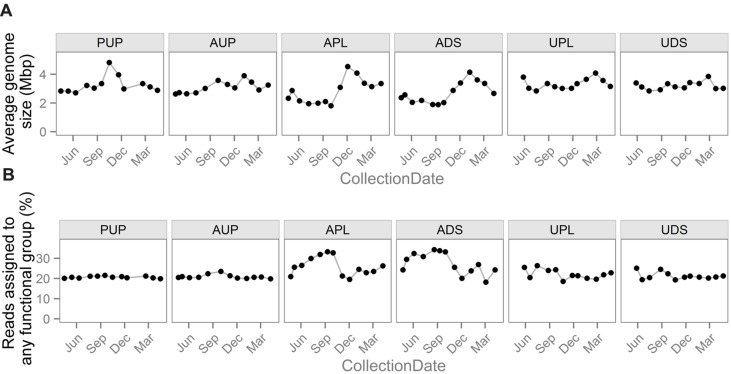
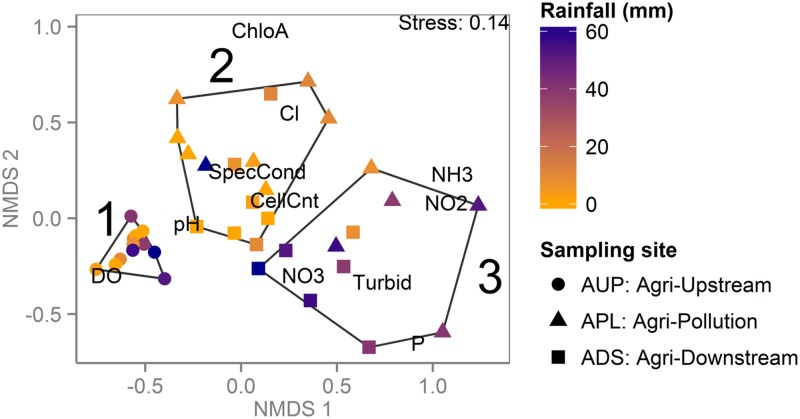
Select bacteria, such as Escherichia coli or coliforms, have been widely used as sentinels of low water quality; however, there are concerns regarding their predictive accuracy for the protection of human and environmental health. To develop improved monitoring systems, a greater understanding of bacterial community structure, function, and variability across time is required in the context of different pollution types, such as agricultural and urban contamination. Here, we present a year-long survey of free-living bacterial DNA collected from seven sites along rivers in three watersheds with varying land use in Southwestern Canada. This is the first study to examine the bacterial metagenome in flowing freshwater (lotic) environments over such a time span, providing an opportunity to describe bacterial community variability as a function of land use and environmental conditions. Characteristics of the metagenomic data, such as sequence composition and average genome size (AGS), vary with sampling site, environmental conditions, and water chemistry. For example, AGS was correlated with hours of daylight in the agricultural watershed and, across the agriculturally and urban-affected sites, k-mer composition clustering corresponded to nutrient concentrations. In addition to indicating a community shift, this change in AGS has implications in terms of the normalization strategies required, and considerations surrounding such strategies in general are discussed. When comparing abundances of gene functional groups between high- and low-quality water samples collected from an agricultural area, the latter had a higher abundance of nutrient metabolism and bacteriophage groups, possibly reflecting an increase in agricultural runoff. This work presents a valuable dataset representing a year of monthly sampling across watersheds and an analysis targeted at establishing a foundational understanding of how bacterial lotic communities vary across time and land use. The results provide important context for future studies, including further analyses of watershed ecosystem health, and the identification and development of biomarkers for improved water quality monitoring systems.

Keywords: bacteria; freshwater; land use; metagenomics; normalization; rivers; temporal variation.


Figures

FIGURE 1
FIGURE 1
Agriculturally affected sites are distinct from protected and urban sites when clustered by water chemistry and environmental variables. Non-metric multidimensional scaling (NMDS) plot based on environmental and chemical water measurements in which each point represents a sample, colored by sampling site and shaped by season during which the sample was collected. Environmental measures are abbreviated as in Table 2. Samples from the agriculturally affected sites (APL and ADS) are most distinct, with summer and winter samples mostly clustering together, reflecting the winter’s increased rain and consequent agricultural runoff. All other samples are more similar to each other than to the agriculturally affected sites, including the samples from the agricultural watershed that were collected upstream of agricultural activity (AUP).
FIGURE 2
FIGURE 2
Metagenomes clustered by reference-free k-mer analysis show effect of sampling site, weather conditions, and water chemistry. (A) Hierarchical clustering of samples based on metagenome k-mer composition. Each terminal node (leaf) is a sample, colored by sampling site. Roman numerals label major clusters, Arabic numerals label sub-clusters outlined in gray dashed lines. (B) NMDS plot based on k-mer abundance distributions in which each point represents a sample, colored by sampling site. Clusters outlined and numbered in black correspond to numbered clusters in (A). Environmental variables were correlated with ordination axes using envfit and are displayed using gray arrows, where lengths of arrows correspond to the strength of the correlation between the variable and the ordination (only variables with p < 0.05 displayed) and direction corresponds to increasing value (e.g., samples closer to the bottom of the plot have higher DO). Environmental measures are abbreviated as in Table 2. The percentage of nucleotides that are G or C is abbreviated as “%GC”. Sampling site is the major distinction among metagenomes from flowing surface water versus water collected from a reservoir-fed pipe (PDS). Among surface water samples, clustering reflects samples’ collection date, water chemistry and land use.
FIGURE 3
FIGURE 3
Average genome size (AGS) across sampling sites, colored by daylight hours, illustrating correlations within the agricultural watershed. Points represent samples and are jittered on the x-axis for visibility. The agriculturally affected sites (APL, ADS) have the largest ranges of values. There is a significant negative correlation between AGS and daylight hours in all sites in the agricultural watershed and a corresponding trend in PUP.
FIGURE 4
FIGURE 4
Normalization factors used in different strategies to enable comparisons of gene group abundances between samples. Notable differences exist among sites and over time in both (A) average genome size and (B) the percentage of reads assigned to any gene functional group. This variability demonstrates how normalization schemes using these values can have a drastic effect on downstream analyses.
FIGURE 5
FIGURE 5
Agricultural watershed samples clustered by water chemistry reveal impact of land use and rainfall. NMDS plot based on environmental and chemical water measurements for samples from the agricultural watershed. Each point represents a sample, colored by cumulative rainfall over 3 days prior to sampling and shaped by sampling site. Significant clusters are outlined and numbered in black. Samples collected upstream of agricultural activity (Cluster 1) have higher DO levels. Samples collected in the summer from the agriculturally affected sites (Cluster 2) have higher chlorophyll a concentration, while the winter samples are more affected by runoff, as indicated by higher nutrient levels and turbidity (Cluster 3).

References

    1. Aggarwal C. C., Hinneburg A., Keim D. A. (2001). On the surprising behavior of distance metrics in high dimensional spaces. Database Theory 1973 420–434.
    1. Angly F. E., Willner D., Prieto-Davó A., Edwards R. A., Schmieder R., Vega-Thurber R., et al. (2009). The GAAS metagenomic tool and its estimations of viral and microbial average genome size in four major biomes. PLoS Comput. Biol. 5:e1000593 10.1371/journal.pcbi.1000593 - DOI - PMC - PubMed
    1. Benjamini Y., Hochberg Y. (1995). Controlling the false discovery rate: a practical and powerful approach to multiple testing. J. R. Stat. Soc. Ser. B 57 289–300.
    1. Beszteri B., Temperton B., Frickenhaus S., Giovannoni S. J. (2010). Average genome size: a potential source of bias in comparative metagenomics. ISME J. 4 1075–1077. 10.1038/ismej.2010.29 - DOI - PubMed
    1. Bolger A. M., Lohse M., Usadel B. (2014). Trimmomatic: a flexible trimmer for Illumina sequence data. Bioinformatics 30 2114–2120. 10.1093/bioinformatics/btu170 - DOI - PMC - PubMed

LinkOut - more resources