. 2015 Oct 27;2(12):1041-54.
doi: 10.1002/acn3.254. eCollection 2015 Dec.

Hypomyelination following deletion of Tsc2 in oligodendrocyte precursors

Affiliations

Hypomyelination following deletion of Tsc2 in oligodendrocyte precursors

Robert P Carson et al. Ann Clin Transl Neurol. .

Abstract

Objective: While abnormalities in myelin in tuberous sclerosis complex (TSC) have been known for some time, recent imaging-based data suggest myelin abnormalities may be independent of the pathognomonic cortical lesions ("tubers"). Multiple mouse models of TSC exhibit myelination deficits, though the cell types responsible and the mechanisms underlying the myelin abnormalities remain unclear.

Methods: To determine the role of alterations in mTOR signaling in myelination, we generated a conditional knockout (CKO) mouse model using Cre-recombinase and the Olig2 promoter to inactivate the Tsc2 gene in oligodendrocyte precursor cells.

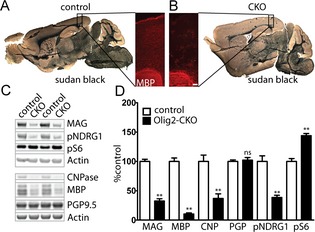
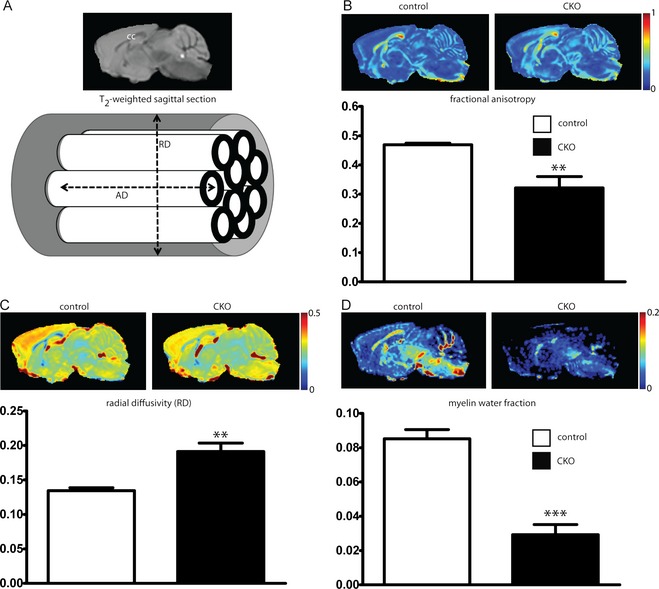
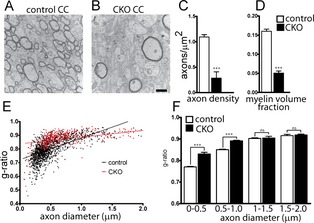
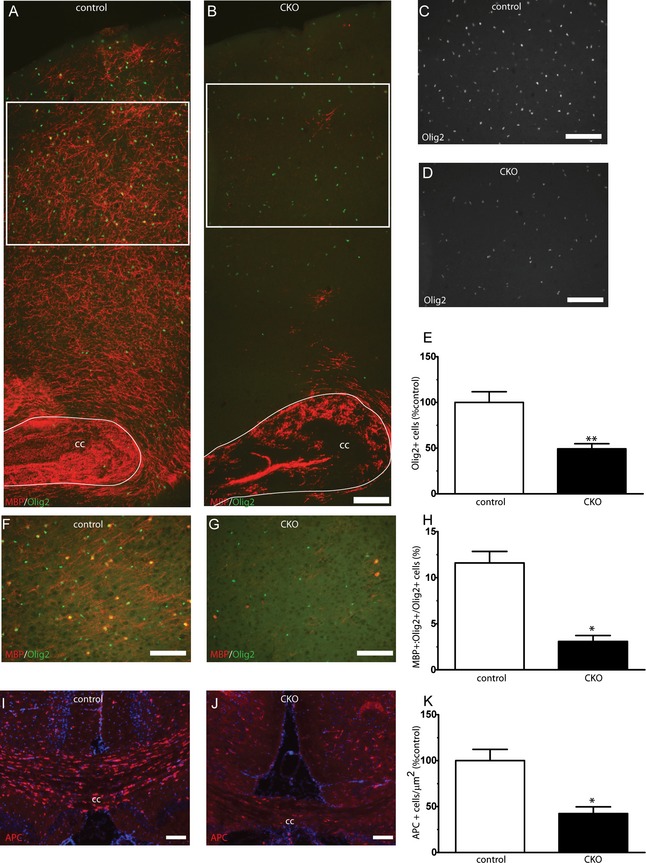
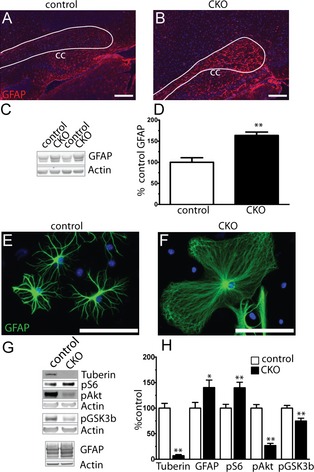
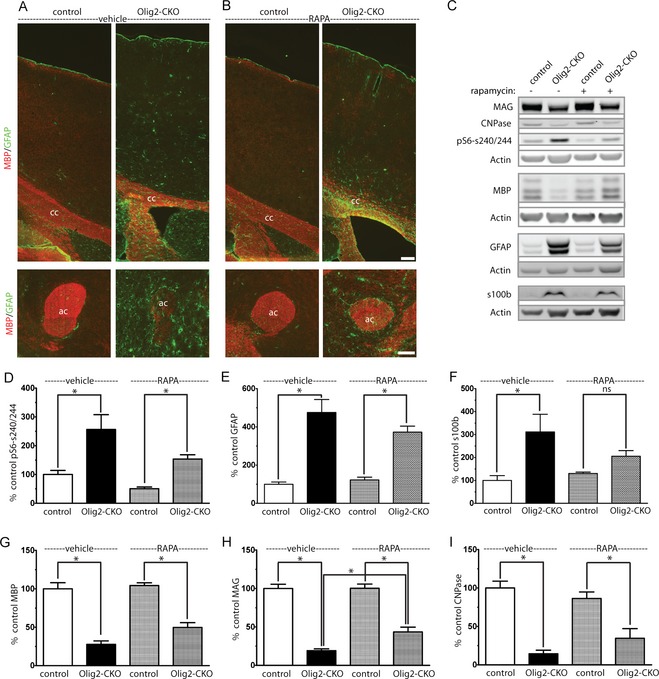
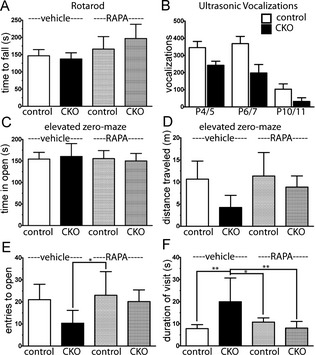
Results: Characterization of myelin and myelin constituent proteins demonstrated a marked hypomyelination phenotype. Diffusion-based magnetic resonance imaging studies were likewise consistent with hypomyelination. Hypomyelination was due in part to decreased myelinated axon density and myelin thickness as well as decreased oligodendrocyte numbers. Coincident with hypomyelination, an extensive gliosis was seen in both the cortex and white matter tracks, suggesting alterations in cell fate due to changes in mTOR activity in oligodendrocyte precursors. Despite a high-frequency appendicular tremor and altered gait in CKO mice, no significant changes in activity, vocalizations, or anxiety-like phenotypes were seen.

Interpretation: Our findings support a known role of mTOR signaling in regulation of myelination and demonstrate that increased mTORC1 activity early in development within oligodendrocytes results in hypomyelination and not hypermyelination. Our data further support a dissociation between decreased Akt activity and increased mTORC1 activity toward hypomyelination. Thus, therapies promoting activation of Akt-dependent pathways while reducing mTORC1 activity may prove beneficial in treatment of human disease.


Figures

Figure 1
Figure 1
Hypomyelination secondary to loss of Tsc2 from oligodendrocytes. Sudan black and MBP immunofluorescence staining of P70 control and Olig2‐CKO brains demonstrates diffuse decreases in myelin (A, B). Cortical expression of the myelin proteins MBP, MAG, and CNPase are significantly decreased in P70 cortex (C, D). Activation of mTORC1 signaling (pS6) and attenuation of mTORC2 (pNDRG1) signaling is seen with increased S6 phosphorylation and decreased NDRG1 phosphorylation, respectively. n = 3–6 animals per group. **P < 0.01. MBP, myelin basic protein; CKO, conditional knockout; MAG, myelin‐associated glycoprotein; CNPase, 2′,3′‐cyclic nucleotide 3′‐phosphodiesterase; NDRG1, N‐Myc downstream regulated 1.
Figure 2
Figure 2
Decreased fractional anisotropy and myelin total water fraction following loss of Tsc2. P60 control and Tsc2‐Olig2 CKO mice were imaged ex vivo with a 15.2T MRI scanner. Traditional T2‐weighted imaging for anatomical reference (A). Fractional anisotropy was decreased (B) secondary to increases in radial diffusivity (C). The myelin water fraction, a more specific marker for myelin quantity, is also significantly reduced, consistent with hypomyelination (D). n = 5 animals per group. **P < 0.01, ***P < 0.001. CKO, conditional knockout; MRI, magnetic resonance imaging.
Figure 3
Figure 3
Decreased myelin density and myelin thickness in Tsc2‐Olig2 CKO. Electron micrographs from P60 littermate control (A) and Tsc2‐Olig2 CKO (B) CC demonstrate a decreased density of myelinated axons in CKO (C) brains as well as a reduction in the myelin volume fraction (D). Scale bar = 500 nm. Myelin thickness is decreased as demonstrated by an increased G ratio in Tsc2‐Olig2 CKO CC (E). G ratio plotted as a function of axon diameter bins (F). n > 50 axons from three animals per genotype. ***P < 0.001 by Student's t‐test. CKO, conditional knockout; CC, corpus callosum.
Figure 4
Figure 4
Hypomyelination and decreased oligodendrocyte numbers in CKO cortex and white matter tracts. Olig2‐positive oligodendrocyte precursors were identified with immunofluorescence. Decreased numbers of cortical Olig2+ cells were seen in CKO cortex (B, D‐E) versus wild‐type control cortex (A, C, E). Cortical regions from where cell counts occurred in (C, D) are noted with white inset boxes on (A, B). Reduced MBP+/Olig2+ mature cortical oligodendrocyte number (F–H). Reduced APC+ oligodendrocyte numbers were seen from the corpus callosum of CKO animals versus littermate controls (I–K). Scale bar = 100 μm. N = 3–6 animals per group. *P < 0.05, **P < 0.01. CKO, conditional knockout; MBP, myelin basic protein.
Figure 5
Figure 5
Diffuse cortical and white matter astrogliosis following loss of Tsc2. Sagittal sections from P17 CKO brains (B) demonstrated a qualitative increase in expression of the astrocyte marker GFAP in the corpus callosum and cortex versus controls (A). Scale bar = 100 μm. GFAP expression level is significantly increased in P17 cortical extracts (C, D). n = 4–5 animals per group. **P < 0.01. Astrocytes from primary cultures of CKO cortex demonstrated an abnormal morphology and increase in size relative to control astrocytes (E, F). Western blot analysis of primary astrocyte culture extracts (G, H). Data represent mean ± SEM, n = 4–7 extracts per group. *P < 0.05, **P < 0.01. CKO, conditional knockout; GFAP, glial fibrillary acidic protein.
Figure 6
Figure 6
Improved myelination but persistent gliosis following rapamycin treatment. CKO and littermate control animals were treated with rapamycin 3 mg/kg, 5 days per week from P30 to P60. P60 sagittal brain sections were stained with MBP to identify myelin and GFAP to identify astroctyes (A, B) (cc – corpus callosum, ac – anterior commissure) Scale bar = 100 μm. Gliosis was increased as identified GFAP and s100β expression (C, E, and F) and remained significantly elevated despite rapamycin treatment (D). Expression of MAG improved with rapamycin treatment but did not completely normalize (C, G–I). Data represent mean ± SEM, n = 4 animals per group. *P < 0.05 by one‐way ANOVA followed by Tukey's multiple comparison test. CKO, conditional knockout; MBP, myelin basic protein; GFAP, glial fibrillary acidic protein; MAG, myelin‐associated glycoprotein; ANOVA, analysis of variance.
Figure 7
Figure 7
Absence of motor deficits, anxiety phenotype, or communication deficits with loss of Tsc2 in oligodendrocytes. To determine the presence of a motor defects, time to fall during rotarod testing was determined in P60‐ to P70‐day‐old CKO and control mice treated with vehicle or RAPA from P30 until day of testing (A). Ultrasonic vocalizations were used to determine the presence of a communication deficit in the Tsc2 Olig2 CKO mice pups from P4 to P11 (B). The presence of an anxiety phenotype was analyzed with the elevated zero maze in P60–70 mice treated with vehicle or rapamycin from P30. Time in the open arm (C), as well as overall distance traveled (D), entries to the open (E), and duration of visit to the open arm (F) were determined in control and CKO mice following vehicle and rapamycin treatment. n = 8–15 animals per group. *P < 0.05, **P < 0.01 by one‐way ANOVA versus the control vehicle group. CKO, conditional knockout; RAPA, rapamycin; ANOVA, analysis of variance.

References

    1. Arulrajah S, Ertan G, Jordan L, et al. Magnetic resonance imaging and diffusion‐weighted imaging of normal‐appearing white matter in children and young adults with tuberous sclerosis complex. Neuroradiology 2009;51:781–786. - PubMed
    1. Simao G, Raybaud C, Chuang S, et al. Diffusion tensor imaging of commissural and projection white matter in tuberous sclerosis complex and correlation with tuber load. AJNR Am J Neuroradiol 2010;31:1273–1277. - PMC - PubMed
    1. Basser PJ, Pierpaoli C. Microstructural and physiological features of tissues elucidated by quantitative‐diffusion‐tensor MRI. J Magn Reson B 1996;111:209–219. - PubMed
    1. Peters JM, Sahin M, Vogel‐Farley VK, et al. Loss of white matter microstructural integrity is associated with adverse neurological outcome in tuberous sclerosis complex. Acad Radiol 2012;19:17–25. - PMC - PubMed
    1. Wolff JJ, Gu HB, Gerig G, et al. Differences in white matter fiber tract development present from 6 to 24 months in infants with autism. Am J Psychiatry 2012;169:589–600. - PMC - PubMed

LinkOut - more resources