. 2016 Jan 21;529(7586):413-417.
doi: 10.1038/nature16508. Epub 2016 Jan 6.

Response and resistance to BET bromodomain inhibitors in triple-negative breast cancer

Affiliations

Response and resistance to BET bromodomain inhibitors in triple-negative breast cancer

Shaokun Shu et al. Nature. .

Abstract

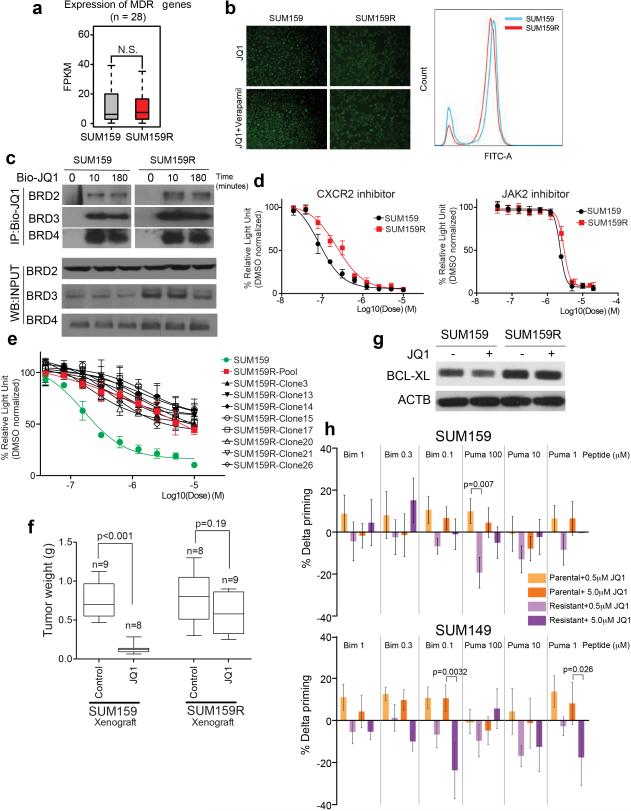
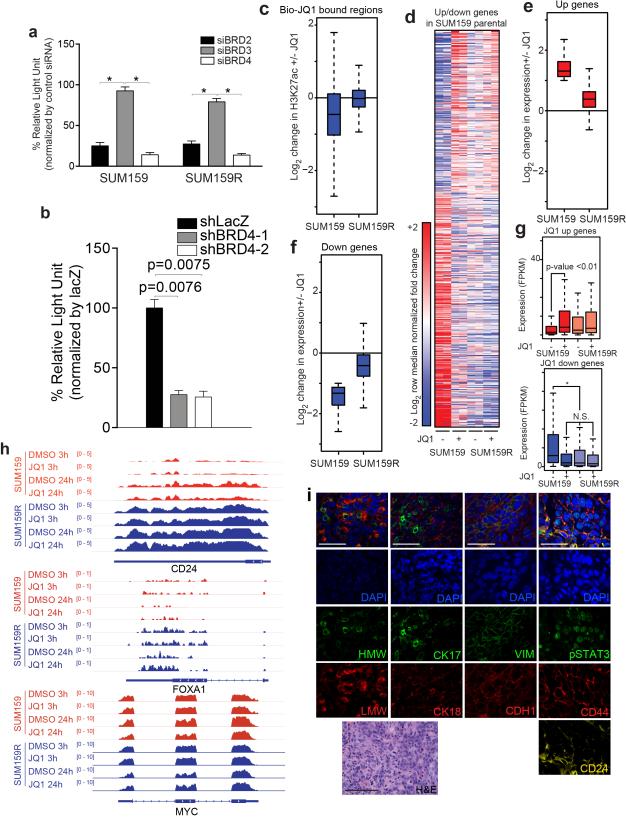
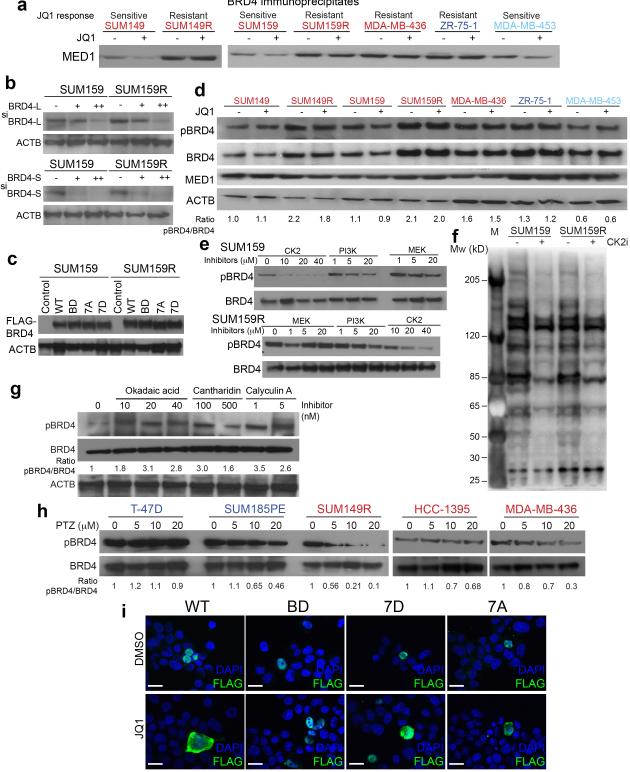
Triple-negative breast cancer (TNBC) is a heterogeneous and clinically aggressive disease for which there is no targeted therapy. BET bromodomain inhibitors, which have shown efficacy in several models of cancer, have not been evaluated in TNBC. These inhibitors displace BET bromodomain proteins such as BRD4 from chromatin by competing with their acetyl-lysine recognition modules, leading to inhibition of oncogenic transcriptional programs. Here we report the preferential sensitivity of TNBCs to BET bromodomain inhibition in vitro and in vivo, establishing a rationale for clinical investigation and further motivation to understand mechanisms of resistance. In paired cell lines selected for acquired resistance to BET inhibition from previously sensitive TNBCs, we failed to identify gatekeeper mutations, new driver events or drug pump activation. BET-resistant TNBC cells remain dependent on wild-type BRD4, which supports transcription and cell proliferation in a bromodomain-independent manner. Proteomic studies of resistant TNBC identify strong association with MED1 and hyper-phosphorylation of BRD4 attributable to decreased activity of PP2A, identified here as a principal BRD4 serine phosphatase. Together, these studies provide a rationale for BET inhibition in TNBC and present mechanism-based combination strategies to anticipate clinical drug resistance.


Figures

Extended Data Figure 1
Extended Data Figure 1. BET bromodomain proteins and cell growth in TNBCs
All error bars represent SD, n=3. a, Cellular viability of SUM159 and MDA-MB-231 cells expressing TET-inducible BRD4-targeting or lacZ shRNAs. P-values indicate statistical significance of the observed differences (paired t-test). b, Cellular viability four days after transfection of siRNAs targeting BET bromodomain proteins. *indicate statistical significance (paired t-test) of the marked differences as follows: SUM159: siBRD2 vs. siBRD3, p=0.002; siBRD3 vs. siBRD4, p=0.0006, MDA-MB-231: siBRD2 vs. siBRD3, p=0.006; siBRD2 vs. siBRD4, p=0.002; siBRD3 vs. siBRD4, p=0.016, MDA-MB-468: siBRD2 vs. siBRD3, p=0.0009; siBRD3 vs. siBRD4, p=0.0055, MDA-MB-436: siBRD2 vs. siBRD4, p=0.002; siBRD3 vs. siBRD4, p=0.015, ZR-75-1: siBRD2 vs. siBRD3, P=0.0169; siBRD3 vs. siBRD4, p=0.007. c, Immunoblot analysis of BET bromodomain proteins four days after siRNA transfection. d, Cell cycle profile of SUM159 cells synchronized in G2/M with 100ng/ml nocodazole followed by replating to fresh medium with DMSO or JQ1 (500nM) added at -1h or at 3h after release. Cells were collected at different time points (0, 6, 12h) after release. e, Immunoblot analysis of the indicated proteins at different time points (0, 3, 6, 12h) after release of SUM159 cells synchronized with 100ng/ml nocodazole followed by replating to fresh medium with DMSO or JQ1 (500nM) added at 1hr before or 3hrs after release. f, Cell cycle analysis of SUM159 cells following 72 hr treatment with JQ1 (500nM) or downregulation of BRD4 using TET-inducible shRNAs. g, Annexin V staining of SUM159 cells following 72 hr treatment with JQ1 (500nM) downregulation of BRD4 using TET-inducible shRNAs. All error bars represent SEM. h, Immunoblot analysis of the indicated proteins in a panel of breast cell lines; color scheme as in panel a. For gel source data, see Supplementary Figure 1.
Extended Data Figure 2
Extended Data Figure 2. Response to BBIs in TNBCs
a, Immunoblot analysis of the indicated proteins at different time points following JQ1 treatment (500nM) in SUM159 cells (top) and at different JQ1 doses for 24h treatment in SUM159 and MDA-MB-436 cells (bottom). b, Immunoblot analysis of the indicated proteins at different time points following JQ1 treatment (500nM) in SUM149, SUM159 and MDA-MB-231 cells. c, H&E staining of SUM159 cells after 3 days of JQ1 treatment. d, - Senescence β-galactosidase staining of SUM159 and MDA-MB-231 cells after 3 days of JQ1 treatment. Scale bars show 100μm. e, Box plots depict the weights of xenografts 30 days after injection of MDA-MB-231 (2×10⁶) and IDC50X (2×105) cells into inguinal mammary fat pads of NOG mice; n indicates the number of mice/experiment. P-values indicate statistical significance of the observed differences (unpaired t-test). Error bars represent SEM. Mice were administered JQ1 (50mg/kg, daily) or vehicle only (control) for 14 days beginning at day 16 (MDA-MB-231) or 10 (IDC50X) after injection (after tumors reached palpable size). For EL12-58X PDX, mice were implanted with pieces of tissue measuring 1×3×3mm into the inguinal mammary fat pads and were administered daily JQ1 (50mg/kg) for 14 days beginning at day 21 after injection (after tumors reached palpable size). f, Bromodeoxyuridine (BrdU) and luminal low (Low MW CK) and basal high (High MW CK) molecular weight cytokeratin staining of EL12-58 xenograft with or without JQ1 treatment. Scale bars show 50μm. g, Tumor volume of SUM159 cells expressing TET-inducible BRD4-targeting shRNAs. Mice were administered doxycycline or vehicle only (control) for 39 days beginning at day 21 after injection (after tumors reached palpable size). Error bars represent SD, n=4 (shBRD4-1 experiment) and n=5 (shBRD4-2 experiment) h, Hematoxylin-eosine staining and immunofluorescence analysis of basal (basal cytokeratin, cytokeratin 17, pSTAT3, and CD44) and luminal (luminal cytokeratin, cytokeratin 18, and CD24) markers in SUM159 xenografts with or without JQ1 treatment. Scale bars show 100μm for H&E and 50μm for immunofluorescence, respectively. For gel source data, see Supplementary Figure 1.
Extended Data Figure 3
Extended Data Figure 3. SUM149 JQ1 response
a, Scatter plots showing the relationship between the genomic binding of BRD4 and Bio-JQ1 (left) or H3K27ac and Bio-JQ1 (right) at all Bio-JQ1 enriched bound regions. Units of genomic occupancy are in rpm/bp. A simple linear regression is drawn in black. Pearson correlation statistics are also shown. b, Boxplots showing the log2 fold change in BRD4 +/− JQ1 (left) or H3K27ac +/− JQ1 (right) at Bio-JQ1 bound regions in SUM159. The 12,999 Bio-JQ1 regions are ranked by increasing Bio-JQ1 binding and divided into 10 separate bins (displayed from left to right). The statistical significance of the difference in the mean BRD4 log2 fold change between the weakest and strongest Bio-JQ1 bound region bins is shown (Welch's t-test *** p-value < 1e-10). c, Boxplots showing the log2 fold change in BRD4 +/− JQ1 (left) or H3K27ac +/− JQ1 (right) at BRD4 bound regions in SUM149. The 5,696 BRD4 bound regions are ranked by increasing background subtracted BRD4 binding and divided into 10 separate bins (displayed from left to right). The statistical significance of the difference in the mean BRD4 log2 fold change between the weakest and strongest BRD4 bound region bins is shown (Welch's t-test *** p-value < 1e-10). d, Ranked plots of enhancers defined in untreated SUM149 cells ranked by increasing BRD4 signal (units rpm). Enhancers are defined as regions of BRD4 binding not contained in promoters. The cutoff discriminating typical from super-enhancers is shown as a dashed gray line. Enhancers associated with TNBC characteristic genes are highlighted. e, Scatter plots showing the relationship between the log2 fold change in gene expression upon 12hr JQ1 treatment in SUM149 (y-axis) and SUM159 (x-axis). A simple linear regression is drawn in red. The Pearson correlation statistic is also shown. f, Boxplots showing the log2 fold change in expression relative to DMSO control of either all active genes or super-enhancer (SE) associated upon 12hr JQ1 treatment. The statistical significance of the difference in expression change between all active genes and super-enhancer associated genes is shown by a Welch's t-test * p-value < 1e-3). g, Heatmap showing the expression of genes that are up or down regulated by JQ1 versus DMSO after 24 hours treatment. Each row shows the expression of a single gene in either DMSO or JQ1 treated cells at 3, 12, and 24 hours after treatment. Expression values are colored according to fold change relative to the median for each row. Genes are ordered by fold change +/− JQ1 24 hours after treatment. h, Heatmap showing the expression of genes that are up or down regulated by JQ1 versus DMSO after 12 hours treatment in SUM149 and SUM149R cells. Each row shows the expression of a single gene in either DMSO or JQ1 treated cells at 12 hours after treatment. Expression values are colored according to fold change relative to the median for each row. Genes are ordered by fold change +/− JQ1 12 hours after treatment in SUM149 cells. i,j, Boxplots showing the log2 fold change in expression at genes that are up (i) or down (j) regulated by JQ1 versus DMSO after 12 hours of treatment in parental SUM149 cells. Log2 fold change in expression is shown for either parental SUM149 (left) or resistant SUM149R (right) cells. k, Top signaling pathways affected by JQ1-induced gene expression changes in SUM159 cells. l, Viable cell numbers of SUM149 (left) and SUM149R (right) treated with different doses of JQ1 (2μM, 10μM). Error bars represent SD, n=3. P-values indicate statistical significance of the observed differences (two-way ANOVA with Bonferroni multiple comparison correction).
Extended Data Figure 4
Extended Data Figure 4. Characterization of SUM159R cells
a, Expression of ABC transporters in SUM159 and SUM159R cells. The expression of 29 ABC transporters was analyzed based on RNA-seq data on the two cell lines. b, Assay for MDR (multi drug resistance) pumps in SUM159 and SUM159R cells treated with JQ1 alone or together with verapamil based on microscopic examination (left) and FACS (right) of cells labeled with fluorescent MDR substrate. c, Immunoprecipitation analysis of Biotinylated JQ1 (Bio-JQ1) in SUM159 and SUM159R cells with JQ1 treatment at different time points following immunoblot for the indicated proteins. d, Cellular viability of SUM159 and SUM159R cells treated with CXCR2 and JAK2 inhibitors. Error bars represent SD, n=3. e, Cellular viability of SUM159, and pool and single cell clones of SUM159R cells treated with different doses of JQ1. Error bars represent SD, n=3. f, Tumor weight of xenografts derived from SUM159 and SUM159R cells. Mice were administered JQ1 for 14 (SUM159) and 30 (SUM159R) days beginning at day 14 and 26, respectively, after injection. P-values indicate statistical significance of the observed differences (unpaired t-test). Error bars represent SEM. g, Immunoblot analysis of BCL-XL expression in SUM159 and SUM159R cells before and after JQ1 3h treatment (500nM). h, Dynamic BH3 profiling reveals inverse apoptotic response to JQ1 in SUM149R and SUM159R cells. In parental lines JQ1 increases priming relative to untreated cells indicating an increase in apoptotic propensity. In resistant lines JQ1 reduces priming indicating greater resistance to apoptosis relative to untreated cells. P-values indicate statistical significance of the observed differences (two-way ANOVA). Error bars represent SEM, n=5. For gel source data, see Supplementary Figure 1.
Extended Data Figure 5
Extended Data Figure 5. BRD4 binding in SUM159R cells
a, Cellular viability of SUM159 and SUM159R cells transfected with siRNAs targeting bromodomain proteins. *indicate statistical significance (paired t-test) of the marked differences as follows: SUM159: siBRD2 vs. siBRD3, p=0.013, siBRD3 vs. siBRD4, p=0.0154 and SUM159R: siBRD2 vs. siBRD3, p=0.0159, siBRD2 vs. siBRD4, p=0.0048; siBRD3 vs. siBRD4, p=0.0068. b, Cellular viability of SUM159R cells expressing TET-inducible BRD4-targeting or lacZ shRNAs. All error bars represent SEM. P-values indicate statistical significance of the observed differences (unpaired t-test). c, Boxplot showing the log2 fold change in H3K27ac genomic occupancy at regions bound by Bio-JQ1 in parental SUM159 or resistant SUM159R cells. d, Heatmap showing the expression of genes that are up or down regulated by JQ1 versus DMSO after 24 hours treatment in parental SUM159 cells. Each row shows the expression of a single gene in either DMSO or JQ1 treated cells at 24 hours after treatment in SUM159 cells (left four columns) or SUM159R cells (right four columns). Expression values are colored according to fold change relative to the median for each row. Genes are ordered by fold change +/− JQ1 24 hours after treatment. e,f, Boxplots showing the log2 fold change in expression at genes that are up (e) or down (f) regulated by JQ1 versus DMSO after 24 hours of treatment in parental SUM159 cells. Log2 fold change in expression is shown for either parental SUM159 or resistant SUM159R cells. g, Boxplots showing expression of genes that are up or down regulated by JQ1 versus DMSO after 24 hours of treatment in parental SUM159 cells. Expression is shown in DMSO and JQ1-treated conditions in units of FPKM for either parental SUM159 (left) or resistant SUM159R (right) cells. The statistical significance of the difference between gene expression distributions for SUM159 DMSO and JQ1 treated cells is shown (p <0.01). The difference between all other distributions are considered non significant (N.S). The statistical significance of the difference between SUM159 DMSO gene expression distribution and all other distributions is shown (* p-value < 1e-3). The difference between all other distributions are considered non significant. h, Examples of luminal and basal cell-specific genes, and MYC in SUM159 and SUM159R cells. RNA-seq tracks are shown. i, H&E staining and immunofluorescence analysis of luminal (CK18 and LMW) and basal (CK17 and HMW) cytokeratins and luminal (VIM and CD24) and basal (CDH1, CD44, and pSTAT3) cell markers in SUM159R xenografts. All error bars represent SEM. Scale bars show 100μm for H&E and 50μm for IF respectively.
Extended Data Figure 6
Extended Data Figure 6. JQ1 response in other breast cancer cell lines
a,b, Gene tracks depicting BRD4 + DMSO and BRD4 + JQ1 in multiple TNBC cells at the BCL-xL (a) or SOD2 (b) gene loci. The x-axis shows position along the chromosome with gene structures drawn below. The y-axis shows genomic occupancy in units of rpm/bp. The BCL-xL and SOD2 super-enhancers are shown as a red bar at the top. c, Box plots showing the log2 fold change in BRD4 occupancy +/− JQ1 for all BRD4 bound regions in each cell line for multiple TNBC. Cell lines are ordered by their JQ1 (IC50) and colored by their sensitivity. d, Gene tracks depicting H3K27AC occupancy at the BCL-xL locus in SUM149 parental (top, light blue) or SUM149R resistant (bottom, dark blue) cells. The x-axis shows position along the chromosome with gene structures drawn below. The y-axis shows genomic occupancy in units of rpm/bp. All error bars represent SEM.
Extended Data Figure 7
Word clouds depicting BRD4-associated proteins identified in RIME analysis.
Extended Data Figure 8
Extended Data Figure 8. Mechanism of BBI-resistance
a, Immunoblot analysis of BRD4 immunoprecipitates for MED1 in the indicated cell lines with or without JQ1 treatment (5uM, 3h). b, Immunoblot analysis of long (BRD4L) and short (BRD4S) forms of BRD4 after transfection of siRNAs. c, Immunoblot analysis of the indicated exogenously expressed FLAG-tagged BRD4 proteins in SUM159 and SUM159R cells. d, Immunoblot analysis of phospho-BRD4 (pBRD4) and BRD4 in SUM159 and SUM159R cells treated with the indicated doses of CK2, PI3K, and MEK inhibitors for 2hrs. e, Immunoblot analysis of pBRD4, BRD4, MED1 and ACTB in the indicated cell lines with or without JQ1 treatment. f, Immunoblot analysis of CK2 substrates in SUM159 and SUM159R cells following CK2 inhibitor (CX-4945, 10μM) 3h treatment. g, Immunoblot analysis of pBRD4 and BRD4 in SUM149 cell line treated with different doses of the indicated PP2A inhibitors for 3hrs. ACTB was used as loading control. h, Immunoblot analysis of pBRD4 and BRD4 in the indicated cell lines treated with different doses of phenothiazine for 6hrs. i, Immunofluorescence analysis of exogenous FLAG-tagged BRD4 proteins (WT, BD, 7D and 7A) in SUM159 cells with or without JQ1 treatment (5μM, 3hrs). Scale bars show 20μm. For gel source data, see Supplementary Figure 1.
Extended Data Figure 9
Phospho-BRD4 levels in xenografts and primary TNBC samples. a, Immunofluorescence analysis of phospho-BRD4 (pBRD4) in SUM159 parental and SUM159R xenografts showing that resistance is associated with higher pBRD4 levels. b, Examples of pBRD4 immunofluorescence in patient tumors depicting variability among different TNBC samples. Scale bars show 50μm. c. Mean intensity of phospho-BRD4 (pBRD4) in tissue samples from 83 patients with early-stage triple negative breast cancer (TNBC). d, Examples of AR and basal cytokeratin (bCK, HMW CK) immunofluorescence in TNBC samples. Scale bars show 50μm. e, Box plot depicting pBRD4 signal intensity in TNBCs tumors with the indicated AR and bCK expression patterns. None of the differences among groups were significant (ANOVA test – p = 0.5413 and Dunnett's multiple comparisons test - not significant). f, Kaplan-Meier estimates of disease-free survival (DFS) and overall survival (OS) in TNBC subgroups using a median-split of pBRD4 intensity. Disease outcomes were evaluated in 83 of 89 TMA samples. Patients with low pBRD4 had a worse overall prognosis with a five-year RFS of 66.2% (95% CI 52.7-83.1%), compared to an RFS of 86.4% (95% CI 76.0-98.3%) among patients with high pBRD4 (HR=2.3, 95%CI 0.98-5.4, p=0.06). However, with this small sample size this difference did not reach statistical significance, nor did a ratiometric (2-fold) consideration of pBRD4 status and overall survival (HR=2.0, 95%CI 0.67-5.9, p=0.22).
Extended Data Figure 10
Overcoming BBI-resistance. a-c, Synergy studies of JQ1 with ABT737 (BCL-xl and BCL-2 inhibitor) (a), CX-4945 (CK2 inhibitor) (b) and Perphenazine (PP2A activator) (c). Points represent paired values of drug concentrations assessed for synergism. The diagonal line signifies drug additivity. Points above the line represent antagonistic drug combinations, and those below the line represent synergistic drug combinations.
Figure 1
Figure 1. Response to BBIs in breast cancer
a, Heatmap of mean IC50s of BBIs and inactive analogues in breast cell lines. Error bars represent SEM. b, Immunofluorescence of basal (basCK) and luminal (lumCK and CK18) cytokeratins in TNBC lines. Scale bars 20μm. c, Box plots depicting xenograft weights; n indicates the number of mice/experiment. d, Heatmap showing biotinylated JQ1 (Bio-JQ1), BRD4, and H3K27ac binding at transcription start site (TSS) and Bio-JQ1-bound enhancer regions. Each row represents a single genomic region (+/− 10kb) from TSS or enhancer center. Genomic occupancy is shaded by binding intensity in units of reads per million per base pair (rpm/bp). e, Gene tracks depicting Bio-JQ1 and BRD4 −/+ JQ1 in SUM159 cells at the HIF1A locus. x-axis: chromosome position with gene structures below, y-axis: genomic occupancy in units of rpm/bp, red bar: HIF1A super-enhancer. f, Plot of enhancers defined in untreated SUM159 cells ranked by increasing Bio-JQ1 signal (units rpm). Gray line marks cutoff discriminating typical from super-enhancers. g, Boxplots showing the log2 fold change in expression relative to control of either all active or super-enhancer (SE) associated genes upon JQ1 treatment.
Figure 2
Figure 2. Acquired BBI-resistance in TNBC
All error bars represent SD, n=3. a, Viable cell numbers after JQ1 treatment. b, Cellular viability after treatment with BBIs. c, Genomic regions containing a super-enhancer in SUM159 or SUM159R cells ranked by log2 change in Bio-JQ1 genomic binding signal. X-axis: log2 fold change in Bio-JQ1 signal colored by intensity of change. d, e, Boxplot showing the log2 fold change in BRD4 genomic occupancy (d) and gene expression (e) at regions with gained, conserved, or lost Bio-JQ1 binding in SUM159R vs.. SUM159 cells. f,g, Gene tracks depicting Bio-JQ1, BRD4, and H3K27ac at the BCL-xL (f) and SOD2 (g) locus. The x-axis shows position along the chromosome with gene structures drawn below. The y-axis shows genomic occupancy in units of rpm/bp. h, Boxplot showing the log2 fold change in BRD4 genomic occupancy at regions bound by Bio-JQ1.
Figure 3
Figure 3. Mechanism of BBI-resistance in TNBCs
All error bars represent SD, n=3. a, Plot depicting changes in BRD4-associated proteins in SUM159 and SUM159R cells following JQ1 treatment based on SILAC RIME. The axes represent log10 of fold change (FC). b, Immunoblot analysis of BRD4 immunoprecipitates and total cell lysates in SUM159 and SUM159R cells. For gel source data, see Supplementary Figure 1. c, Cellular viability of SUM159 and SUM159R cells expressing exogenous WT, BDmut, 7A and 7D mutant BRD4 with concomitant knock-down of endogenous BRD4. d, e, Sensitivity of SUM159 (d) and SUM159R (e) cells expressing exogenous WT or BDmut BRD4 to JQ1 with concomitant knock-down of endogenous BRD4.
Figure 4
Figure 4. Regulation and relevance of BRD4 phosphorylation
All error bars represent SD, n=3. a, Immunoblot for the indicated proteins following JQ1 treatment. b, Immunoblot for the indicated proteins after knock-down of PP2A A or C or both subunits. c, Viable cell numbers of JQ1-treated control and shPP2A-C expressing SUM149 cells. d, Immunoblot of pBRD4 and BRD4 in SUM159R cells following phenothiazine (PTZ) treatment. e, Viable cell numbers of SUM159R cells treated with JQ1, phenothiazine or both compounds. f,g Immunoblot of BRD4 immunoprecipitates and total cell lysates of SUM159R cells after 3hrs treatment with JQ1 and CK2i (f) and JQ1 and PTZ (g). h, Immunoblot of FLAG-BRD4 (WT or mutant) immunoprecipitates and total cell lysates after 3hrs treatment with JQ1. i, JQ1 sensitivity of SUM159 and SUM159R cells expressing exogenous WT or mutant (7A, 7D) BRD4. For gel source data, see Supplementary Figure 1.

Comment in

  • Cancer: Bet on drug resistance.
    Settleman J. Settleman J. Nature. 2016 Jan 21;529(7586):289-90. doi: 10.1038/nature16863. Epub 2016 Jan 6. Nature. 2016. PMID: 26735017 No abstract available.

References

    1. Vaz-Luis I, et al. Outcomes by tumor subtype and treatment pattern in women with small, node-negative breast cancer: a multi-institutional study. J Clin Oncol. 2014;32:2142–2150. - PMC - PubMed
    1. Lehmann BD, et al. Identification of human triple-negative breast cancer subtypes and preclinical models for selection of targeted therapies. J Clin Invest. 2011;121 - PMC - PubMed
    1. Metzger-Filho O, et al. Dissecting the heterogeneity of triple-negative breast cancer. J Clin Oncol. 2012;30:1879–1887. - PubMed
    1. Puissant A, et al. Targeting MYCN in neuroblastoma by BET bromodomain inhibition. Cancer Discov. 2013;3:308–323. - PMC - PubMed
    1. Delmore JE, et al. BET bromodomain inhibition as a therapeutic strategy to target c-Myc. Cell. 2011;146:904–917. - PMC - PubMed

Publication types

MeSH terms

Associated data