. 2016 Jan 14;529(7585):216-20.
doi: 10.1038/nature16498. Epub 2016 Jan 6.

FOXO1 couples metabolic activity and growth state in the vascular endothelium

Affiliations

FOXO1 couples metabolic activity and growth state in the vascular endothelium

Kerstin Wilhelm et al. Nature. .

Abstract

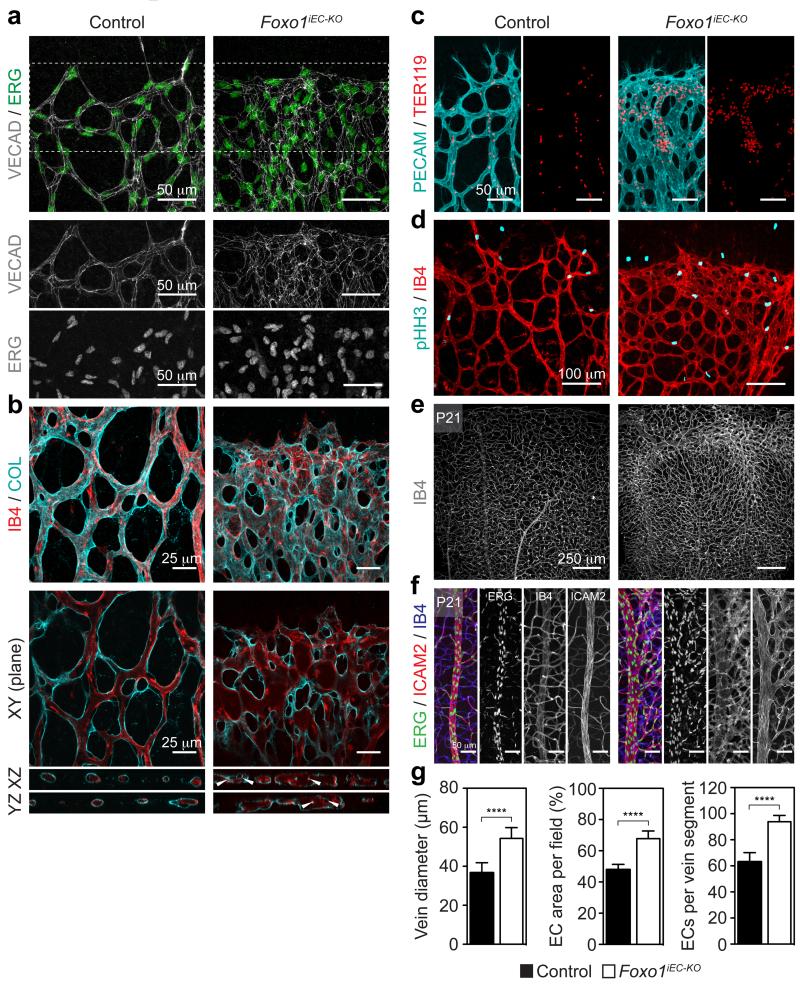
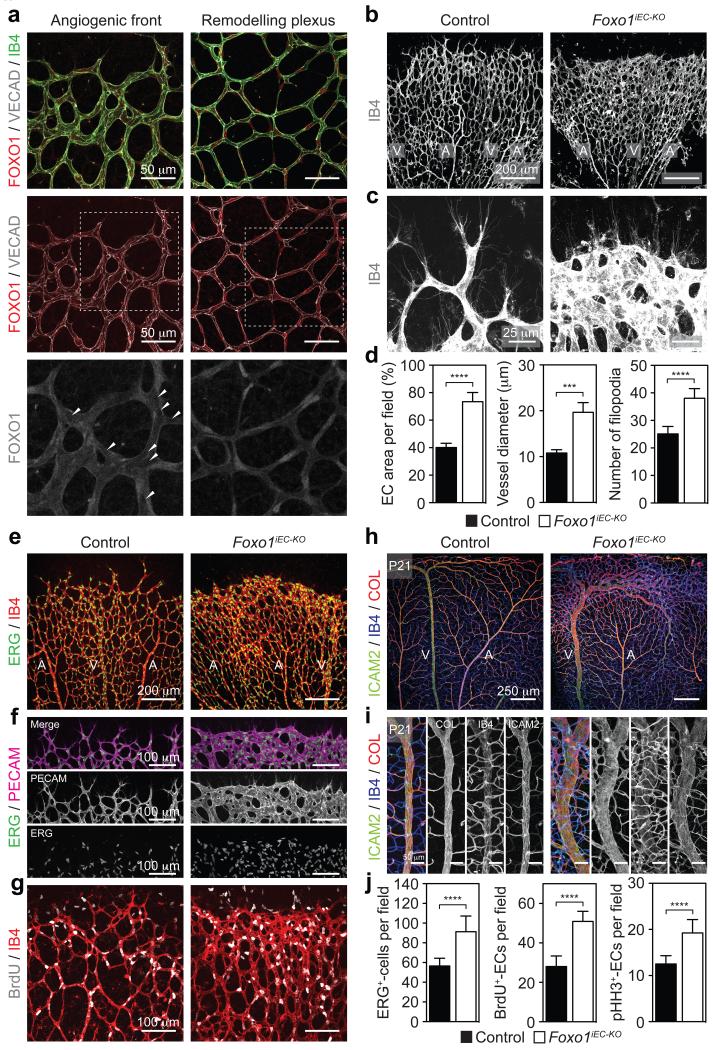
Endothelial cells (ECs) are plastic cells that can switch between growth states with different bioenergetic and biosynthetic requirements. Although quiescent in most healthy tissues, ECs divide and migrate rapidly upon proangiogenic stimulation. Adjusting endothelial metabolism to the growth state is central to normal vessel growth and function, yet it is poorly understood at the molecular level. Here we report that the forkhead box O (FOXO) transcription factor FOXO1 is an essential regulator of vascular growth that couples metabolic and proliferative activities in ECs. Endothelial-restricted deletion of FOXO1 in mice induces a profound increase in EC proliferation that interferes with coordinated sprouting, thereby causing hyperplasia and vessel enlargement. Conversely, forced expression of FOXO1 restricts vascular expansion and leads to vessel thinning and hypobranching. We find that FOXO1 acts as a gatekeeper of endothelial quiescence, which decelerates metabolic activity by reducing glycolysis and mitochondrial respiration. Mechanistically, FOXO1 suppresses signalling by MYC (also known as c-MYC), a powerful driver of anabolic metabolism and growth. MYC ablation impairs glycolysis, mitochondrial function and proliferation of ECs while its EC-specific overexpression fuels these processes. Moreover, restoration of MYC signalling in FOXO1-overexpressing endothelium normalizes metabolic activity and branching behaviour. Our findings identify FOXO1 as a critical rheostat of vascular expansion and define the FOXO1-MYC transcriptional network as a novel metabolic checkpoint during endothelial growth and proliferation.


Figures

<b>Extended Data Figure 1</b>.
Extended Data Figure 1.. Constitutive and inducible deletion of Foxo1 in ECs of mice
a, Strategy to generate a conditional Foxo1 mutant allele in which exons 2 and 3 are flanked by lox sites. The structures of the genomic locus, the targeting vector, and the targeted allele are shown. FRT-Neo-FRT, neomycin resistance cassette flanked by FRT sites. TK1, thymidine kinase. b, Table of viable off-spring from Tie2-cre;Foxo1flox/+ (male) and Foxo1flox/flox (female) intercrosses. c, Control (Foxo1flox/flox) and Foxo1EC-KO mutants (Tie2-cre;Foxo1floxflox) at E10.5. d, PCR of genomic DNA from P5 control (Foxo1flox/flox – lane 1 and 3) and Foxo1iEC-KO (Pdgfb-CreERT;Foxo1flox/flox – lane 2 and 4) pups untreated (lane 1 and 2) or treated (lane 3 and 4) with 4-OHT. Recombination of the floxed Foxo1 allele (Δ) occurs only in 4OHT-injected animals that are Pdgfb-CreERT2-positive. e, Immunofluorescence staining for FOXO1 , VE-cadherin (VECAD) and isolectin-B4 (IB4) in a P5 mouse retina of 4OHT-injected control and Foxo1iEC-KO mice. f, Confocal images of mTmG+ control- and Foxo1iEC-KO mice that were injected with 4-OHT from P1 – P4 and analysed for GFP, ERG and IB4 expression.
<b>Extended Data Figure 2</b>.
Extended Data Figure 2.. Endothelial FOXO1 deficiency leads to abnormal vessel size and shape
a, Immunostaining for VECAD and ERG in Foxo1iEC-KO and control retinas. The lower panels show the isolated VECAD and ERG signals of the inset. b, Confocal images showing maximum intensity projections and XY, XZ, and YZ planes of a thick stack of IB4 and collagen IV (COL) stained P5 retinas. Foxo1iEC-KO mice develop enlarged vessels with abnormal lumen organisation. White arrowheads point to areas with multiple vessel layers and intraluminal collagen strands. c, Images of IB4 (cyan) and TER119 (red) stained P5 retinas of control and Foxo1iEC-KO mice. Note that aggregates of TER119+ red blood cells form in Foxo1iEC-KO but not in control mice. d, Phospho-histone H3 (pHH3) and IB4 immunostaining of P5 Foxo1iEC-KO and control mice. e, Images of IB4 stained retinas at P21 showing an increased vessel density in Foxo1iEC-KO mice (same samples as in Figure 1h). f, Higher magnification images of ERG , ICAM2 and IB4 stained retinas at P21 showing increased numbers of ECs in the perivenous plexus of Foxo1iEC-KO mice. g, Bar graphs showing the mean endothelial area (n ≥ 8), mean diameter of central vein (n ≥ 8), and number of ERG/IB4+ cells (n ≥ 4) in P21 retinas of Foxo1iEC-KO and control mice. Data represent mean ± s.d. Two-tailed unpaired t-test. ****P < 0.0001.
<b>Extended Data Figure 3</b>.
Extended Data Figure 3.. Inducible overexpression of a constitutively active FOXO1 mutant in ECs of mice
a, A cassette containing the CAG promoter, a floxed STOP sequence, a cDNA encoding for Foxo1CA, and IRES-GFP was inserted into the Rosa26 locus. A schematic representation of the wild-type Rosa26 locus, the floxed allele, and the recombined allele following Cre expression is shown. b, Immunofluorescence staining for FOXO1 , GFP and PECAM in P5 Foxo1iEC-CA and control mice. c, Confocal images of mTmG+ control- and Foxo1iEC-CA mice that were injected with 4-OHT from P1 – P4 and analysed for GFP, ERG and IB4 expression. The right half of both images shows the GFP signal alone. d, High-magnification images of iB4-stained retinal vessels at the angiogenic front in control and Foxo1iEC-CA pups. e, BrdU and IB4 labelling of whole-mount P5 retinas reveals reduced endothelial proliferation in Foxo1iEC-CA animals. f, Confocal images showing MYC and PECAM immunostaining in P5 retinas of control and Foxo1iEC-CA mice. The lower half of both images shows the MYC signal alone. g, Quantification of FOXO1 nuclear staining intensity in ECs (n = 3), radial migration (n = 10), endothelial coverage (n = 10), branch points (n = 10), and endothelial BrdU incorporation (n ≥ 6) in P5 retinas of control and Foxo1iEC-CA mutant mice. Data represent mean ± s.d. Two-tailed unpaired t-test. **P < 0.01; ***P < 0.001; ****P < 0.0001.
<b>Extended Data Figure 4</b>.
Extended Data Figure 4.. FOXO1 restricts EC propagation and vascular growth in a cell-autonomous manner
a, Timeline for the analysis of angiogenesis in the embryonic hindbrain. Plug-positive female mice were injected with 4OHT from embryonic day (E) 8.5 to 10.5 and embryos harvested on E11.5 for hindbrain dissection. b, Confocal images of E11.5 control and Foxo1iEC-CA hindbrains stained with IB4 and GFP. c, High-magnification images of IB4-stained blood vessels in the ventricular zone of control and Foxo1iEC-CA mice. d, Timeline for the analysis of control and Foxo1iEC-CA low-degree chimeras that heterozygously co-express the mTmG Cre reporter. Control and Foxo1iEC-KO mice were injected with a single low-dose of 4OHT at P3 and retinas analysed at P5. e,f, Confocal images (e) and quantification (f) of control;mTmG and Foxo1iECCA;mTmG retinas after low-dose 4-OHT treatment at P3 (n = 9). Samples were labelled for GFP, ERG and IB4. Data represent mean ± s.d., two-tailed unpaired t-test. ****P < 0.0001.
<b>Extended Data Figure 5</b>.
Extended Data Figure 5.. Forced expression of FOXO1 does not induce apoptosis, senescence, autophagy or energy distress in cultured ECs
a, Immunoblot analysis and quantification of FOXO1 protein levels in AdCTL and AdFOXO1CA-Flag transduced HUVEC (n = 20). b, ATP levels in ECs 24 hours post transduction with AdCTL or AdFOXO1CA (n = 7). c, Western blot images and quantification of AdCTL- or AdFOXO1CA-Flag-transduced HUVEC showing that FOXO1CA does not alter the phosphorylation of AMPKα (Thr172) or of its substrate ACC (Ser79). Oligomycin (Oligo), positive control. TUB, Tubulin. (n = 10). d, Western blotting of AdCTL- or AdFOXO1CA-Flag-transduced HUVEC illustrating that overexpression of FOXO1CA does not induce apoptotic cell death. Cleaved Caspase3 (CASP3) and PARP served as markers of apoptosis. Cycloheximide (CHX) and TNFα (TNF) costimulation, positive control. e, Analysis of senescence-associated genes by microarray demonstrating that senescence markers were not significantly changed or even down-regulated in FOXO1CA-overexpressing ECs. (n = 3). f, Images of ß-galactosidase stainings in AdCTL and AdFOXO1CA-transduced HUVEC showing no increase in senescence-associated ß-galactosidase activity (SABG). g, Densitometric quantification of the LC3-II to LC3-I ratio in AdCTL- or AdFOXO1CA -transduced HUVEC (n = 10). h, Immunofluorescence analysis of AdCTL- and AdFOXO1CA-transduced HUVECs (both coexpressing GFP) using LC3 and GFP antibodies. Chloroquine (CQ), positive control. DAPI, endothelial nuclei. Data in a-c, e and g represent mean ± s.d. Two-tailed unpaired t-test. *P < 0.05; ****P < 0.0001; ns, not significant.
<b>Extended Data Figure 6</b>.
Extended Data Figure 6.. FOXO1 represses MYC signalling in ECs
a, Microarray expression analysis of FOXO1 and of canonical FOXO target genes in AdFOXO1CA- and AdCTL-expressing HUVECs 16 hours post transduction (n = 3). b, GSEA of the FOXO1 DNA binding element (TTGTTTAC) gene set in AdFOXO1CA- or AdCTL-transduced ECs. ES, enrichment score, NES, normalized enrichment score. c, GSEA of MYC gene signatures- showing the downregulation of MYC target genes in FOXO1CA-expressing HUVECs. d, qPCR expression analysis of MYC at 3, 6 and 16 hours in AdCTL and AdFOXO1CA-transduced HUVECs (n ≥ 4). e, qPCR analysis (n = 4) of Myc mRNA levels in ECs isolated from Foxo1CA mice 24 hours post transduction with a control- or Cre (AdCre) adenovirus. f, Immunoblot analysis of Myc in ECs isolated from Foxo1CA mice following transduction with AdCTL or AdCre (n = 3). Cre-mediated recombination gave rise to a 2.8 ± 0.3–fold increase in Foxo1 protein expression. g, Expression analysis of MYC in HUVECs by Western blotting following RNAi-mediated knockdown of FOXO1 (siFOXO1). siSCR, scrambled control (n = 3). h, Myc protein expression in ECs isolated from Foxo1flox mice 24 hours post transduction with a AdCTL or AdCre-encoding adenovirus (n = 3). Data in a and d-h represent mean ± s.d., two-tailed unpaired t-test. . *P < 0.05; **P < 0.01; ***P < 0.001; ****P < 0.0001.
<b>Extended Data Figure 7</b>.
Extended Data Figure 7.. FOXO1 interferes with MYC signalling at different levels
a, Western blot analysis of MYC, MXI1 and FBXW7 in AdCTL- or AdFOXO1CA-Flag-transduced HUVEC. b, Immunoblot analysis and quantification of MYC protein levels in AdCTL and AdFOXO1CA-Flag transduced HUVECs that were co-treated with the proteasomal inhibitor MG132 (n = 3). c, Analysis of MYC protein half-life in AdCTL- or AdFOXO1CA-Flag-transduced HUVECs. The day after transduction, HUVECs were treated with cylcoheximide (CHX) and incubated for the times indicated (h, hours). Data represent mean ± s.d. Two-way ANOVA with Bonferroni’s multiple comparison post-hoc test. d,e, qPCR (d) and immunoblot analysis (e) of MYC levels in control (siSCR) or MXI1 (siMXI1) siRNA-transfected HUVECs that were also transduced with AdCTL or AdFOXO1CA-Flag (n ≥ 5). f, qPCR analysis of MYC target genes in siSCR or siMXI1-transfected HUVECs that were cotransduced with AdCTL or AdFOXO1CA (n ≥ 3).. Data represent mean ± s.d. One-way ANOVA with Bonferroni’s multiple comparison post-hoc test was performed in b, d, e and f. **P < 0.01; ***P < 0.001; ****P < 0.0001.
<b>Extended Data Figure 8</b>.
Extended Data Figure 8.. MYC regulates genes involved in endothelial metabolism and growth in ECs
a,b, Analysis of MYC expression by qPCR (a) and immunoblot (b) in scrambled (siSCR) and MYC (siMYC) siRNA-treated HUVECs 24 h post transfection (n = 7). c, GSEA of the MYC-(CACGTG) DNA binding element gene set in siSCR or siMYC-transfected HUVECs. d, GSEA of MYC gene signatures- showing the downregulation of MYC target genes in MYC-depleted HUVECs. e, Heatmap of downregulated MYC signature genes in MYC-silenced HUVECs (n = 3). Genes highlighted in red indicate genes that are also suppressed by FOXO1CA overexpression. f, Table of KEGG gene sets enriched among genes downregulated in the MYC siRNA-transfected ECs. g, Expression analysis of FOXO1-regulated MYC target genes by qPCR in MYC-silenced HUVECs (n ≥ 4). Data in a and g represent mean ± s.d., two-tailed unpaired t-test. *P < 0.05; **P < 0.01; ***P < 0.001; ****P < 0.0001.
<b>Extended Data Figure 9</b>.
Extended Data Figure 9.. MYC is a critical driver of endothelial proliferation, growth and metabolism
a,b, IB4 and pHH3 (a) or BrdU (b) labelling of P5 retinas reveals reduced endothelial proliferation in MyciEC-KO mice. c, ICAM2, IB4 and COL staining of retinas at P5 showing an increased number of empty (COL+, IB4-negative) sleeves (white arrows) in the plexus of MyciEC-KO mutants. d, Quantitative analysis of the indicated vascular parameters in P5 retinas of control and MyciEC-KO mice (n ≥ 8). e, ECAR (n = 4) and OCR (n = 4) in AdMYC-transduced HUVECs showing a heightened metabolic activity in MYC-overexpressing ECs (6.8 ± 1.4-fold MYC overexpression). f, Pdgfb-creERT2-mediated overexpression of Myc (2.4 ± 0.8-fold Myc overexpression) enhances vascular growth as indicated by the parameters assessed at P5 (n ≥ 6). g, ERG and IB4 labelling of P5 retinas showing an increase in cellularity in vessels of MyciEC-OE mice. h, Enhanced EC proliferation in MyciEC-OE mice as revealed by BrdU and IB4 costaining. i,j, Overview (i) and higher magnification images (j) of ICAM2, IB4 and COL stained retinas at P21 showing aberrant vascular growth and venous enlargement in MyciEC-OE mice. k, Increased endothelial cellularity in veins of MyciEC-OE mice at P21. Data in d-f represent mean ± s.d., two-tailed unpaired t-test. *P < 0.05; **P < 0.01; ***P < 0.001; ****P < 0.0001.
<b>Extended Data Figure 10</b>.
Extended Data Figure 10.. Restoration of MYC signalling in FOXO1CA-overexpressing endothelium restores vascular growth
a,b, Confocal images (a) and quantification (b) of ERG and IB4 stained P5 retinas in control, Foxo1iEC-CA, MyciEC-OE and Foxo1iEC-CA/MyciEC-OE mice (same samples as in Figure 4h) showing that EC numbers are normalized in the Foxo1iEC-CA/MyciEC-OE double mutants (n ≥ 3). c, Relative ROS levels in AdCTL, AdFOXO1CA, AdFOXO1CA/AdMYC and AdMYC-transduced HUVECs showing that ROS levels increase again in FOXO1CA/MYC co-expressing ECs (n ≥ 6). Data in b and c represent mean ± s.d., one-way ANOVA with Bonferroni’s multiple comparison post-hoc test. *P < 0.05; **P < 0.01; ***P < 0.001; ****P < 0.0001.
Figure 1
Figure 1. Endothelial FOXO1 is an essential regulator of vascular growth
a, Staining for FOXO1, VE-cadherin (VECAD) and isolectin-B4 (IB4) in a P5 mouse retina. The lower panels depict the FOXO1 signal of the boxed area. Arrowheads point to ECs with weak FOXO1 nuclear staining. b,c, Overview (b) and higher magnification (c) images of IB4-stained retinal vessels at P5 in Foxo1iEC-KO and controls. A, artery; V, vein. d, Bar graphs showing endothelial area (n ≥ 7), branch diameter (n ≥ 7), and number of filopodia (n ≥ 5).e, Images of IB4 and ERG stained P5 retinas of control and Foxo1iEC-KO mutants. f, PECAM and ERG stained retinas showing endothelial clustering at the angiogenic front in Foxo1iEC-KO mutants. g, Increased endothelial BrdU incorporation in Foxo1iEC-KO retinas. h,i, Confocal images of ICAM2 , IB4 and collagen IV (COL) stained retinas at P21. j, Quantifications of ERG/IB4- (n ≥ 9), BrdU/IB4- (n ≥ 5) and pHH3/IB4- (n ≥ 7) positive cells. Data in d and j represent mean ± s.d., two-tailed unpaired t-test. ***P < 0.001; ****P < 0.0001.
Figure 2
Figure 2. Forced activation of FOXO1 restricts endothelial growth and vascular expansion
a, Overview images of control and Foxo1EC-CA mice at E10.5. b, Staining for FOXO1, GFP and PECAM in P5 Foxo1iEC-CA and control mice. c-e, IB4- (c), ERG- and IB4- (d), and pHH3- and IB4- (e) labelling of P5 retinas in Foxo1iEC-CA and control mice. f, Quantification of vascular parameters in the control and mutant retinas as indicated (n ≥ 5). g, Preserved luminal ICAM2 staining in Foxo1iEC-CA mice. h, The number of empty (COL+, IB4-negative) sleeves (white arrows) in the retinal plexus is increased in the Foxo1iEC-CA mutants. i, No difference in cleaved Caspase 3- (CASP3; green) positive ECs between control and Foxo1iEC-CA mice. j, Reduced vascularization of E11.5 hindbrains in Foxo1iEC-CA mice. k, Quantification of vascular parameters in control and Foxo1iEC-CA hindbrains (n ≥ 5). Data in (f) and (k) represent mean ± s.d., two-tailed unpaired t-test. **P < 0.01; ***P < 0.001; ****P < 0.0001.
Figure 3
Figure 3. FOXO1 slows endothelial metabolic activity and suppresses MYC signalling
a, Extracellular acidification rate (ECAR) in ECs treated with or without oligomycin (Oligo) showing reduced basal and maximal glycolytic activity in AdFOXO1CA- and AdCTL- (control) transduced HUVECs (n = 6). b-e, Reduced 2-deoxy-D-glucose (2-DG) uptake (b; n = 13), relative lactate production (c; n = 10), and glycolytic flux analysis (d; n = 4) in FOXO1CA-expressing ECs e, Oxygen consumption rates (OCR) in control and FOXO1CA-overexpressing ECs (n = 5) under basal conditions and in response to oligomycin (Oligo), fluoro-carbonyl cyanide phenylhydrazone (FCCP) or antimycin A (AA) and rotenone (R).. Data represent mean ± s.d. Two-way ANOVA with Bonferroni’s multiple comparison test. f, Relative ROS levels in AdCTL- or AdFOXO1CA-transduced ECs (n = 7). g, LC3 Western blot analysis showing that overexpression of the Flag-tagged FOXO1CA does not induce autophagy in ECs. CQ, Chloroquine, TUB, Tubulin. Densitometric quantifications are shown below the lanes (n = 10). h, GSEA of the FOXO1- (AAACAA) or MYC- (CACGTG) DNA binding element gene sets in AdFOXO1CA- or AdCTL-transduced ECs. ES, enrichment score, NES, normalized enrichment score. i, Heatmap of downregulated MYC signature genes in FOXO1CA-overexpressing ECs (n=3). j,k, Analysis of MYC expression by microarray (j) and immunoblot (k) in FOXO1CA-Flag-overexpressing endothelium. (j, n = 6; k, n= 10). l, Quantitative polymerase chain reaction (qPCR) expression analysis of FOXO1CA-regulated genes involved in MYC signalling(n ≥ 3). Data in a-d, f, g, j- l represent mean ± s.d., two-tailed unpaired t-test. *P < 0.05; **P < 0.01; ****P < 0.0001; #P < 00.1; ns, not significant
Figure 4
Figure 4. MYC is a critical component of FOXO1 signalling in ECs
a,b, ECAR (a) and OCR (b) in MYC siRNA- (siMYC) or scrambled siRNA- (siSCR) transfected ECs (ECAR: n = 5; OCR: n = 5). Data represent mean ± s.d., two-tailed unpaired t-test. c, Staining for MYC , VECAD and PECAM in retinas of MyciEC-KO and control mice. d,e, Images of IB4- (d) and IB4- and ERG- (e) stained P5 retinas of control and MyciEC-KO mice. f,g, Images of IB4- (f) and pHH3- and IB4- (g) stained P5 retinal vessels in MyciEC-OE and control mice. h,i, Representative images (h) and quantification (i) of IB4-stained P5 retinas in control, Foxo1iEC-CA, MyciEC-OE and Foxo1iEC-CA/MyciEC-OE double mutants (n ≥ 6). j,k, ECAR (j) and OCR (k) in AdCTL, AdFOXO1CA, AdFOXO1CA/AdMYC and AdMYC-transduced HUVECs showing restoration of metabolic activity in FOXO1CA/MYC co-expressing ECs (ECAR: n = 8; OCR: n ≥ 3). Data in i-k represent mean ± s.d., one-way ANOVA with Bonferroni’s multiple comparison post-hoc test. **P < 0.01; ***P < 0.001; ****P < 0.0001.

Comment in

References

    1. Ghesquiere B, Wong BW, Kuchnio A, Carmeliet P. Metabolism of stromal and immune cells in health and disease. Nature. 2014;511:167–176. - PubMed
    1. Adams RH, Alitalo K. Molecular regulation of angiogenesis and lymphangiogenesis. Nat Rev Mol Cell Biol. 2007;8:464–478. - PubMed
    1. Potente M, Gerhardt H, Carmeliet P. Basic and therapeutic aspects of angiogenesis. Cell. 2011;146:873–887. - PubMed
    1. De Bock K, Georgiadou M, Carmeliet P. Role of endothelial cell metabolism in vessel sprouting. Cell Metabolism. 2013;18:634–647. - PubMed
    1. Dang CV. MYC, metabolism, cell growth, and tumorigenesis. Cold Spring Harb Perspect Med. 2013;3 - PMC - PubMed

Publication types

MeSH terms

Substances