. 2016 Jan 6;12(1):e1005362.
doi: 10.1371/journal.ppat.1005362. eCollection 2016 Jan.

Structural Based Analyses of the JC Virus T-Antigen F258L Mutant Provides Evidence for DNA Dependent Conformational Changes in the C-Termini of Polyomavirus Origin Binding Domains

Affiliations

Structural Based Analyses of the JC Virus T-Antigen F258L Mutant Provides Evidence for DNA Dependent Conformational Changes in the C-Termini of Polyomavirus Origin Binding Domains

Gretchen Meinke et al. PLoS Pathog. .

Erratum in

Abstract

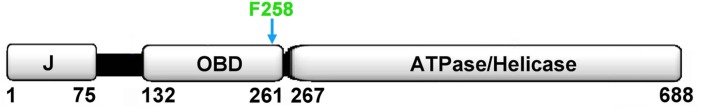
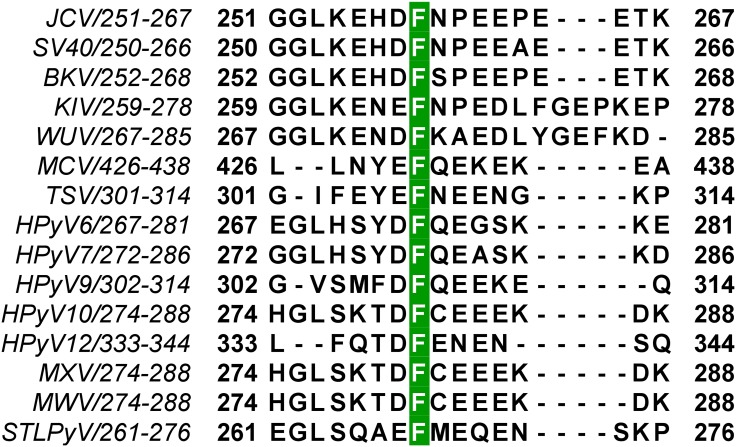
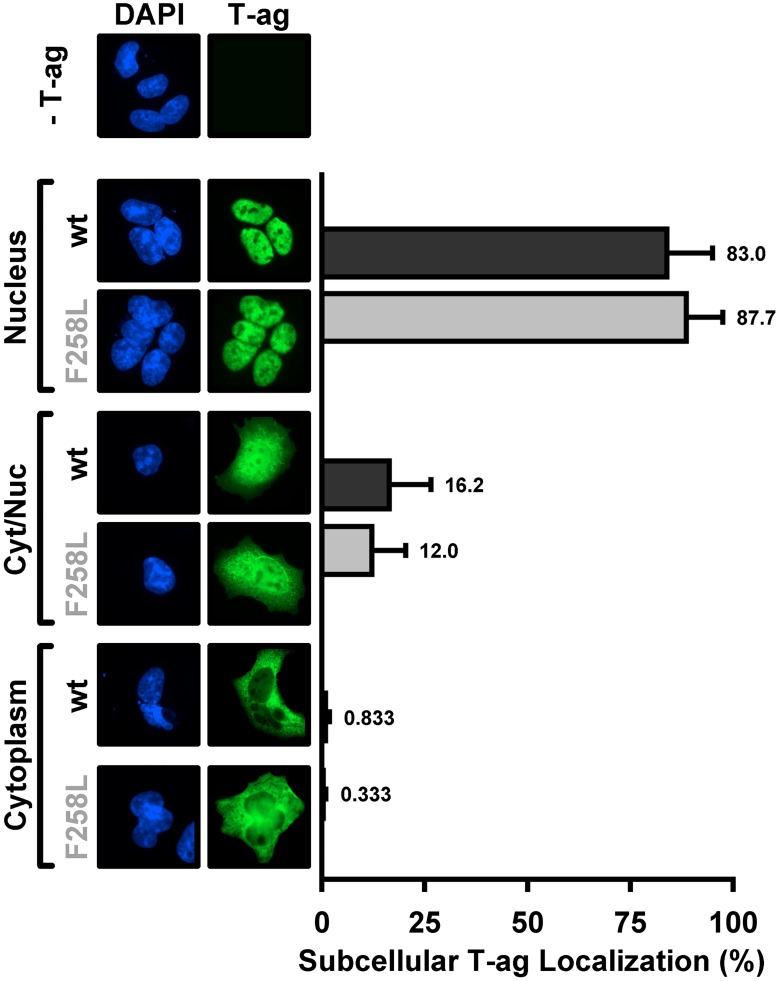
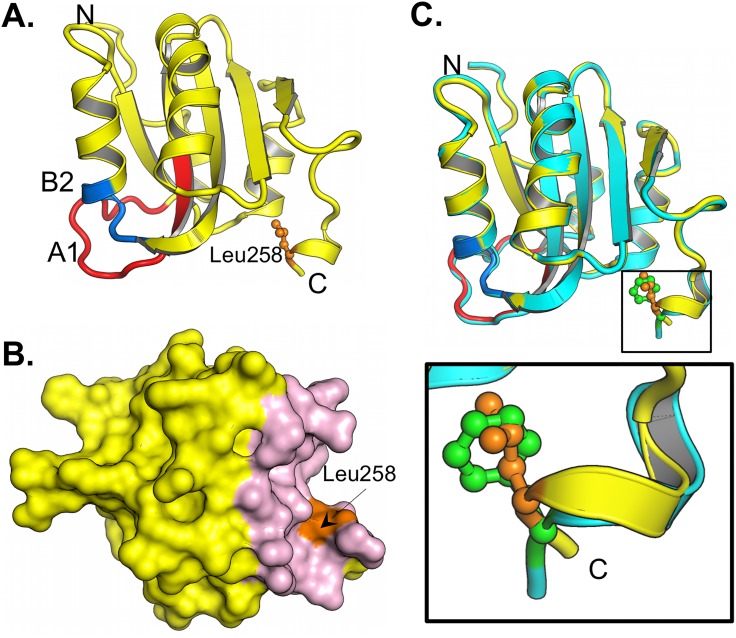
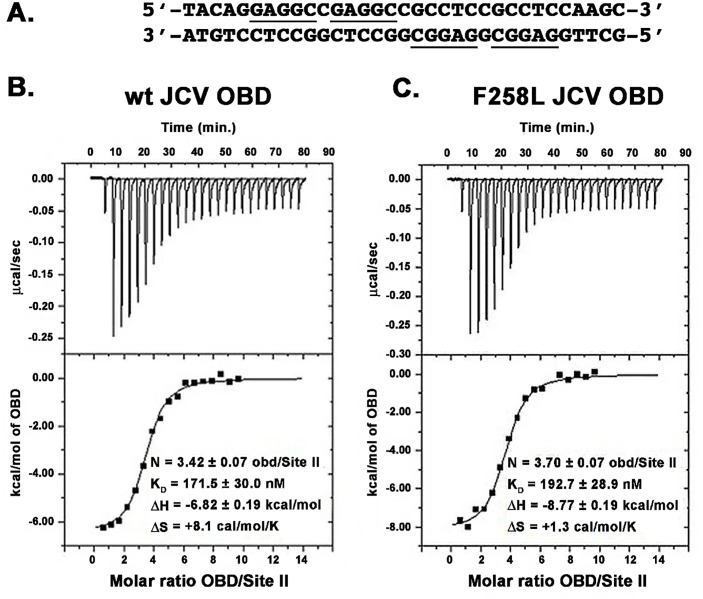
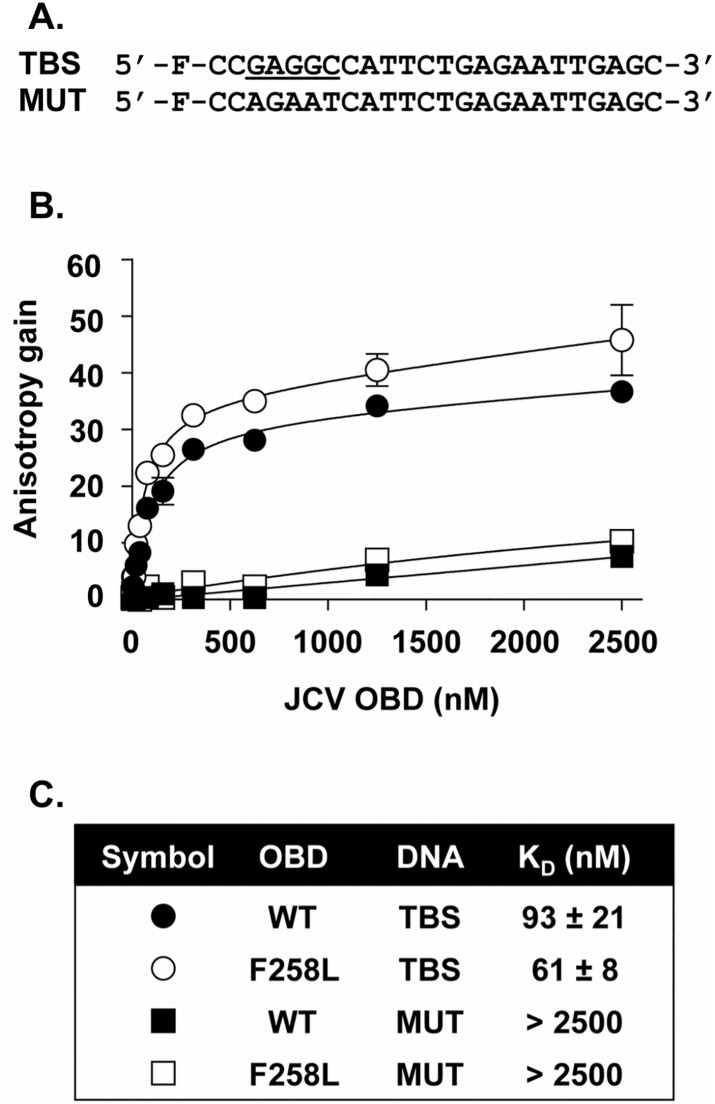
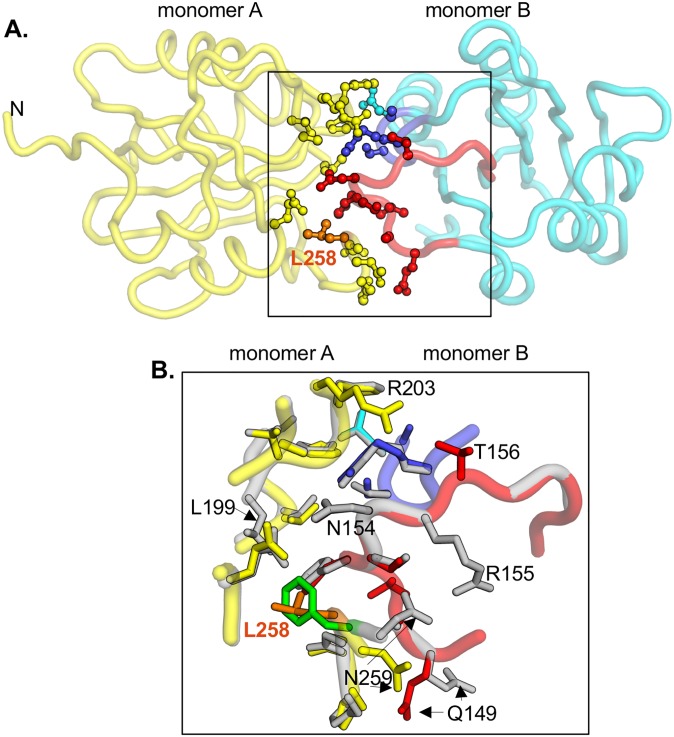
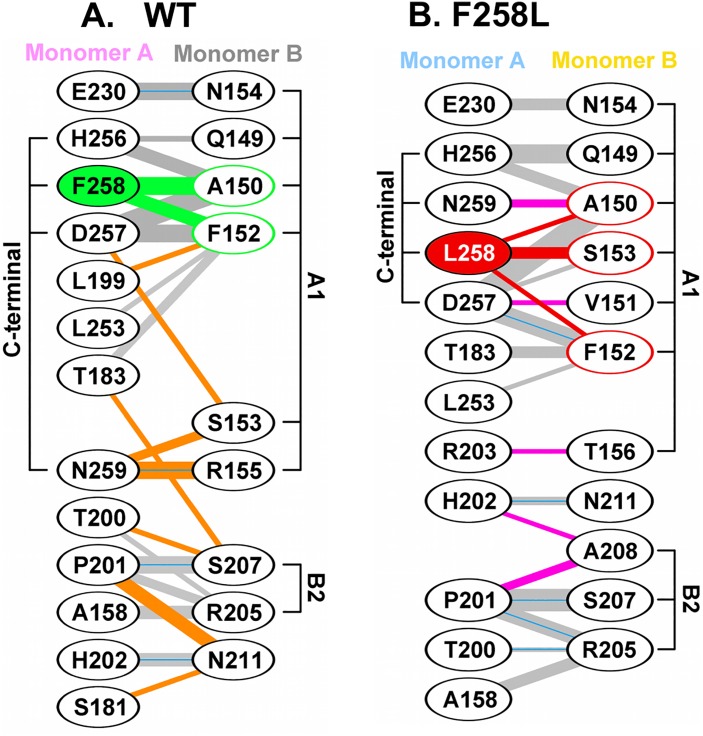
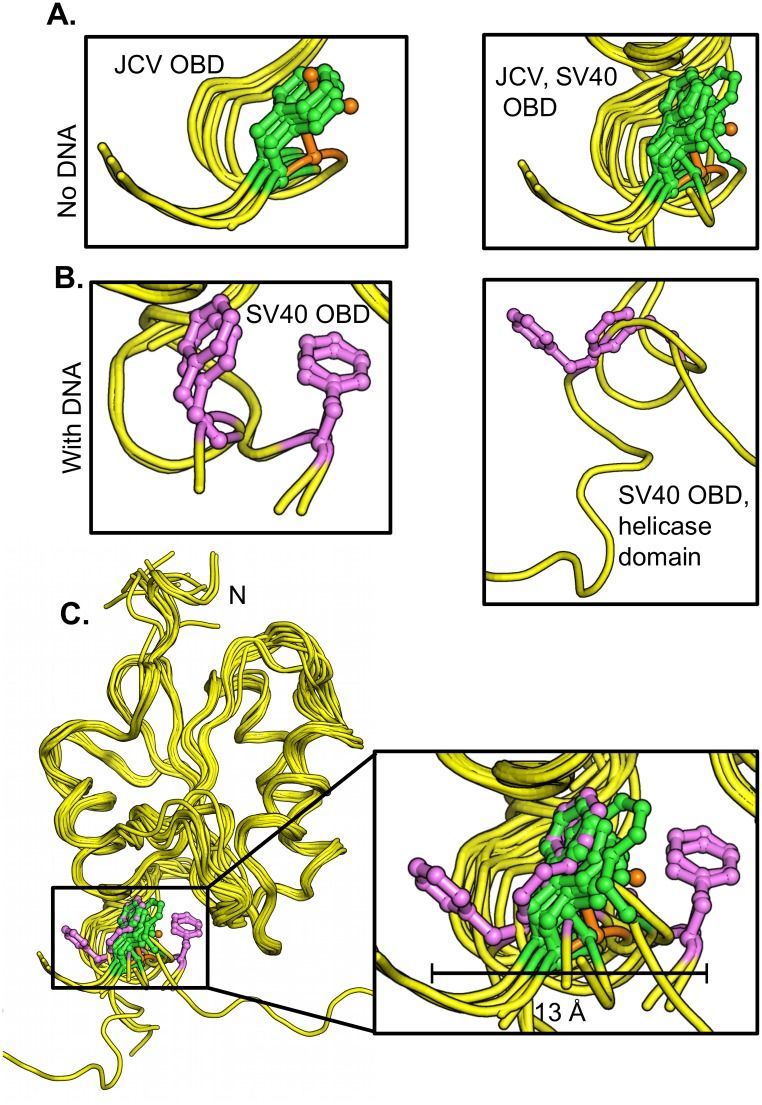
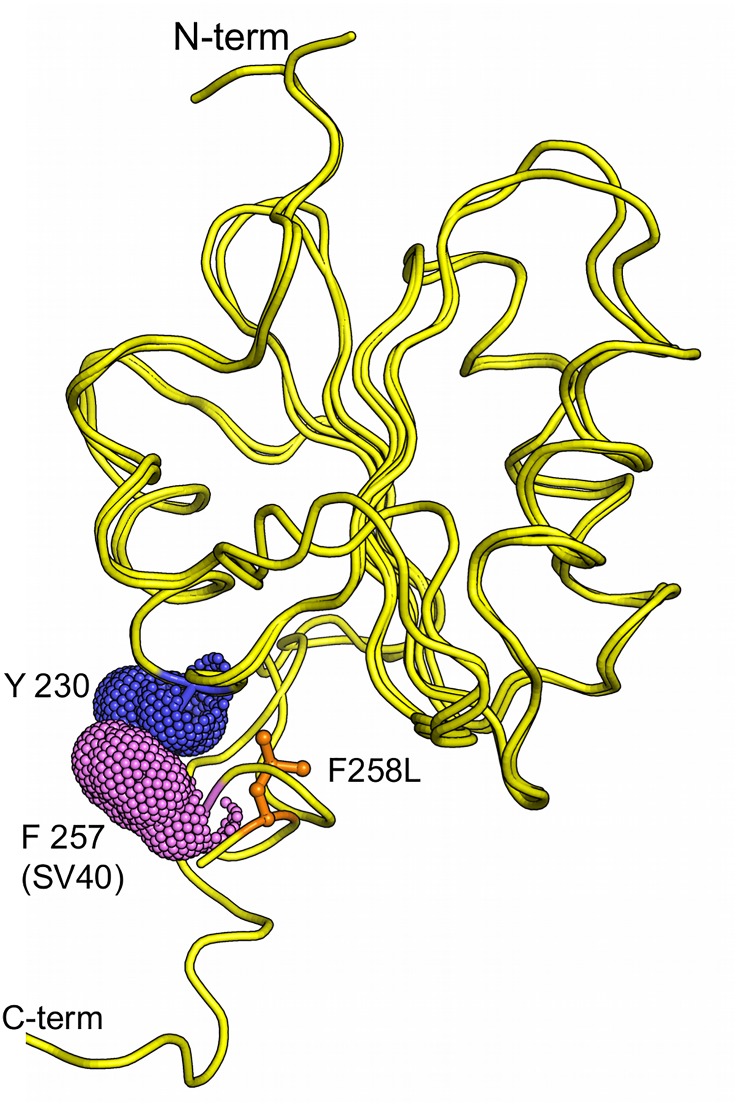
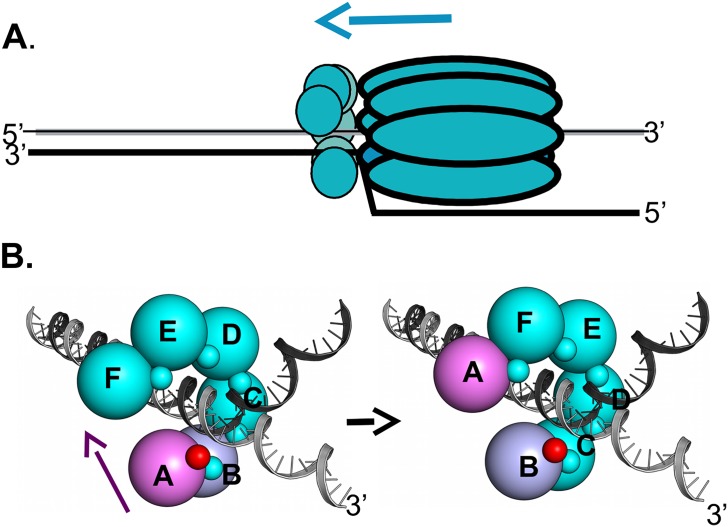
The replication of human polyomavirus JCV, which causes Progressive Multifocal Leukoencephalopathy, is initiated by the virally encoded T-antigen (T-ag). The structure of the JC virus T-ag origin-binding domain (OBD) was recently solved by X-ray crystallography. This structure revealed that the OBD contains a C-terminal pocket, and that residues from the multifunctional A1 and B2 motifs situated on a neighboring OBD molecule dock into the pocket. Related studies established that a mutation in a pocket residue (F258L) rendered JCV T-ag unable to support JCV DNA replication. To establish why this mutation inactivated JCV T-ag, we have solved the structure of the F258L JCV T-ag OBD mutant. Based on this structure, it is concluded that the structural consequences of the F258L mutation are limited to the pocket region. Further analyses, utilizing the available polyomavirus OBD structures, indicate that the F258 region is highly dynamic and that the relative positions of F258 are governed by DNA binding. The possible functional consequences of the DNA dependent rearrangements, including promotion of OBD cycling at the replication fork, are discussed.


Conflict of interest statement

The authors have declared that no competing interests exist.

Figures

Fig 1
Fig 1. Location of T-antigen residue F258.
A schematic of JCV T-ag, showing the relative locations of the major domains and the position of residue F258 at the C-terminus of the JCV T-ag OBD.
Fig 2
Fig 2. Conservation of polyomavirus T-antigen residue F258.
Sequence alignment of the C-terminal regions of the fourteen human polyomavirus T-ag OBDs, along with the SV40 OBD, demonstrating that JCV residue F258 is highly conserved. The accession codes for the amino acid sequences used in the alignment are listed below, with the corresponding polyomavirus name in parentheses: P03070 (SV40), P03071 (BKV), A3R4N4 (KIV), P03072 (JCV), A5HBG1 (WUV), B6DVW7 (MCV), A0A068EVP3 (TSV), D6QWG6 (HPyV6), D6QWI6 (HPyV7), YP_004243706.1 (HPyV9), AFN43007.1 (HPyV10), AGL07668.1 (MWV), AFS65330.1 (MXV), AGH58117.1 (HPyV12) and AGC03170.1 (STLPyV).
Fig 3
Fig 3. Subcellular localization of the JCV F258L T-ag mutant in C33A cells.
Immunofluorescent based comparison of the sub-cellular distribution of wt JCV T-ag, and the F258L mutant (both in green), within replication permissive C33A cells [46]. The cell nuclei were stained with DAPI. The histograms, based on the quantitation of ~ 100 such images, indicate the percentage of T-ag in nuclei, both nuclei and cytoplasm or just cytoplasm for the wt and mutant T-ags.
Fig 4
Fig 4. The structure of the F258L JCV T-ag OBD.
A. A ribbon diagram of the JCV T-ag OBD F258L monomer. The multifunctional A1 (residues 147–155) and B2 (residues 203–207) regions are labeled red and blue, respectively. Residue L258 is shown in orange. The N and C termini are indicated. B. A surface representation of the JCV T-ag OBD F258L monomer showing that presence of the C-terminal pocket (in pink) and the location of L258 (in orange). C. Superimposition of the F258L mutant (yellow) onto the wt JCV OBD (in cyan). The insert presents a close up of the superimposition of wt F258 (in green) onto L258 (in orange).
Fig 5
Fig 5. Measuring the affinity of the F258L and wt JCV OBDs to bind to the central region of the core origin via ITC.
A. The four pentanucleotide containing Site II based duplex oligonucleotide, derived from the JCV origin of DNA replication, used in these studies. The GAGGC sequences are underlined. B. An ITC titration for the wt JCV T-ag OBD with DNA. C. An ITC titration for the JCV T-ag OBD F258L mutant with DNA. For each study, the calorimetric trace is shown in the top panel; the X-axis is time in minutes, while the Y-axis is power in ucal/s. The binding isotherms are shown in the bottom panel; the X-axis is the molar ratio of the indicated OBD to DNA. The Y-axis is kcal/mol of OBD. Values for KD and stoichiometry (N) are indicated.
Fig 6
Fig 6. Measuring the ability of the wild type and F258L OBDs to Bind to DNA via Fluorescence anisotropy.
A. DNA probes used in these experiments. The nucleotide sequences of the probe containing a single T-ag Binding Site (TBS; (GAGGC underlined)), and of the control probe containing a mutated TBS (MUT) are indicated. “F” refers to the position of the fluorescein moiety. B. Binding isotherms were acquired with 15 nM of the TBS probe (circles) or control probe (squares), and increasing concentrations of the wild type (wt) OBD (filled symbols) or F258L mutant derivative (open symbols). Each data point is the average of two independent experiments, each performed in triplicate (n = 6). Some of the standard deviations are not visible on the graph as they are smaller than the symbols. C. KD values derived from the binding isotherms presented in B. Note, the JCV T-ag OBD, and the F258L mutant, bound to the single pentanucleotide containing probe more tightly than to the four pentanucleotide containing probe ((93 ± 21 nM and 61 ± 8 nM (Fig 6C) versus 172 nM and 193 nM (Fig 5B and 5C)). The reason for this difference is not understood; it may simply reflect the use of two different methods.
Fig 7
Fig 7. The interfaces formed by the wild type and the F258L mutant.
A. The crystallographic interface formed by the JCV T-ag OBD F258L mutant. Monomer A is shown in yellow, while monomer B is in cyan. In monomer A, residue L258, situated in the C-terminal pocket, is presented in orange. In monomer B, residues from the A1 loop are shown in red; those from the B2 loop are in blue. Side-chains of residues involved in the interface are presented as ball and stick. B. Close-up of the superposition of the interfaces formed by the F258L mutant (colored as described above) and the wild type OBD interface, shown in gray. Residues that are labeled participate in interface formation and differ between the wt and F258L mutant. L258 is shown in orange, F258 in green.
Fig 8
Fig 8. Diagrams depicting the interactions within the interfaces formed by the wild type and F258L OBDs.
A. Interactions between monomers A and B within the wild type JCV T-ag OBD, calculated using the program PDBSUM [57]. Residues within the A1 and B2 loops, as well as C-terminal regions, are indicated. Residue F258, and the interactions it makes with the second monomer, are shown in green. Hydrogen bonds are indicated by solid blue lines while non-bonded contacts are indicated by the gray lines (the width of the line is proportional to the relative strength of the interaction). Interaction that are unique to the wild-type are in orange. B. A diagram depicting the interactions between monomers A and B within the F258L mutant. Residue L258, and the interactions it makes with the second monomer, are shown in red. Interactions that are unique to the F258L mutant are in pink.
Fig 9
Fig 9. Structural based comparison of residue F258 in various polyomavirus T-ag OBDs.
A. (Left). Superposition of the apo structures of the JCV T-ag OBDs [42], including the structure of the JCV T-ag OBD F258L mutant (F258 in green, L258 in orange) indicating the position of residue 258. (Right). Superposition of all of the apo structures of the JCV and SV40 T-ag OBDs indicating the positions of JCV T-ag residue F258 and SV40 T-ag residue F257 (colored as above). B. (Left). Superposition of the DNA bound forms of the SV40 OBD [27, 28, 35], showing the location of T-ag residue F257 in magenta. (Right). The location of SV40 T-ag OBD residue F257 (magenta) in the T-ag131-627 crystal structure [31]. C. Superposition of all of the above SV40 and JCV T-ag structures showing the relative locations of F257/258 (colored as above). The insert depicts a close up of the three main orientations of residue 258 (257 in SV40); the central "apo position" and the two distal orientations (the distance seperating the distal orientations is indicated (~ 13 Å). PDB IDs used in these analyses were: 1) JCV T-ag OBD apo (4NBP, 4LIF, 4LMD), 2) SV40 T-ag OBD apo (2FUF, 2IF9, 2IPR, 2ITJ, 3QK2), 3) SV40 T-ag OBD co-structures with DNA (2ITL, 2NL8, 2NTC, 4FGN, 5D9I) and 4) the SV40 T-ag131-627 fragment with DNA (4GDF).
Fig 10
Fig 10. SV40 T-ag OBD residue F257 is found stacked against aromatic residues.
Presented is a superposition of the SV40 T-ag co-structure (PDB ID = 4DGF) with the JCV T-ag F258L OBD mutant. SV40 T-ag residue F257 stacks against Y230, both shown as van der Waals surfaces. In contrast, JCV T-ag OBD residue L258, shown in orange, cannot partake in similar stacking interactions.
Fig 11
Fig 11. A model depicting how DNA dependent conformational changes in the C-terminus of the T-ag OBDs could regulate interface formation within T-ag hexamers.
A. A rendering of a single T-ag hexamer assembled at a replication fork. The OBDs (small spheres) are depicted as being proximal to the forks and assembled into a hexameric spiral (reviewed in [26]). The overall 3' to 5' movement of the T-ag helicase is suggested by the blue arrow. Not shown are the flexable linkers connecting the OBDs to the helicase domains. B. Depiction of the proposed DNA dependent dynamics within the OBD spiral at a replication fork. The structure based model of a hexameric OBD spiral at a replication fork is adapted from previous models ([37]; reviewed in [26]). The OBDs are depicted as spheres of ~ 32 Å diameter, labeled A-F, that are situated at the center of mass of each OBD. The multifunctional A1/B2 regions are depicted as very small spheres. (Left side): In the terminal A subunit of the spiral (pink), the A1/B2 region (small red sphere), is free and thus available for interactions with DNA. The other A1/B2 regions are involved in OBD:OBD interface formation (small teal colored spheres). When the A1/B2 region in subunit A interacts with the ds/ss fork, the DNA dependent conformational changes in the F257/258 containing C-termini are induced. As a result, the interface between OBD subunits A and B (purple and light blue; respectively) is disrupted. The freed OBD subunit is then free to participate in a "hand-over-hand" movement (purple arrow) and bind its A1/B2 motif to the pocket (symbolized as a "p") in subunit F. (Right side): The A1/B2 region (small red sphere) on subunit B is now accessible. Therefore, the cycle continues when the free A1/B2 regions on subunit B engage the ds/ss DNA at the fork.

Similar articles

Cited by

References

    1. Ehlers B, Wieland U. The novel human polyomaviruses HPyV6, 7, 9 and beyond. APMIS. 2013; 10.1111:1–13. - PubMed
    1. Scuda N, Madinda NF, Akoua-Koffi C, Adjogous EV, Wevers D, Hoffman J, et al. Novel Polyomaviruses of Nonhuman Primates: Genetic and Serological Predictors for the Existence of Multiple Unknown Polyomaviruses within the Human Population. PLoS Pathogens. 2013;9:e1003429 10.1371/journal.ppat.1003429 - DOI - PMC - PubMed
    1. Jiang M, Abend JR, Johson SF, Imperiale MJ. The Role of Polyomaviruses in Human Disease. Virology. 2009;384:266–73. 10.1016/j.virol.2008.09.027 - DOI - PMC - PubMed
    1. White MK, Gordon J, Khalili K. The Rapidly Expanding Family of Human Polyomaviruses: Recent Developments in Understanding Their Life Cycle and Role in Human Pathology. PLOS Pathogens. 2013;9:e1003206 10.1371/journal.ppat.1003206 - DOI - PMC - PubMed
    1. Miskin DP, Koralnik IJ. Novel syndromes associated with JC virus infection of neurons and meningeal cells: no longer a gray area. Curr Opin Neurol. 2015;28:1–7. - PMC - PubMed

Publication types

LinkOut - more resources