. 2016 Feb 9;7(6):6552-65.
doi: 10.18632/oncotarget.6771.

RUNX1 and FOXP3 interplay regulates expression of breast cancer related genes

Affiliations

RUNX1 and FOXP3 interplay regulates expression of breast cancer related genes

María Sol Recouvreux et al. Oncotarget. .

Abstract

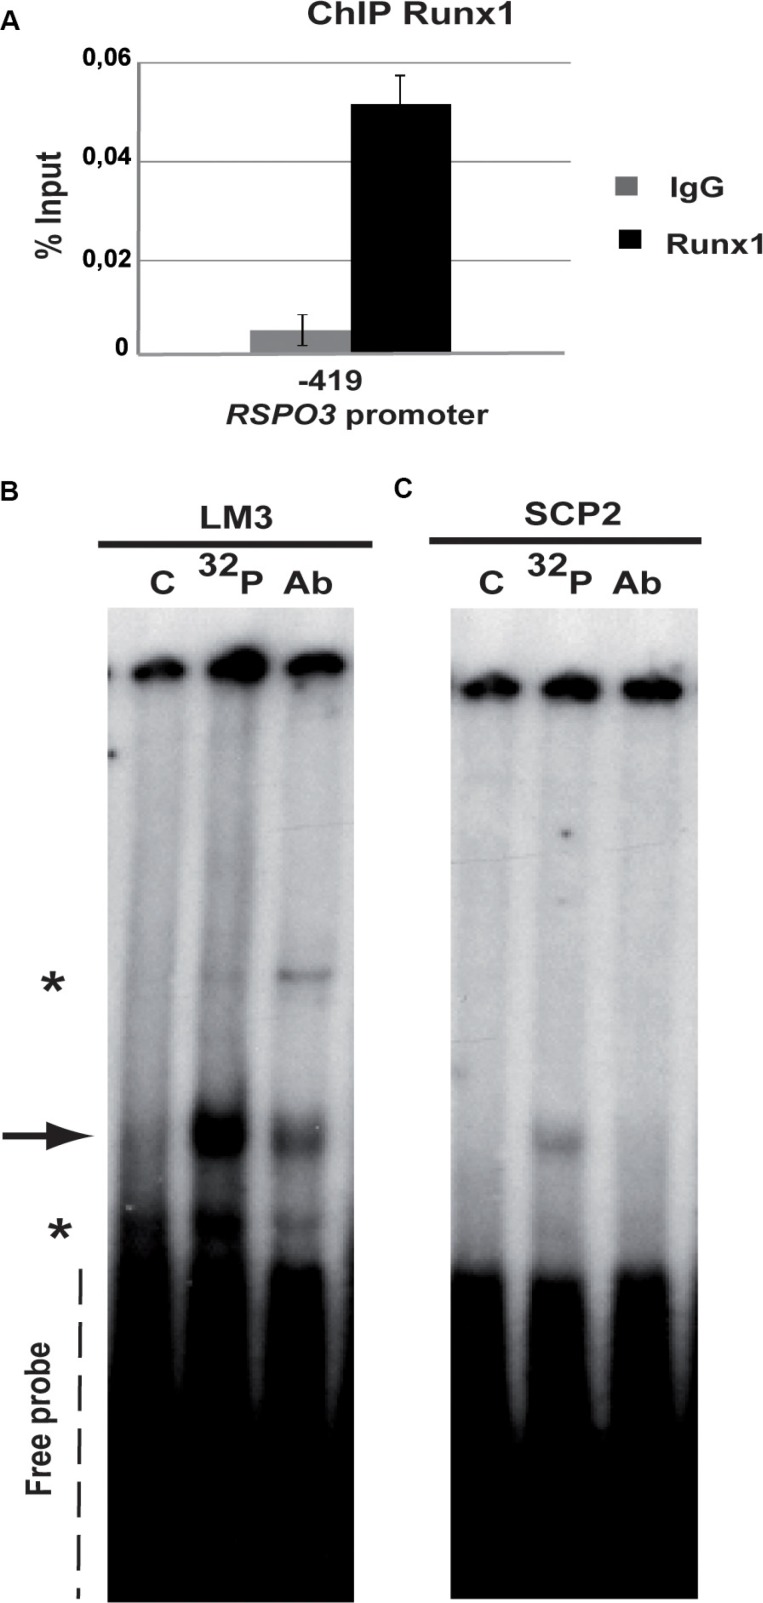
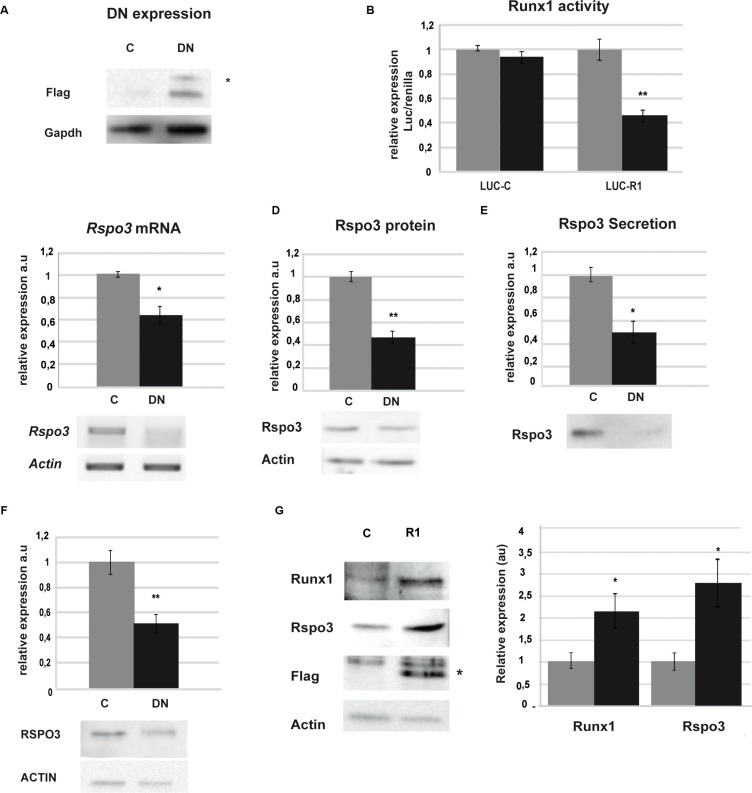
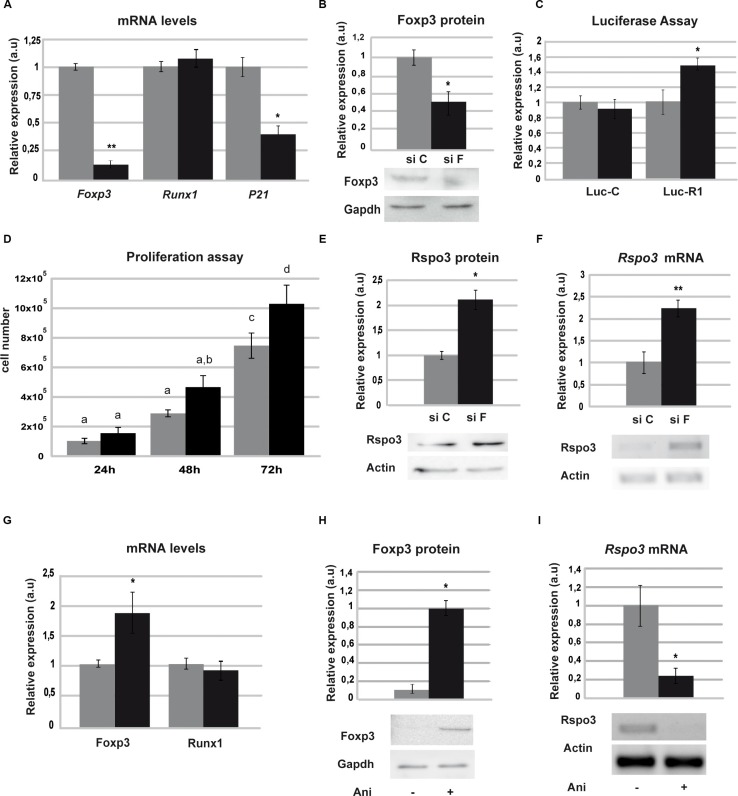
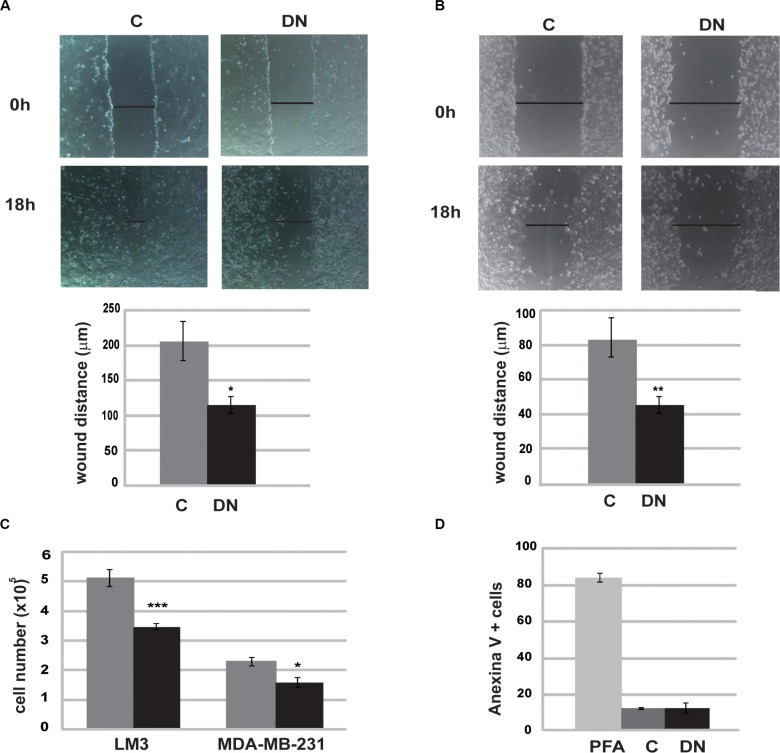
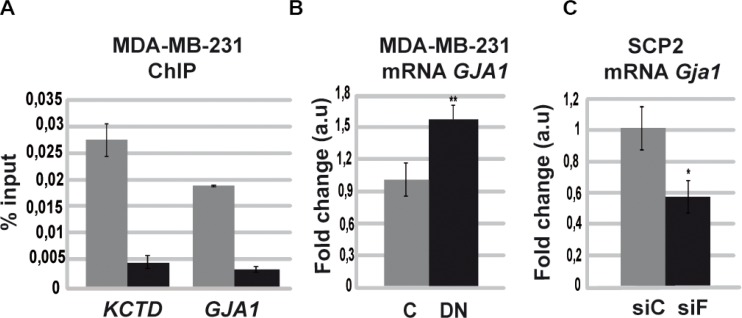
Runx1 participation in epithelial mammary cells is still under review. Emerging data indicates that Runx1 could be relevant for breast tumor promotion. However, to date no studies have specifically evaluated the functional contribution of Runx1 to control gene expression in mammary epithelial tumor cells. It has been described that Runx1 activity is defined by protein context interaction. Interestingly, Foxp3 is a breast tumor suppressor gene. Here we show that endogenous Runx1 and Foxp3 physically interact in normal mammary cells and this interaction blocks Runx1 transcriptional activity. Furthermore we demonstrate that Runx1 is able to bind to R-spondin 3 (RSPO3) and Gap Junction protein Alpha 1 (GJA1) promoters. This binding upregulates Rspo3 oncogene expression and downregulates GJA1 tumor suppressor gene expression in a Foxp3-dependent manner. Moreover, reduced Runx1 transcriptional activity decreases tumor cell migration properties. Collectively, these data provide evidence of a new mechanism for breast tumor gene expression regulation, in which Runx1 and Foxp3 physically interact to control mammary epithelial cell gene expression fate. Our work suggests for the first time that Runx1 could be involved in breast tumor progression depending on Foxp3 availability.

Keywords: Foxp3; GJA1; Rspo3; Runx1; gene expression regulation.


Conflict of interest statement

CONFLICTS OF INTEREST

The authors declare that they have no competing interests.

Figures

Figure 1
Figure 1. Runx1 binds to Rspo3 promoter
(A) ChIP assays were performed on LM3 cells using specific ChIP-grade Runx1 antibody or control IgG antibody. Specific primers were designed for targeting Runx1 high affinity binding site in the Rspo3's promoter region. Bar graph shows mean and standard deviation (SD) of three independent experiments each of them performed by triplicate. Primers for Gapdh promoter region were used as negative control with no amplification product. (B–C) Gel shift assays were performed on LM3 (B) or SCp2 (C) nuclear extracts using an oligoprobe containing Runx1 consensus sequence included in the Rspo3 promoter region (−490bp) (lane 32P and lane Ab). This band showed lower intensity when cold oligonucleotides were included in the reaction (lane C). Asterisks in the Figure show unspecific binding. 32P: phospho-labeled oligoprobe, Ab: anti-Runx1 antibody and C unlabeled oligoprobe.
Figure 2
Figure 2. Runx1 regulates Rspo3 expression
(A–F) LM3 and MDA-MB-231 cells were transfected with DN or C. (A) Western blot (WB) showing tag flag expression in LM3 cells 48 h after transfection. Asterisk indicates specific band. (B) Luciferase assays on LM3 cells 48 h after co-transfection with DN or C and a reporter vector of Runx1 activity (Luc-R1) or empty vector, as control (Luc-C). Bar graph showing mean and SD of three independent experiments (p = 0,0052) (C–D) Rspo3 mRNA levels by semi-quantitative RT-PCR (C) and protein by WB (D) on LM3 cells 48 h after transfection. Bar graph showing mean and SD of three independent experiments (p = 0.014 and (p = 0,007). (E) Rspo3 protein secretion levels by WB of conditioned media generated by LM3 cells 48 h after transfection. Values were normalized to the number of cells after transfection. Bar graph showing mean and SD of three experiments (p = 0.021). (F) RSPO3 protein levels by WB analysis on MDA-MB-231 48 h after transfection. Bar graph showing mean and SD of three independent experiments (p = 0.0047). (G) SCP2 cells were transfected with a vector containing full Runx1 cDNA (R1) or empty vector as control (C) and WB analysis of Runx1 (first line), Rspo3 (second line), Flag tag (third line) and Actb (fourth line, used as loading control) were performed. Asterisk indicates specific band. Bar graph shows WB quantification, C in grey columns and R1 in black columns. Bar graph showing mean and SD of three independent experiments (p = 0,042).
Figure 3
Figure 3. Runx1 physically interacts with Foxp3 in normal mammary epithelial cells
(A) Total protein extracts from SCp2 cells were incubated with anti-Foxp3 antibody and subsequent precipitation products were analyzed with anti-Runx1 antibody by WB analysis. IP (+) lane shows Runx1 co-immunoprecipitated with Foxp3. (B) Immunofluorescence of SCp2 cells shows subcellular localization of Runx1 (green) and Foxp3 (red) by confocal microscopy. Merge and inset figures show yellow dots representing co-localization of Runx1 and Foxp3 proteins. Magnification bar: 50 μm.
Figure 4
Figure 4. Foxp3 blocks Runx1 transcriptional activity
SCp2 cells were transfected with specific Foxp3 siRNA (siF) or scrambled control (siC) and mRNA or total protein extracts were analyzed. (A) Downregulation of Foxp3 levels (p = 0.004) (left), Runx1 (middle) and p21 (right) (p = 0.042) expression by RT-qPCR. (B) Downregulation of Foxp3 levels by WB (p = 0.013), Gapdh expression was used as loading control. (C) SCp2 cells were co-transfected with Luc-R1 or Luc-C and luciferase assay was performed (p = 0.028). (D) Proliferation assay was performed by counting cell number after siF and siC treatment (ANOVA p < 0.0001). Different letters means significant differences p < 0.05 by Bonferroni contrast. (E–F) Rspo3 expression by WB (p = 0.016) (E) and by PCR (p = 0.0059) (F) upon siF or siC treatment. Actd expression was used as loading control. Images were analyzed with image J software. In each case histogram shows mean and SD of three independent experiments, siC in grey bars and siF in black bars. (G–I) LM3 cells were incubated with Anisomycin and total protein or RNA extracts were analyzed 2 h after treatment. (G) RT-qPCR of Foxp3 (p = 0.04) (left) and Runx1 (right) were normalized to actin levels in Anisomycin treated (black bars) and control (gray bars) cells. (H) WB of Foxp3 with (black bars) or without (gray bars) Anisomycin and Gapdh was used as loading control (p = 0.022). (I) Rspo3 expression by RT-PCR. Histogram shows semi-quantification of the intensity of the band from three independent assays performed with vehicle (gray bars) or Anisomycin (black bars) (p = 0.012).
Figure 5
Figure 5. Runx1 is required for tumor cell migration
LM3 cells (A) and MDA-MB-231 cells (B) were subjected to wound healing assays for 18 h after transfection with DN or C expression vectors. Time points: 0 h and 18 h. A representative assay (up) and histograms (down) show mean and SD of three independent experiments (LM3 p = 0.02; MDA p = 0,0035). (C) LM3 and MDA-MB-231 cell number were assessed before and after transfection with DN or C expression vectors. Histogram shows mean and SD of three independent experiments (LM3 p = 0.0007; MDA p = 0,03) Axis X is 105 cells. (D) After transfection with DN or C expression vectors, LM3 cells were incubated with Annexin V-FITC and PI. Apoptosis was measure by flow citometry. PFA 4% was used as positive control.
Figure 6
Figure 6. Runx1 downregulates GJA1 gene expression in the absence of Foxp3
(A) ChIP assays were performed on MDA-MB-231 cells using specific ChIP-grade RUNX1 antibody or control IgG. Primers targeting RUNX1 high affinity binding site included in the GJA1's promoter region were designed. Histogram shows mean and SD of three independent experiments performed by triplicate. Primers for GAPDH promoter region were used as negative control with no amplification product. Primers for KCTD promoter region were used as positive control previously described in [58] (KCTD: Potassium Channel Tetramerization Domain). Anti-Runx1 antibody is in grey bars and Anti-IgG antibody is in black bars. (B) GJA1 mRNA levels by qPCR of MDA-MB-231 transfected cells with DN or C expression vector. Histograms represent mean and SD of three independent experiments (p = 0.004). (C) SCp2 cells were transfected with specific Foxp3 siRNA (siF) or scrambled control (siC) and GJA1 gene expression was measured by RT-qPCR. Histograms represent mean and SD of three independent experiments (p = 0.03).

Similar articles

Cited by

References

    1. Chuang LS, Ito K, Ito Y. RUNX family: Regulation and diversification of roles through interacting proteins. International journal of cancer. 2013;132:1260–1271. - PubMed
    1. Ito Y, Bae SC, Chuang LS. The RUNX family: developmental regulators in cancer. Nature reviews Cancer. 2015;15:81–95. - PubMed
    1. Scheitz CJ, Lee TS, McDermitt DJ, Tumbar T. Defining a tissue stem cell-driven Runx1/Stat3 signalling axis in epithelial cancer. The EMBO journal. 2012;31:4124–4139. - PMC - PubMed
    1. Keita M, Bachvarova M, Morin C, Plante M, Gregoire J, Renaud MC, Sebastianelli A, Trinh XB, Bachvarov D. The RUNX1 transcription factor is expressed in serous epithelial ovarian carcinoma and contributes to cell proliferation, migration and invasion. Cell cycle. 2013;12:972–986. - PMC - PubMed
    1. Hoi CS, Lee SE, Lu SY, McDermitt DJ, Osorio KM, Piskun CM, Peters RM, Paus R, Tumbar T. Runx1 directly promotes proliferation of hair follicle stem cells and epithelial tumor formation in mouse skin. Molecular and cellular biology. 2010;30:2518–2536. - PMC - PubMed

Publication types

MeSH terms