

Relationship Between Near-Infrared Spectroscopy and Transabdominal Ultrasonography: Noninvasive Monitoring of Intestinal Function in Neonates
- PMID: 26736134
- PMCID: PMC4708098
- DOI: 10.12659/msm.895730
Relationship Between Near-Infrared Spectroscopy and Transabdominal Ultrasonography: Noninvasive Monitoring of Intestinal Function in Neonates
Abstract
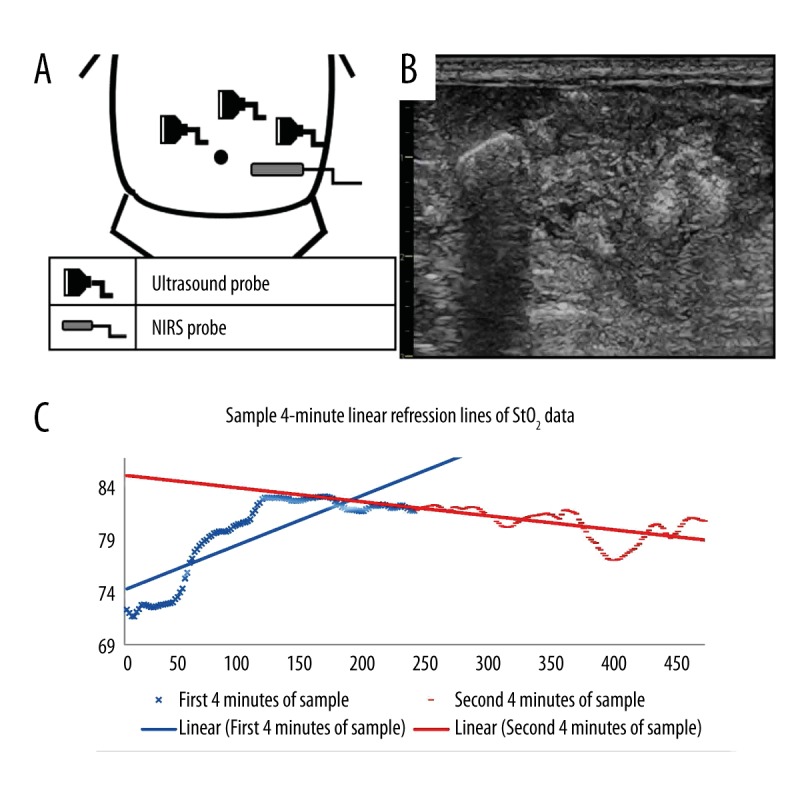
Background: Near-infrared spectroscopy (NIRS) has the potential to continuously and noninvasively monitor intestinal function. This technology may be valuable because among neonates, intestinal maturity is highly variable and difficult to assess based solely on clinical signs. The aim of this study was to determine if there is an association between NIRS-based StO2 measurements and peristaltic activity assessed by transabdominal ultrasonography (US).
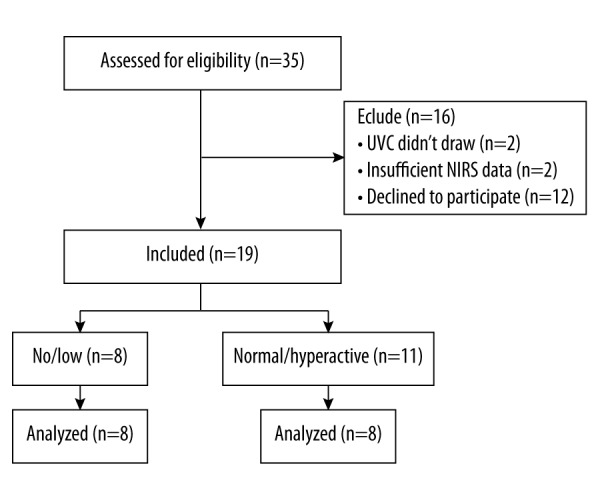
Material/methods: Nineteen neonates of gestational age >32 weeks were categorized according to "no/low" versus "normal/hyperactive" motility levels, based on blinded US scan results. StO2 was recorded every 2 s for 24 h, following the ultrasound recording. Differences between the resulting estimates of average StO2 (bias of fits) and goodness-of-fit (residuals) were evaluated.
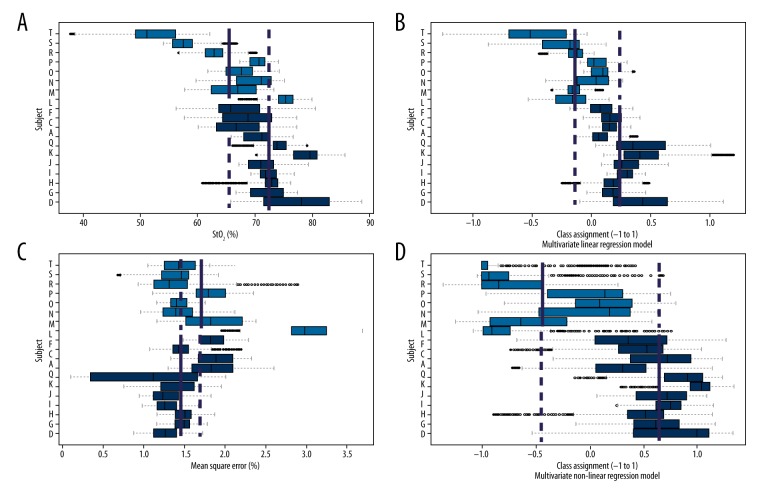
Results: Newborns with normal/hyperactive motility had higher mean StO2 than newborns with no/low motility (72.3±4.4 vs. 65.5±7.9, p<0.05, F=5.65). Residual errors were not significantly different between the 2 groups (p=0.213, F=0.213). A multivariate linear regression model using the means, residuals, and pairwise products of both, demonstrated more significant separation (0.47±0.26 vs. -0.24±0.33, p<0.01, F=27.4). A non-linear variant of the multivariate linear regression model demonstrated greatest separation (0.68±0.24 vs. -0.49±0.53, p<0.01, F=41.9).
Conclusions: This is the first study to demonstrate an association between NIRS-based StO2 measurements and peristaltic activity visualized by ultrasound imaging. NIRS may offer a continuous, noninvasive method to assess motility. This may have significant implications in premature infants at risk for feeding intolerance or necrotizing enterocolitis.
Figures
Similar articles
-
Abdominal near-infrared spectroscopy measurements are lower in preterm infants at risk for necrotizing enterocolitis.Pediatr Crit Care Med. 2014 Oct;15(8):735-41. doi: 10.1097/PCC.0000000000000211. Pediatr Crit Care Med. 2014. PMID: 25068253
-
Direct Measurement of Tissue Oxygenation in Neonates via Resonance Raman Spectroscopy: A Pilot Study.Neonatology. 2017;112(2):137-142. doi: 10.1159/000458514. Epub 2017 May 18. Neonatology. 2017. PMID: 28514777
-
Global perfusion assessment and tissue oxygen saturation in preterm infants: where are we?Early Hum Dev. 2013 Jun;89 Suppl 1:S44-6. doi: 10.1016/S0378-3782(13)70014-8. Early Hum Dev. 2013. PMID: 23809350 Review.
-
Comparing liver and lower abdomen near-infrared spectroscopy in preterm infants.Early Hum Dev. 2020 Dec;151:105194. doi: 10.1016/j.earlhumdev.2020.105194. Epub 2020 Sep 17. Early Hum Dev. 2020. PMID: 33017708
-
Measurement of gut oxygenation in the neonatal population using near-infrared spectroscopy: a clinical tool?Arch Dis Child Fetal Neonatal Ed. 2020 Jan;105(1):76-86. doi: 10.1136/archdischild-2018-316750. Epub 2019 Jun 1. Arch Dis Child Fetal Neonatal Ed. 2020. PMID: 31154420
Cited by
-
Differential effects of the retinopathy of prematurity exam on the physiology of premature infants.J Perinatol. 2019 May;39(5):708-716. doi: 10.1038/s41372-019-0331-z. Epub 2019 Feb 12. J Perinatol. 2019. PMID: 30755719 Free PMC article.
-
Utility of Abdominal Near Infrared Spectroscopy in the Management of Neonates: A Review.Am J Perinatol. 2025 Apr 17:10.1055/a-2567-5178. doi: 10.1055/a-2567-5178. Online ahead of print. Am J Perinatol. 2025. PMID: 40148222 Free PMC article.
-
Early brain and abdominal oxygenation in extremely low birth weight infants.Pediatr Res. 2022 Oct;92(4):1034-1041. doi: 10.1038/s41390-022-02082-z. Epub 2022 May 5. Pediatr Res. 2022. PMID: 35513716 Free PMC article.
-
Feeding intolerance.Early Hum Dev. 2022 Aug;171:105601. doi: 10.1016/j.earlhumdev.2022.105601. Epub 2022 Jun 10. Early Hum Dev. 2022. PMID: 35728504 Free PMC article. No abstract available.
-
IRAK Inhibitor Protects the Intestinal Tract of Necrotizing Enterocolitis by Inhibiting the Toll-Like Receptor (TLR) Inflammatory Signaling Pathway in Rats.Med Sci Monit. 2018 May 22;24:3366-3373. doi: 10.12659/MSM.910327. Med Sci Monit. 2018. PMID: 29784900 Free PMC article.
References
-
- Nowicki PT. Neonatal intestinal circulation. Comprehensive Physiology. 2010
-
- Chaaban H, Stonestreet BS. Intestinal hemodynamics and oxygenation in the perinatal period. Semin Perinatol. 2012;36:260–68. - PubMed
-
- Jadcherla SR, Kliegman RM. Studies of feeding intolerance in very low birth weight infants: Definition and significance. Pediatrics. 2002;109:516–17. - PubMed
-
- Senterre T. Practice of enteral nutrition in very low birth weight and extremely low birth weight infants. World Rev Nutr Diet. 2014;110:201–14. - PubMed
-
- Li YF, Lin HC, Torrazza RM, et al. Gastric residual evaluation in preterm neonates: a useful monitoring technique or a hindrance? Pediatr Neonatol. 2014;55:335–40. - PubMed
Publication types
MeSH terms
Substances
LinkOut - more resources
Full Text Sources
Medical
