Review
. 1989;17(3):257-321.

Theory of oxygen transport to tissue

Affiliations
Review

Theory of oxygen transport to tissue

A S Popel. Crit Rev Biomed Eng. 1989.

Abstract

This review focuses on the theory of oxygen transport to tissue and presents the state of the art in mathematical modeling of transport phenomena. Results obtained with the classic Krogh tissue-cylinder model and recent advances in mathematical modeling of hemoglobin-oxygen kinetics, the role of hemoglobin and myoglobin in facilitating oxygen diffusion, and the role of morphologic and hemodynamic heterogeneities in oxygen transport in the microcirculation are critically discussed. Mathematical models simulate different parts of the pathway of oxygen molecules from the red blood cell, through the plasma, the endothelial cell, other elements of the vascular wall, and the extra- and intracellular space. Special attention in the review is devoted to intracapillary transport, which has been the subject of intensive theoretical research in the last decade. Models of pre- and postcapillary oxygen transport are also discussed. Applications to specific organs and tissues are reviewed, including skeletal muscle, myocardium, brain, lungs, arterial wall, and skin. Unresolved problems and major gaps in our knowledge of the mechanisms of oxygen transport are identified.


Figures

FIGURE 1
FIGURE 1
Oxygen dissociation curves for hemoglobin, Equation 4 (P50 = 26 torr, n = 2.7), and myoglobin, Equation 24, (P50 = 5.3 torr).
FIGURE 2
FIGURE 2
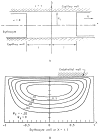
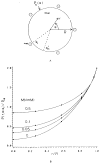
(a) Coordinate system for plasma gap between two red cells; all distances are nondimensionalized by L, the half distance between two cells; (b) Streamlines for eddy motion in the upper part of the gap in the coordinate system fixed on red cell. (From Aroesty, J. and Gross, J. F., Microvasc. Res., 2, 247, 1970. With permission.)
FIGURE 3
FIGURE 3
Effect of convection on local mass transfer rate at the capillary wall. Separation between cells equals one capillary diameter, RL=1.0.Ratio=Localmasstransferrate(convection+diffusion)Localmasstransferrate(diffusiononly) (From Aroesty, J. and Gross, J. F., Microvasc. Res., 2, 247, 1970. With permission.)
FIGURE 4
FIGURE 4
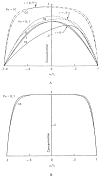
Concentration profiles c in plasma gap between red cells for Pe = 0, 1, and 10. Capillary axis is at r = 0, capillary wall at r = 1. (a) Separation equals one capillary diameter, RL = 1.0; (b) Separation equals five times capillary diameter, RL = 0.2. Profiles are shown for r = 0; profiles for r = 0.5 and 0.9 are similar. (From Aroesty, J. and Gross, J. F., Microvasc. Res., 2, 247, 1970. With permission.)
FIGURE 5
FIGURE 5
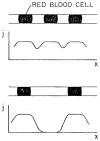
Schematic distribution of O2 flux from capillary into the tissue for different red cell separations.
FIGURE 6
FIGURE 6
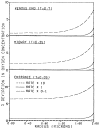
Percent deviation in oxygen concentration from local chemical equilibrium across a 4 μm capillary for different rates of Hb-O2 chemical reaction. (From Baxley, P. T. and Hellums, J. D., Ann. Biomed. Eng., 11, 401, 1983. With permission.)
FIGURE 7
FIGURE 7
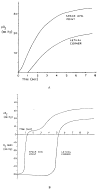
Mean red-cell hemoglobin saturation fraction as a function of dimensional time, according to Equation 47, for a red cell exposed to a zero oxygen tension at the cell boundary. The time required to go from an initial saturation SA to a saturation of SB is tB – tA, where tA and tB are the time coordinates corresponding to SA and SB on the graph. The slope of the curve decreases, hence unloading a given amount of O2 takes longer at lower saturation. (From Clark, A., Jr., Federspiel, W. J., Clark, P. A. A., and Cokelet, G. R., Biophys. J., 47, 171, 1985. With permission.)
FIGURE 8
FIGURE 8
Effect of red cell spacing, 2 L, normalized by red cell diameter and clearance, λ (the ratio of capillary to red cell diameter) on the capillary mass transfer coefficient for the case of spherical red cells in a cylindrical capillary. The mass transfer coefficient is averaged for saturations in the range S = 0.2 to 0.8. (Modified from Federspiel, W. J. and Popel, A. S., Microvasc. Res., 32, 164, 1986. With permission.)
FIGURE 9
FIGURE 9
Capillary PO2 profiles for different conditions of O2 supply computed assuming infinite rate of chemical reaction (dashed line) and finite rate (solid line). (a) Normal conditions; (b) hypoxic hypoxia (the arterial PO2 is 25 torr); (c) anemic hypoxia (the hemoglobin concentration is one third normal, equal to 5 g/100 ml). (From Gutierrez, G., Respir. Physiol., 63, 79, 1986. With permission.)
FIGURE 10
FIGURE 10
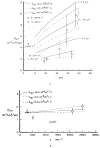
Comparison of predictions, Equation 52, for the effective oxygen diffusion coefficient with experimental data in tubes with diameter larger than 300 μm. γ is the shear rate, m is proportional to the slope of the oxyhemoglobin dissociation curve, and L is the assumed radial step in red cell movement. (a) Unsaturated blood; (b) saturated blood. (Modified from Diller, T. E. and Mikic, B. B., J. Biomech. Eng., 105, 346, 1986. With permission.)
FIGURE 11
FIGURE 11
Definition sketch of the heterogeneous tissue models: (a) Series model; (b) parallel model. (From Tai, R. C. and Chang, H. -K., J. Theor. Biol., 43, 265, 1974. With permission.)
FIGURE 12
FIGURE 12
Distribution of PO2 in cylindrical cells with 1:1 cell-to-capillary ratio (a) Homogeneous mitochondrial distribution; (b) mitochondria are clustered within 3 μm of capillaries. (From Mainwood, G. W. and Rakusan, K., Can. J. Physiol. Pharmacol., 60, 98, 1982. With permission.)
FIGURE 13
FIGURE 13
Geometry of the Krogh tissue cylinder model.
FIGURE 14
FIGURE 14
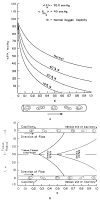
(a) PO2 profiles in the capillary, according to Krogh’s model showing the effect of reduced hematocrit (oxygen binding capacity). Numbers along the abscissa are fractions of the total capillary length. Red blood cells are shown for illustration only, the blood was treated as a homogeneous hemoglobin solution: (b) Anoxic areas of tissue between parallel concurrent capillaries resulting from the reduced hematocrit. (From Knisely, M. H., Reneau, D. D., Jr., and Bruley, D. F., Angiology, 29, S1, 1969. With permission.)
FIGURE 15
FIGURE 15
Krogh’s model used in calculations of recovery from occlusion. (a) Without oxygen debt; (b) following 2 min of occlusion with oxygen debt. (From Hyman, W. A., Grounds, D. J., and Newell, P. H., Jr., Microvasc. Res., 9, 49, 1975. With permission.)
FIGURE 16
FIGURE 16
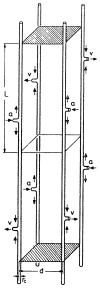
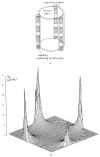
A microcirculatory unit (MCU) consists of tissue fragment of length 2 L and of 4 parallel-running capillaries, where L is identical to the capillary length, i.e., the distance between arterial inflow a and venous outflow v. The shortest distance between two capillaries is d; rc is the capillary radius. Short arrows denote direction of blood flow in capillaries. Upper and lower surface areas of the tissue fragment are hatched. (From Grunewald, W. A. and Sowa, W., Rev. Physiol. Biochem. Pharmacol., 77, 149, 1977. With permission.)
FIGURE 17
FIGURE 17
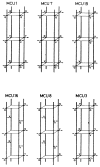
Six microcirculatory units: MCU 1 with concurrent capillary blood flow (Krogh capillary structure); MCU 7 with partial concurrent and countercurrent capillary blood flow; MCU 19 with total countercurrent capillary blood flow; MCU 16 with spirally arranged arterial inflows (and venous outflows) shifted against one another by L/2 (helical structure); MCU 3 and 8 without specific geometry in arrangement of capillary ends (asymmetric capillary structure), a = arterial inflow, v = venous outflow. (From Grunewald, W. A. and Sowa, W., Rev. Physiol. Biochem. Pharmacol, 77, 149, 1977. With permission).
FIGURE 18
FIGURE 18
Three-dimensional cubic capillary mesh model. It consists of a tissue cube with 3×3×3 capillaries. Input and output points are located at opposite corners of the cube. By symmetry, only the tetrahedron shown has to be used for numerical simulation. (From Metzger, H., Math. Biosci., 30, 31, 1976. With permission.)
FIGURE 19
FIGURE 19
Capillary-tissue oxygen concentration distribution resulting from two adjacent groups of capillaries perfused with different initial concentrations. The x axis is along the capillaries; distances are in microns. (From Salathe, E. P., Math. Biosci., 58, 171, 1982. With permission.)
FIGURE 20
FIGURE 20
Contour plot showing variation of PO2 around an arteriole. On the blood-wall interface P = PIumen = 31.6 torr. The arteriolar lumen is shown in black. The avascular wall is not shown for the sake of clarity. Capillary flow is from left to right. A “wake” of elevated PO2 is formed behind the arteriole as a result of diffusive exchange between arteriole and the surrounding tissue. (From Weerappuli, D. P.V. and Popel, A. S., J. Biomech. Eng., 111, 24, 1989. With permission.)
FIGURE 21
FIGURE 21
Compartmental model of muscle with diffusive gas exchange between tissue and all the vascular elements and with convective gas transport along the circulation. The arterioles (a0, a1, a2) and venules (v0, v1, v2) are separated into three compartments on the basis of vessel diameter; Q is the flow through the vascular compartments including the capillary compartment (C). There are two tissue compartments, one representing connective tissue (CT) between parallel segments of the larger arterioles and venules, and the other representing muscle tissue (T) with M equal to the metabolic rate. The Js represent the flux across compartmental boundaries with flux magnitudes governed by the spatially averaged partial pressures (P) and the diffusive conductances (E). (From Roth, A. C. and Wade, K., Microvasc. Res., 32, 64, 1986. With permission.)
FIGURE 22
FIGURE 22
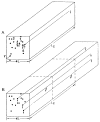
Geometrical model of the hamster cremaster muscle covered by an oxygenated solution. There are n capillary layers. Capillaries are assumed parallel to each other and concurrent. PO2 is specified at the muscle surface. (From Klitzman, B., Popel, A. S., and Duling, B. R., Microvas. Res., 25, 108, 1983. With permission.)
FIGURE 23
FIGURE 23
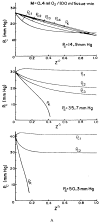
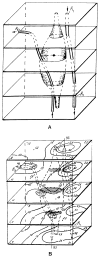
(a) Predicted intracapillary PO2 for each capillary layer, Pci, as a function of position along the capillary, z*, at three values of muscle surface oxygen tension, Ps, for the geometry shown in Figure 22. Also shown are intracapillary PO2 values predicted by the Krogh cylinder model (PK) which assumes no O2 supply from the surface, (b) Distribution of tissue PO2 in the plane z* = 1.0 at the venous end of capillaries for different values of surface oxygen tension, Ps. Panels A to C are for resting muscle and panel D is for a muscle contracting at 1 Hz. Lines are PO2 isobars. Solid circles represent perfused capillaries. (From Klitzman, B., Popel, A. S., and Duling, B. R., Microvasc. Res.. 25, 108, 1983. With permission.)
FIGURE 23
FIGURE 23
(a) Predicted intracapillary PO2 for each capillary layer, Pci, as a function of position along the capillary, z*, at three values of muscle surface oxygen tension, Ps, for the geometry shown in Figure 22. Also shown are intracapillary PO2 values predicted by the Krogh cylinder model (PK) which assumes no O2 supply from the surface, (b) Distribution of tissue PO2 in the plane z* = 1.0 at the venous end of capillaries for different values of surface oxygen tension, Ps. Panels A to C are for resting muscle and panel D is for a muscle contracting at 1 Hz. Lines are PO2 isobars. Solid circles represent perfused capillaries. (From Klitzman, B., Popel, A. S., and Duling, B. R., Microvasc. Res.. 25, 108, 1983. With permission.)
FIGURE 24
FIGURE 24
Geometry of the mathematical models, (a) Uniform capillary flow path length; (b) nonuniform capillary flow path length. Capillaries are assigned experimental values of red blood cell flux and inlet hemoglobin saturation. (From Ellsworth, M. L., Popel, A. S., and Pittman, R. N., Mi-crovasc. Res., 35, 341, 1988. With permission.)
FIGURE 25
FIGURE 25
Predictions of the distribution of hemoglobin saturation (SO2) in 6 of the 16 parallel capillaries with uniform flow pathlength (labeled 1 to 6 in Figure 24). (a) Resting muscle; (b) contracting muscle. (From Ellsworth,-M. L., Popel, A. S., and Pittman, R. N., Microvasc. Res., 35, 341, 1988. With permission.)
FIGURE 26
FIGURE 26
(a) Two-dimensional (r, θ) model of oxygen diffusion into a myoglobin-containing skeletal muscle fiber. The evenly spaced capillaries are located at the θi angular positions and the midcapillary angular positions are the θim. The oxygen tension at the sacrolemma, PS(θ), varies along the sacrolemma to model the discrete capillary oxygen supply, (b) Maximal radial gradients of oxygen tension are studied by considering radial profiles of P(r, θ = θ1) normalized by P50. The effect of myoglobin concentration is presented. Parameters correspond to the dog gracilis contracting muscle. (From Federspiel, W. J., Biophys. J., 49, 857, 1986. With permission.)
FIGURE 27
FIGURE 27
(a) Geometry of a fiber surrounded by blood capillaries; (b) PO2 distribution in a cross-section of muscle fiber surrounded by four capillaries. The fiber is surrounded by a thin concentric layer of extracellular fluid. (From Groebe, K. and Thews, G., Adv. Exp. Med. Biol., 200, 495, 1986. With permission.)
FIGURE 28
FIGURE 28
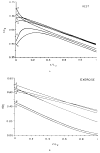
The longitudinal distribution of compartment PO2s at various input (ENTR.) PO2 at rest (—) and during moderate exercise (---). CT denotes connective tissue compartment. (From Roth, A.C. and Wade, K., Microvasc. Res., 32, 64, 1986. With permission.)
FIGURE 29
FIGURE 29
(a) Schematic representation of a microcirculatory unit with the spherical neuron at the center; (b) PO2 distribution in cross-sections of the unit. (From Kislyakov, Y. Y. and Ivanov, K. P., J. Biomech. Eng., 108, 28, 1986. With permission.)
FIGURE 30
FIGURE 30
(a) A neuron surrounded by two capillaries (K1 and K2); (b) PO2 distribution in cross-sections (cell and capillaries are indicated by hatching and dashed lines, respectively). Lines in section are isobars, with values indicating PO2 levels (torr). (From Ivanov, K. P., Kislyakov, Y. Y. and Samoilov, M. O., Microvasc. Res., 18, 434, 1979. With permission.)
FIGURE 31
FIGURE 31
PO2 profile in human thoracic aorta for steady flow. The time-averaged profile with pulsatile flow would be imperceptibly different. A large resistance to oxygen transport is located in the flowing blood. (From Schneiderman, G., Mockros, L. F., and Goldstick, T. K., J. Biomech., 15, 849, 1982. With permission.)
FIGURE 32
FIGURE 32
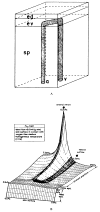
(a) Microcirculatory unit of the skin (ed, dead epidermis; ev, viable epidermis; sp, stratum papillare; a, arterial inflow; v, venous outflow); (b) PO2 distribution over a cross-section of the microcirculatory unit through the capillary loop. Resting blood flow, skin surface in contact with oxygen-free medium, homogeneous temperature of 37°C. (From Grossmann, U., Math. Biosci., 61, 205, 1982. With permission.)

Similar articles

Cited by

References

    1. Adair GS. The hemoglobin system. VI The oxygen dissociation curve of hemoglobin. J Biol Chem. 1925;63:529.
    1. Altman PL, Dittmer DS, editors. Respiration and Circulation. Federation of American Societies for Experimental Biology; Bethesda: 1971.
    1. Aroesty J, Gross JF. Convection and diffusion in the microcirculation. Microvasc Res. 1970;2:247. - PubMed
    1. Artigue RS, Hyman WA. The effect of myoglobin on the oxygen concentration in skeletal muscle subjected to ischemia. Ann Biomed Eng. 1976;4:128. - PubMed
    1. Artigue R, Bruley D, Von Rosenberg D, Mochizuki M. The effect of the red cell deoxigenation rate on oxygen delivery to tissue. Bibl Anat. 1977;15:405. - PubMed

Publication types