. 2016 Jan 6;8(320):320ra2.
doi: 10.1126/scitranslmed.aad1863.

Sources of HIV infection among men having sex with men and implications for prevention

Affiliations

Sources of HIV infection among men having sex with men and implications for prevention

Oliver Ratmann et al. Sci Transl Med. .

Abstract

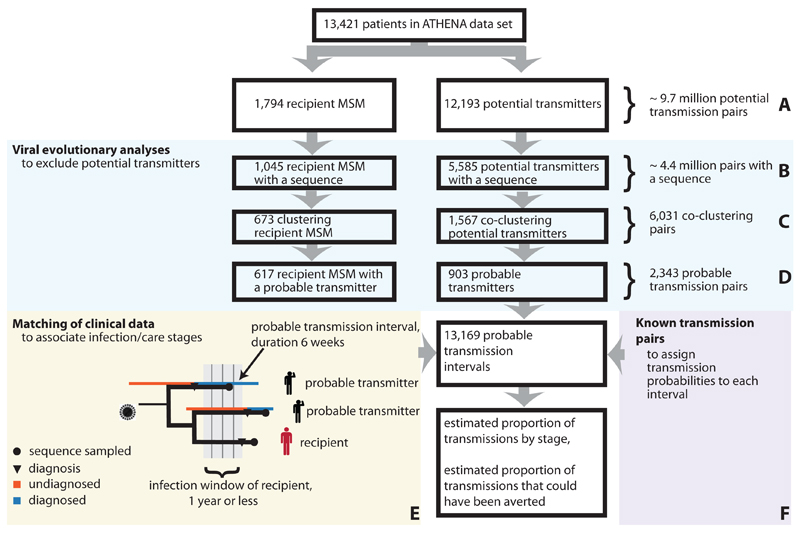
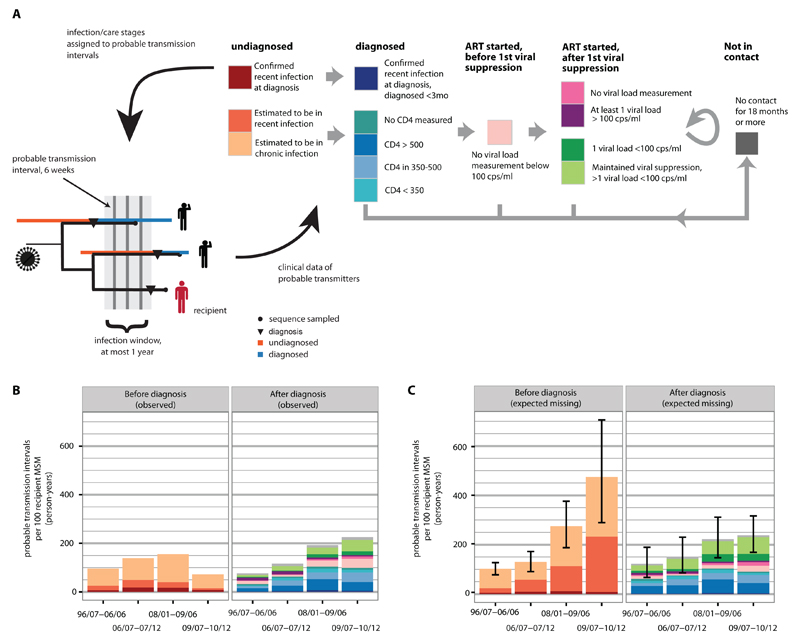
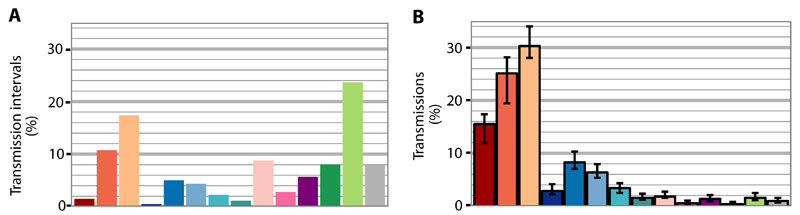
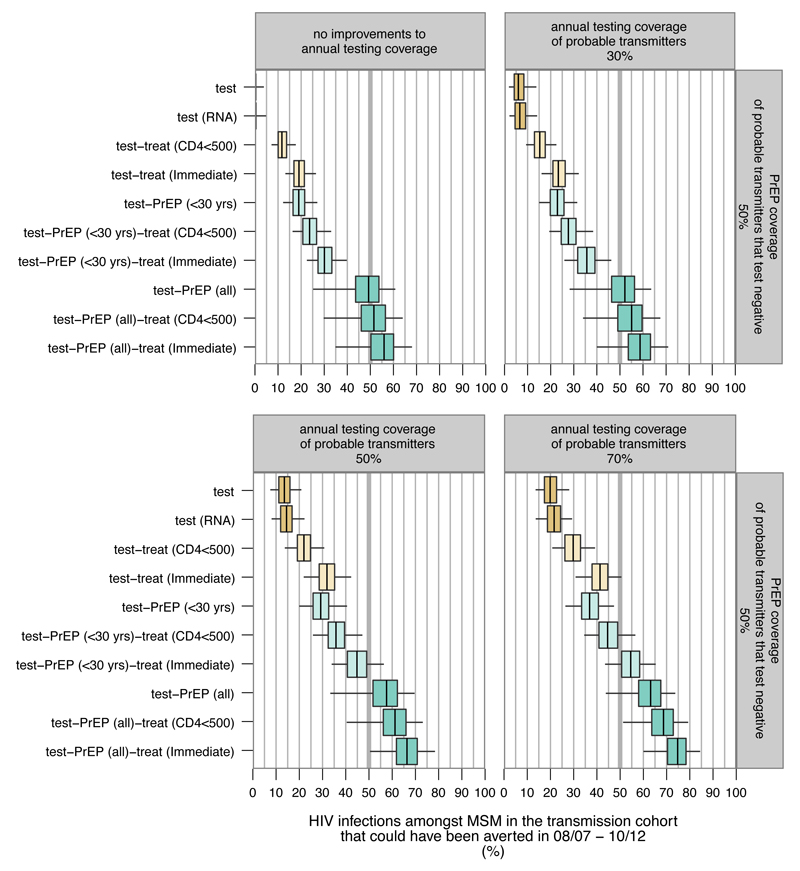
New HIV diagnoses among men having sex with men (MSM) have not decreased appreciably in most countries, even though care and prevention services have been scaled up substantially in the past 20 years. To maximize the impact of prevention strategies, it is crucial to quantify the sources of transmission at the population level. We used viral sequence and clinical patient data from one of Europe's nationwide cohort studies to estimate probable sources of transmission for 617 recently infected MSM. Seventy-one percent of transmissions were from undiagnosed men, 6% from men who had initiated antiretroviral therapy (ART), 1% from men with no contact to care for at least 18 months, and 43% from those in their first year of infection. The lack of substantial reductions in incidence among Dutch MSM is not a result of ineffective ART provision or inadequate retention in care. In counterfactual modeling scenarios, 19% of these past cases could have been averted with current annual testing coverage and immediate ART to those testing positive. Sixty-six percent of these cases could have been averted with available antiretrovirals (immediate ART provided to all MSM testing positive, and preexposure antiretroviral prophylaxis taken by half of all who test negative for HIV), but only if half of all men at risk of transmission had tested annually. With increasing sequence coverage, molecular epidemiological analyses can be a key tool to direct HIV prevention strategies to the predominant sources of infection, and help send HIV epidemics among MSM into a decisive decline.


Conflict of interest statement

Competing interests: None declared.

Figures

Fig. 1
Fig. 1. Study design.
Nationwide sources of transmission were identified for MSM with evidence for recent infection in the first year prior to diagnosis (recipient MSM). (A) Out of all patients in the ATHENA cohort, men whose course of infection overlapped with the infection window were considered as potential transmitters. (B) Only those pairs with sequences from both individuals were considered for further analysis. (C-D) Using viral phylogenetic analyses, the vast majority of pairs could be ruled out. All remaining pairs were considered phylogenetically probable. (E) Based on detailed clinical records, probable transmission events were characterized by stage in the HIV infection and care continuum. Because transmitters progressed in stage over time, we considered time-resolved transmission intervals. (F) Independent viral phylogenetic data from epidemiologically confirmed pairs was used to determine the phylogenetic probability of direct transmission during each interval. Statistical analyses adjusted for extensive sampling and censoring biases.
Fig. 2
Fig. 2. Phylogenetically probable transmission intervals, linked to stages in the infection and care continuum.
(A) Left: Each recipient could have been infected during his infection window from multiple probable transmitters. For each transmitter, the transmission window was split into six-week long probable transmission intervals. Infection/care stages were assigned to these intervals based on clinical data to reflect progression of the transmitters through the infection/care continuum. Right: Relationship between the fourteen infection/care stages as defined in table 2. Transmitters progress uni-directionally, except for stages after first viral suppression, or when individuals re-enter care (as indicated by arrows). (B) For each stage, the total number of observed transmission intervals to recipient MSM during their infection windows is shown. Overall, the number of transmission intervals per recipient increases with time, reflecting the increasing number of infected men in care. Transmitters are increasingly less likely to have been diagnosed by 2013, resulting in a decreasing number of undiagnosed transmission intervals towards the present. (C) In addition to censoring, diagnosed transmitters may not have a sequence sampled. Comparing men with and without a sequence in the near complete population cohort, we could adjust for these biases. The total number of expected missing transmission intervals to recipients diagnosed in one of four observation periods is shown, along with 95% bootstrap confidence intervals. Observed and expected missing transmission intervals were associated with phylogenetic transmission probabilities, which sum to one per recipient.
Fig. 3
Fig. 3. Proportion of transmissions by stage in the infection and care continuum, versus proportion of these stages amongst infected men.
(A) Relative frequency of infection/care stages in the population, among potential transmitters that overlap with the infection windows of recipient MSM and could have in principle transmitted to one of the recipient MSM. (stage A in figure 1, colour codes as in figure 2). (B) Proportion of the 617 transmission events attributable to each infection/care stage (bar: 95% bootstrap confidence interval).
Fig. 4
Fig. 4. Impact of biomedical interventions amongst MSM in the Netherlands.
Estimated proportion of transmissions that could have been averted in the period 2008/07-2010/12 if the corresponding additional prevention strategies had been implemented by 2008/07 (line: median, box: bootstrap interquartile range, whiskers: 95% bootstrap confidence interval). Scenarios were varied by annual testing coverage of phylogenetically identified, probable transmitters. Current testing coverage was 17%, corresponding to the proportion of probable transmitters that had a negative test in the twelve months prior to diagnosis.

References

    1. Cohen MS, Chen YQ, McCauley M, Gamble T, Hosseinipour MC, Kumarasamy N, Hakim JG, Kumwenda J, Grinsztejn B, Pilotto JH, Godbole SV, et al. Fleming, Prevention of HIV-1 infection with early antiretroviral therapy. N Engl J Med. 2011;365:493–505. - PMC - PubMed
    1. Rodger A, Bruun T, Cambiano V, Vernazza P, Estrada V, Van Lunzen J, Collins S, Geretti AM, Phillips A, Lundgren J. HIV transmission risk through condomless sex if HIV+ partner on suppressive ART: PARTNER Study. 21st, Conference on Retroviruses and Opportunistic Infections; Boston, MA, USA. 2014.
    1. Beyrer C, Baral SD, van Griensven F, Goodreau SM, Chariyalertsak S, Wirtz AL, Brookmeyer R. Global epidemiology of HIV infection in men who have sex with men. Lancet. 2012;380:367–377. - PMC - PubMed
    1. Sullivan PS, Carballo-Dieguez A, Coates T, Goodreau SM, McGowan I, Sanders EJ, Smith A, Goswami P, Sanchez J. Successes and challenges of HIV prevention in men who have sex with men. Lancet. 2012;380:388–399. - PMC - PubMed
    1. World Health Organization. No. September 2015. Geneva: 2015. Guideline on when to start antiretroviral therapy and on pre-exposure prophylaxis for HIV. - PubMed