Clinical Trial
. 2016 Jan 6;8(320):320ra4.
doi: 10.1126/scitranslmed.aad0293.

A mouse-human phase 1 co-clinical trial of a protease-activated fluorescent probe for imaging cancer

Affiliations
Clinical Trial

A mouse-human phase 1 co-clinical trial of a protease-activated fluorescent probe for imaging cancer

Melodi Javid Whitley et al. Sci Transl Med. .

Abstract

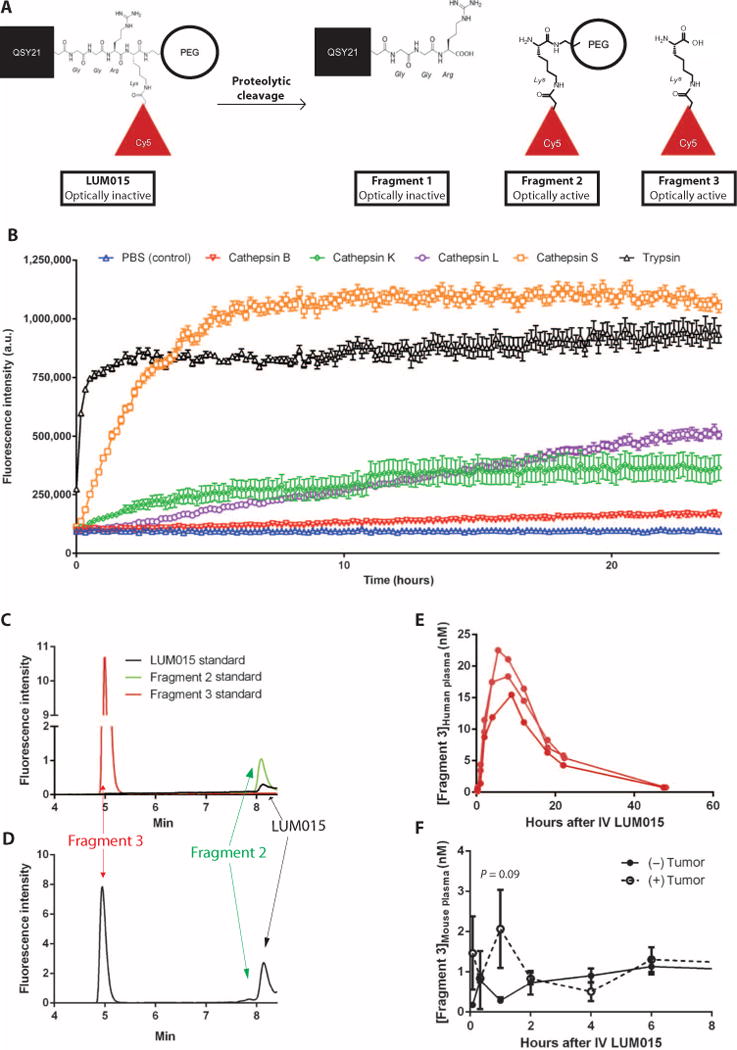
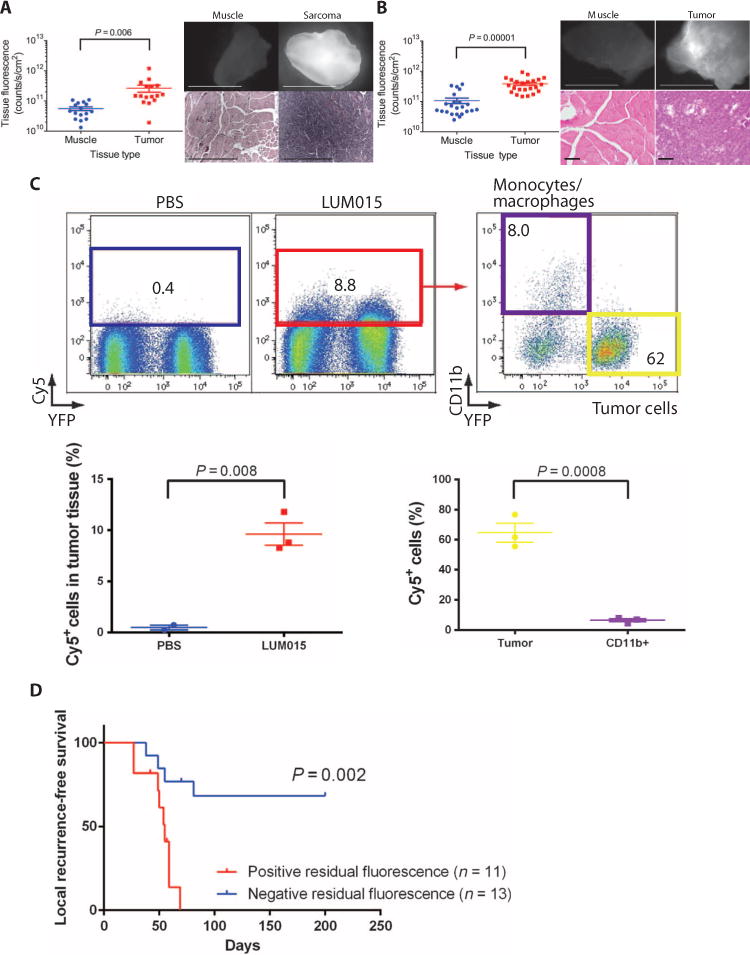
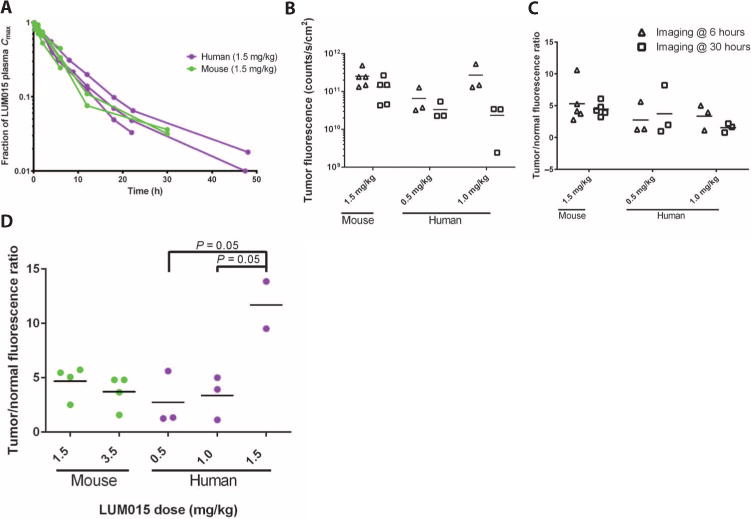
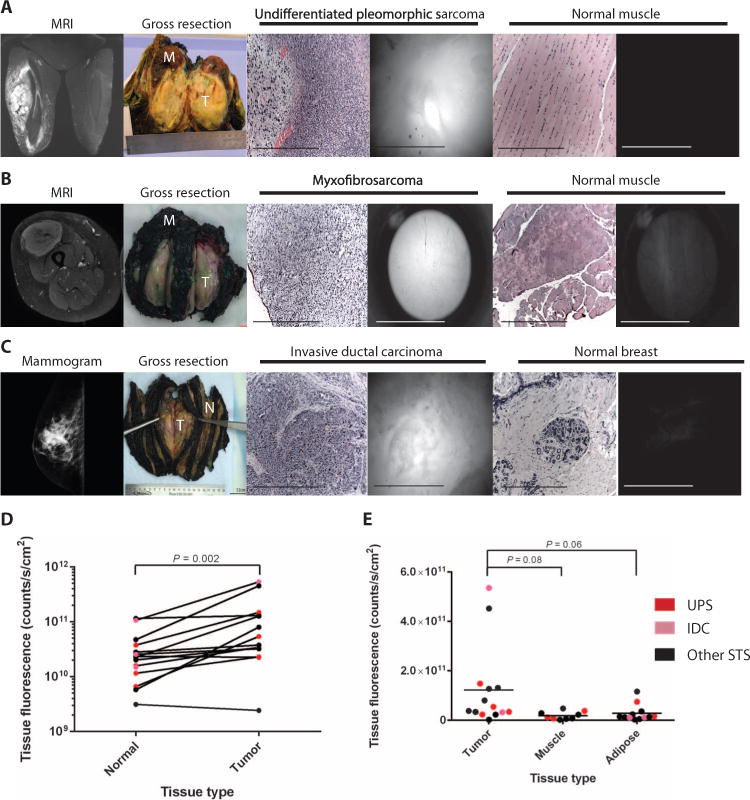
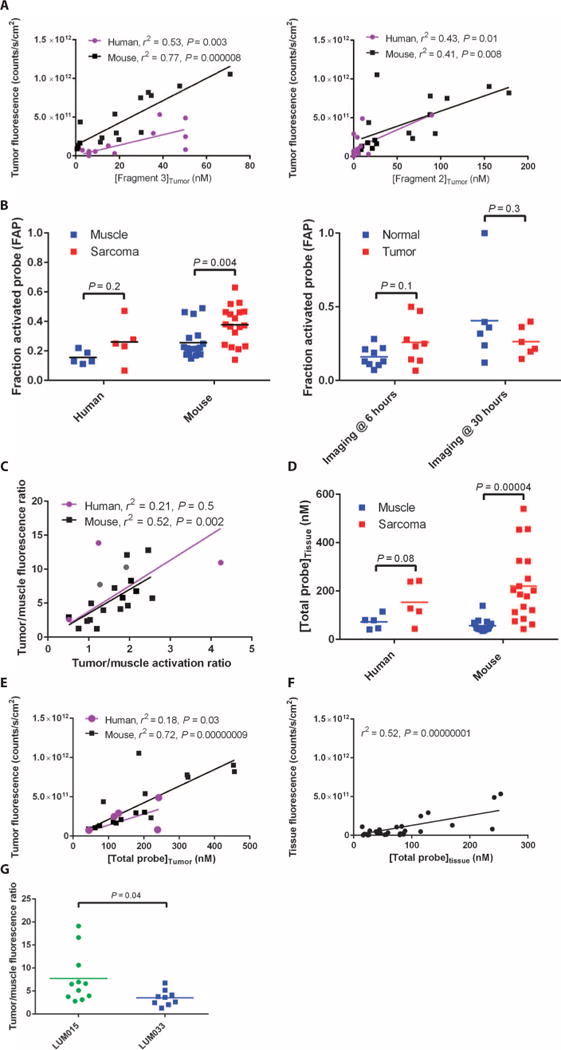
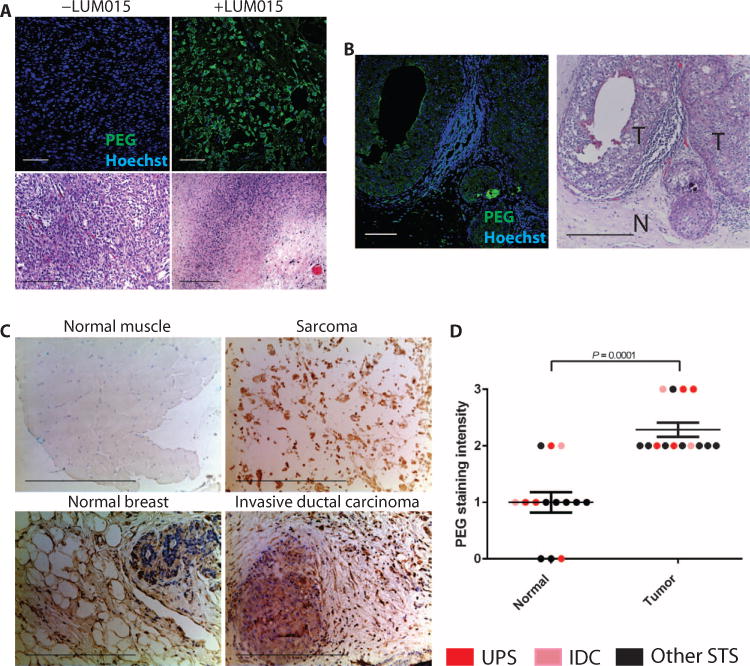
Local recurrence is a common cause of treatment failure for patients with solid tumors. Intraoperative detection of microscopic residual cancer in the tumor bed could be used to decrease the risk of a positive surgical margin, reduce rates of reexcision, and tailor adjuvant therapy. We used a protease-activated fluorescent imaging probe, LUM015, to detect cancer in vivo in a mouse model of soft tissue sarcoma (STS) and ex vivo in a first-in-human phase 1 clinical trial. In mice, intravenous injection of LUM015 labeled tumor cells, and residual fluorescence within the tumor bed predicted local recurrence. In 15 patients with STS or breast cancer, intravenous injection of LUM015 before surgery was well tolerated. Imaging of resected human tissues showed that fluorescence from tumor was significantly higher than fluorescence from normal tissues. LUM015 biodistribution, pharmacokinetic profiles, and metabolism were similar in mouse and human subjects. Tissue concentrations of LUM015 and its metabolites, including fluorescently labeled lysine, demonstrated that LUM015 is selectively distributed to tumors where it is activated by proteases. Experiments in mice with a constitutively active PEGylated fluorescent imaging probe support a model where tumor-selective probe distribution is a determinant of increased fluorescence in cancer. These co-clinical studies suggest that the tumor specificity of protease-activated imaging probes, such as LUM015, is dependent on both biodistribution and enzyme activity. Our first-in-human data support future clinical trials of LUM015 and other protease-sensitive probes.


Conflict of interest statement

Competing interests: W.D.L. is a cofounder and the CEO of Lumicell Inc., a company that is commercializing LUM015 and the LUM imaging system. M.G.B. is a cofounder of Lumicell Inc. and is a member of its scientific advisory board. L.G.G. and D.G.K. are members of the Lumicell Inc. scientific advisory board. W.D.L., M.G.B., and J.M.F. are co-inventors of LUM015 under U.S. patent application 20140301950. W.D.L., M.G.B., J.M.F., and D.G.K. are co-inventors of the handheld imaging device under U.S. patent 20140301950-A1.

Figures

Fig. 1
Fig. 1. Cy5-Lys is the major fluorescent LUM015 metabolite
(A) Expected LUM015 cleavage products: Fragment 1 contains the quencher QSY21, and optically active fragments 2 and 3 contain the Cy5 fluorophore. (B) In vitro protease (0.5 μM) activation of LUM015 (5 μM). Fluorescence was measured at multiple time points with peak excitation at 650 nm and fluorescence emission collection at 675 nm (n = 6 replicates per enzyme). (C and D) HPLC analysis of pure LUM015 (25 ng/ml), fragment 2 (25 ng/ml), and fragment 3 (2.5 ng/ml) (C) and a representative patient plasma sample collected from patient 14 at 8 hours after intravenous administration of LUM015 (1.5 mg/kg) (D). (E and F) Plasma profiles of fragment 3 in three patients (E) and in tumor-bearing and non–tumor-bearing mice (n = 6 mice per group) (F) each injected with LUM015 (1.5 mg/kg). P value determined by unpaired t test.
Fig. 2
Fig. 2. LUM015 fluorescently labels tumor cells in mouse models of STS and breast cancer
(A and B) Mean measured fluorescence in primary sarcoma (n = 16) (A) or orthotopic breast cancer (n = 23) (B) and muscle. P values determined by unpaired t test. Representative fluorescence images of resected normal muscle and tumors are shown along with corresponding hematoxylin and eosin (H&E) histology. The same contrast scale was applied to both fluorescence images in each pair. Scale bars, 5 mm for fluorescence images; 500 μm for H&E images in (A); 100 μm for H&E images in (B). (C) Representative flow cytometric analysis of resected mouse tumors expressing tumor cell–specific YFP after intravenous administration of phosphate-buffered saline (PBS) or LUM015 (3.5 mg/kg). Of the tumors from mice treated with LUM015, Cy5+ cells (red box, cells with fluorescence >2 × 10²) and YFP+ tumor cells (yellow box) were sorted and quantified (nPBS = 2 mice, nLUM015 = 3 mice). In the Cy5+ cells, the proportions of YFP+ tumor cells and CD11b+ tumor–associated macrophages were further quantified (n = 3 mice). P values were determined by unpaired t test. (D) The correlation between residual fluorescence within the sarcoma tumor bed measured before wound closure and local recurrence–free survival in mice. P value determined by log-rank test.
Fig. 3
Fig. 3. Comparative LUM015 pharmacokinetics in mouse and human subjects
(A) LUM015 plasma clearance profile in mouse and human subjects administered a 1.5 mg/kg dose of LUM015. [LUM015]plasma is given as a fraction of the maximum concentration and shown on a log scale. (B) Tumor fluorescence in patients and mice at the 6- and 30-hour imaging time points (n = 5 mice and 3 humans per dose cohort). P = 0.02 for imaging time, as determined by two-way analysis of variance (ANOVA). (C) Tumor/normal fluorescence ratio in mice and humans at the 6- and 30-hour imaging time points. P = 0.6 for imaging time, as determined by two-way ANOVA. (D) Tumor/normal fluorescence ratio measured in humans and mice by dose (nmouse-1.5, 3.5 = 5; nhuman-0.5, 1.0 = 3; nhuman-1.5 = 2). P values for dose cohort comparisons determined by Tukey’s multiple comparisons test. P = 0.02 for dose effect on human subset determined by one-way ANOVA.
Fig. 4
Fig. 4. Tumor-selective fluorescence in patients receiving intravenous LUM015 before resection
(A to C) Representative human subjects with UPS of the thigh (A, patient 2), myxofibrosarcoma of the thigh (B, patient 12), and IDC of the breast (C, patient 9). From left to right: gadolinium-enhanced magnetic resonance imaging, gross tissue resection containing tumor (T) and normal muscle (M), H&E histology of imaged tumor tissue, fluorescence image of tumor tissue obtained with the LUM device, H&E staining of imaged muscle, fluorescence image of muscle obtained with the LUM device. (D) Tumor tissue fluorescence and fluorescence measured from adjacent normal tissue in the same patient (n = 14). P value determined by paired t test. (E) Distribution of tumor, muscle, and adipose tissue fluorescence across all patients (ntumor = 14, nmuscle = 10, nadipose = 11). P = 0.04 for tissue type effect determined by one-way ANOVA. P values for tumor to muscle and adipose comparison determined by unpaired t test.
Fig. 5
Fig. 5. Tumor-selective distribution and activation of LUM015
(A) Tumor fluorescence as a function of [fragment 3]tumor and [fragment 2]tumor (nhuman = 14, nmouse = 16). P values determined by F test on the linear regression model. (B) The FAP was determined using the following equation: ([fragment 2 (nM)]tissue + [fragment 3 (nM)]tissue)/([LUM015 (nM)]tissue + [fragment 2 (nM)]tissue + [fragment 3 (nM)]tissue). FAP data are shown for muscle and tumor tissue samples from human (n = 5, patients 8 and 11 to 14) and mouse (n = 18) STS subjects and from all human subjects imaged at 6 and 30 hours (n = 14). P values determined by unpaired t test. (C) Correlation between the tumor: muscle fluorescence ratio and the FAP ratio in the mouse and human STS cohorts (nhuman = 5, nmouse = 16). P value determined by F test on the linear regression model. (D) The [TP] in the tissue (in nM) was determined using the following equation: [LUM015]tissue + [fragment 2]tissue + [fragment 3]tissue. [TP] data are shown for muscle and tumor tissue samples from human (n = 5, patients 8 and 11 to 14) and mouse (n = 18) STS subjects. P values determined by unpaired t test. (E and F) Tumor fluorescence versus [TP] in the mouse and human STS cohorts (nhuman = 5, nmouse = 16) (E) and in tumor and normal tissue samples from all human subjects (n = 14 per tissue type) (F). P values determined by F test on the linear regression models. (G) Tumor/muscle fluorescence ratios measured in mice 6 hours after injection with equimolar amounts of LUM015 or LUM033 (nLUM015 = 11, nLUM033 = 9). P value determined by unpaired t test.
Fig. 6
Fig. 6. Visualizing tumor-selective LUM015 biodistribution
(A) PEG immunofluorescence of human tumor samples from LUM015-injected patients (+LUM015 representative image from patient 2) and from uninjected patients (−LUM015 representative image from n = 3 patients) with UPS. (B) PEG immunofluorescence of margin tissue from LUM015-injected breast cancer patient 15. T, tumor tissue; N, normal breast tissue. The corresponding H&E histology is shown. (C) Immunohistochemistry for PEG in normal muscle tissue, normal breast tissue, and tumor tissue. Representative images of normal muscle and UPS (patient 2) as well as normal breast and IDC (patient 9). (D) Quantification of PEG staining intensity in tumors and normal tissues (n = 14 per tissue type; 1 tumor and 1 normal tissue sample from each patient except patient 10). P value determined by Mann-Whitney test.

References

    1. Pisters PW, Leung DH, Woodruff J, Shi W, Brennan MF. Analysis of prognostic factors in 1,041 patients with localized soft tissue sarcomas of the extremities. J Clin Oncol. 1996;14:1679–1689. - PubMed
    1. Fisher B, Anderson S, Bryant J, Margolese RG, Deutsch M, Fisher ER, Jeong JH, Wolmark N. Twenty-year follow-up of a randomized trial comparing total mastectomy, lumpectomy, and lumpectomy plus irradiation for the treatment of invasive breast cancer. N Engl J Med. 2002;347:1233–1241. - PubMed
    1. Yang JC, Chang AE, Baker AR, Sindelar WF, Danforth DN, Topalian SL, DeLaney T, Glatstein E, Steinberg SM, Merino MJ, Rosenberg SA. Randomized prospective study of the benefit of adjuvant radiation therapy in the treatment of soft tissue sarcomas of the extremity. J Clin Oncol. 1998;16:197–203. - PubMed
    1. Anscher MS, Jones P, Prosnitz LR, Blackstock W, Hebert M, Reddick R, Tucker A, Dodge R, Leight G, Jr, Iglehart JD, et al. Local failure and margin status in early-stage breast carcinoma treated with conservation surgery and radiation therapy. Ann Surg. 1993;218:22–28. - PMC - PubMed
    1. Cendán JC, Coco D, Copeland EM., III Accuracy of intraoperative frozen-section analysis of breast cancer lumpectomy-bed margins. J Am Coll Surg. 2005;201:194–198. - PubMed

Publication types