. 2016 Jan 7:6:18956.
doi: 10.1038/srep18956.

Molecular mapping and characterization of the silkworm apodal mutant

Affiliations

Molecular mapping and characterization of the silkworm apodal mutant

Peng Chen et al. Sci Rep. .

Abstract

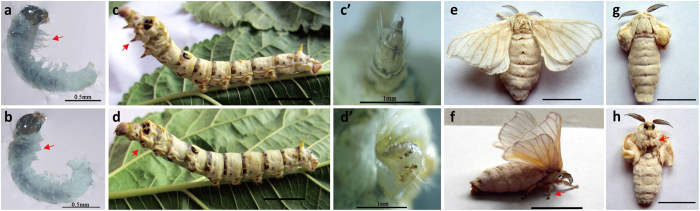
The morphological diversity of insects is important for their survival; in essence, it results from the differential expression of genes during development of the insect body. The silkworm apodal (ap) mutant has degraded thoracic legs making crawling and eating difficult and the female is sterile, which is an ideal subject for studying the molecular mechanisms of morphogenesis. Here, we confirmed that the infertility of ap female moths is a result of the degradation of the bursa copulatrix. Positional cloning of ap locus and expression analyses reveal that the Bombyx mori sister of odd and bowl (Bmsob) gene is a strong candidate for the ap mutant. The expression of Bmsob is down-regulated, while the corresponding Hox genes are up-regulated in the ap mutant compared to the wild type. Analyses with the dual luciferase assay present a declined activity of the Bmsob promoter in the ap mutant. Furthermore, we demonstrate that Bmsob can inhibit Hox gene expression directly and by suppressing the expression of other genes, including the BmDsp gene. The results of this study are an important contribution to our understanding of the diversification of insect body plan.


Figures

Figure 1
Figure 1. Phenotypes of wild type and apodal (ap) mutant.
(a) Wild-type (ap/+ap) embryo. The arrow indicates the normal thoracic legs. Bar = 0.5 mm. (b) The ap mutant (ap/ap) embryo. The arrow indicates degraded thoracic legs. Bar = 0.5 mm. (c) Wild-type (ap/+ap) larva. The arrow indicates the normal thoracic legs. Bar = 1 cm. (d) The ap mutant (ap/ap) larva. The arrow indicates degraded thoracic legs. Bar = 1 cm. (c′) Enlargement of the thoracic leg in (c). Bar = 1 mm. (d′) Enlargement of the degraded thoracic leg in (d). Bar = 1 mm. (e) Dorsal side of the wild-type (ap/+ap) adult. Bar = 1 cm. (f) Lateral view of the wild-type (ap/+ap) adult. The arrow indicates the normal thoracic legs. Bar = 1 cm. (g) Dorasl side of the ap mutant (ap/ap) adult. Bar = 1 cm. The wings of the ap mutant adult were smaller compared to the wild type (e). (h) Ventral side of the ap mutant (ap/ap) adult. The arrow indicates degraded thoracic legs. Bar = 1 cm.
Figure 2
Figure 2. Genital glands of the wild type and ap mutant female adult.
(a) The genital gland of the ap/+ap female adult. The female moths were mated for 6 h before dissection. The arrow indicates the normal bursa copulatrix with seminal fluid. (b) The genital gland of the ap/ap female adult. The female moths were mated for 6 h before dissection. The arrow indicates the degraded bursa copulatrix. (c) Enlargement of the bursa copulatrix in (a). (d) Enlargement of the bursa copulatrix in (b). (e) Bursa copulatrix of the ap/+ap female moth without mating. (f) Bursa copulatrix of the ap/ap female moth without mating. The green dots indicated the outline of the bursa copulatrix and the blue dots indicated the sperm canal. Bar = 1 mm.
Figure 3
Figure 3. Mapping of the ap locus on the B. mori linkage group 3.
(a) The 3rd linkage group of B. mori. The mutation symbols are shown above the map and the corresponding locus in centiMorgans (cM) are shown below the map. (b) Genomic scaffolds on chromosome 6. Orange boxes represent the assembled scaffolds and the names of the scaffolds are shown below. (c) Scaffold map and gene model of the nscaf2930 and nscaf2924 scaffolds on chromosome 3. The markers are identified above the map and the numerals below the map indicate the number of recombinants identified in 384 F2 progeny. Blue arrows represent the predicted genes in SilkDB, and red arrows represent the validated genes.
Figure 4
Figure 4. Temporal expression profiles of the Bmsob gene.
(a) Expression profile of the Bmsob gene during silkworm embryonic development. NHL, newly hatched larvae. (b) Temporal expression of Bmsob in the silkworm from the 4th instar larvae to the pupa stage. Total RNA samples were isolated from the whole bodies. (c) Temporal expression profile of the Bmsob gene in the development of the wing. Total RNA samples were isolated from the wing discs of larvae and the wings of pupae and moths. The Bombyx mori Actin 3 gene was used as internal control. d, day; 4th, fourth instar; 5th, fifth instar; W, wandering stage; P, pupa stage; P-M, the day before the moth; M, moth.
Figure 5
Figure 5. Analysis of the Bmsob gene and its promoter region in the wild type (Dazao) and the ap mutant.
(a) Relative quantitative analysis of Bmsob in Dazao and ap mutant embryos. (b) Relative quantitative analysis of Bmsob in Dazao and ap mutant pupae (1 d). (c) A diagram of the construction of the luciferase reporter gene vectors. (d) The relative activity of the Bmsob promoter in Dazao and the ap mutant. DZ, Dazao; **P < 0.01, Student’s t-test, n = 3.
Figure 6
Figure 6. Expression profiles of Hox genes in Dazao and the ap mutant and the interaction between the Bmsob protein and Hox genes.
(a) Expression profiles of Hox genes in Dazao and the ap mutant. **P < 0.01, Student’s t-test, n = 3. Detection by EMSA of (b) the interaction between the Bmsob protein and the BmAntp gene; (c) the interaction between the Bmsob protein and the BmUbx gene; (d) the interaction between the Bmsob protein and the BmAbd-B gene. The amount of GST protein used in the reactions was 1 μg and the amount of Bmsob protein was 0.8 μg. The amount of biotin labeling probe, in turn, was 1, 2 and 6 pmol. The amount of unlabeled probe, in turn, was 2, 20 and 100 pmol. The arrow indicates the protein-DNA complex.
Figure 7
Figure 7. Expression profiles of the BmDsp gene in Dazao and the ap mutant, the interaction between the Bmsob protein and the BmDsp gene and the interaction between the BmDsp protein and the Hox genes.
(a) Expression profiles of BmDsp genes in Dazao and the ap mutant. **P < 0.01, Student’s t-test, n = 3. Detection by EMSA of (b) the interaction between the Bmsob protein and the BmDsp gene; (c) the interaction between the BmDsp protein and the BmAntp gene; (d) the interaction between the BmDsp protein and the BmUbx gene; (e) the interaction between the BmDsp protein and the BmAbd-B gene. The amount of protein used in each reaction was: GST 1 μg; Bmsob 0.8 μg; BmDsp 0.8 μg. The amount of biotin labeling probe, in turn, was 1, 2 and 6 pmol. The amount of unlabeled probe, in turn, was 2, 20 and 100 pmol. The arrow indicates the protein-DNA complex. (f) Predicted regulation relationship between the Bmsob, BmDsp and Hox genes.

References

    1. Heffer A. & Pick L. Conservation and variation in Hox genes: how insect models pioneered the evo-devo field. Annu Rev Entomol 58, 161–179 (2013). - PubMed
    1. Williams J. A. & Carroll S. B. The origin, patterning and evolution of insect appendages. Bioessays 15, 567–577 (1993).
    1. Angelini D. R. & Kaufman T. C. Insect appendages and comparative ontogenetics. Dev Biol 286, 57–77 (2005). - PubMed
    1. Erwin D. H. & Davidson E. H. The evolution of hierarchical gene regulatory networks. Nat Rev Genet 10, 141–148 (2009). - PubMed
    1. Gehring W. J. The animal body plan, the prototypic body segment, and eye evolution. Evol Dev 14, 34–46 (2012). - PubMed

Publication types

Substances

LinkOut - more resources