. 2016 Jan 7:6:18889.
doi: 10.1038/srep18889.

Drug response in organoids generated from frozen primary tumor tissues

Affiliations

Drug response in organoids generated from frozen primary tumor tissues

Alex J Walsh et al. Sci Rep. .

Erratum in

Abstract

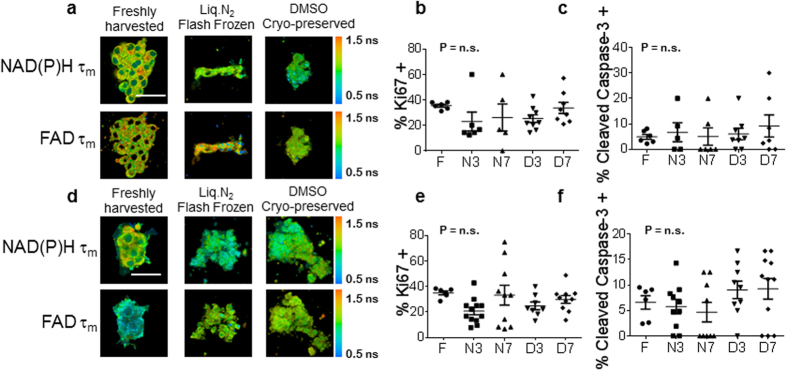
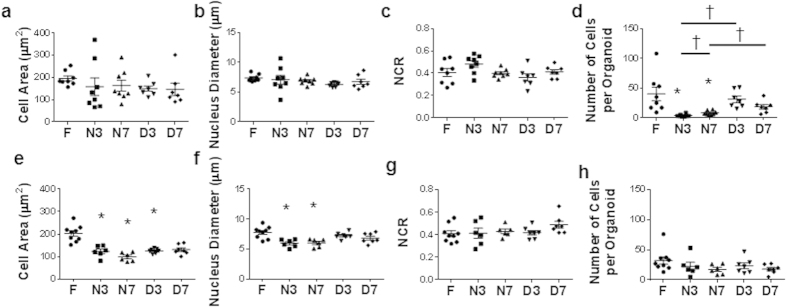
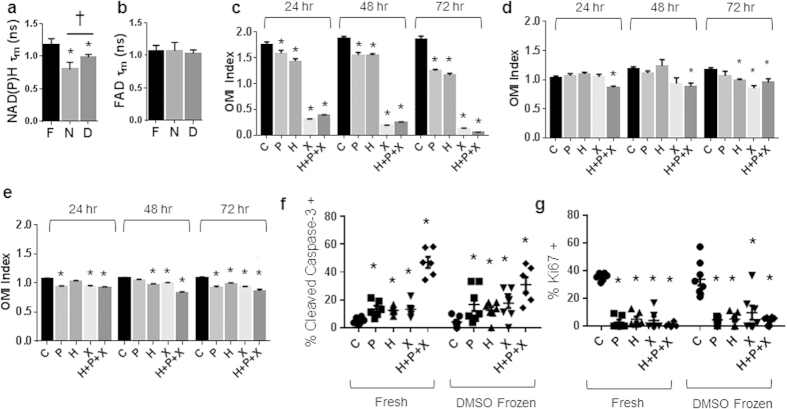
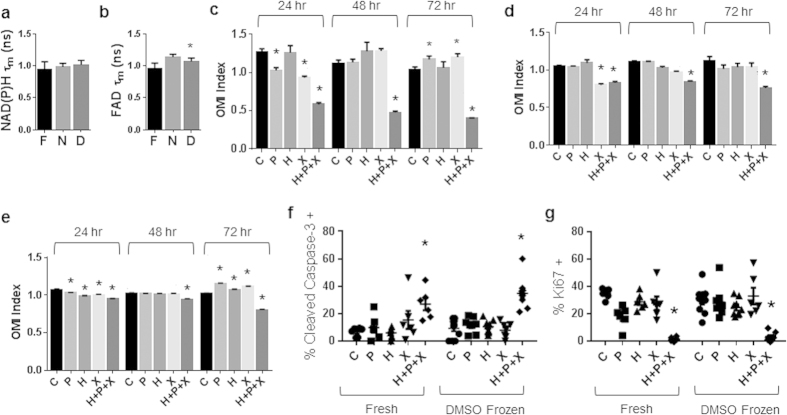
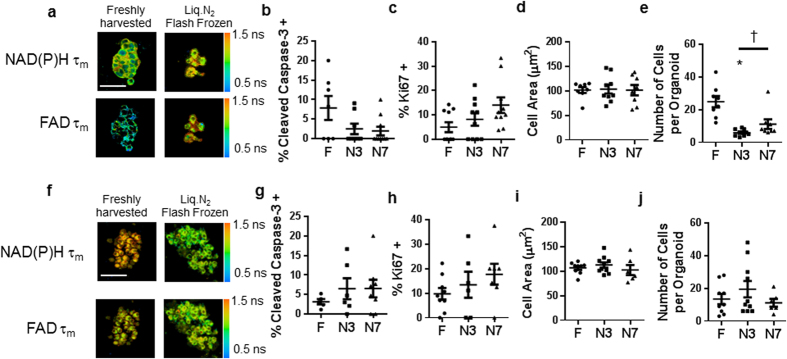
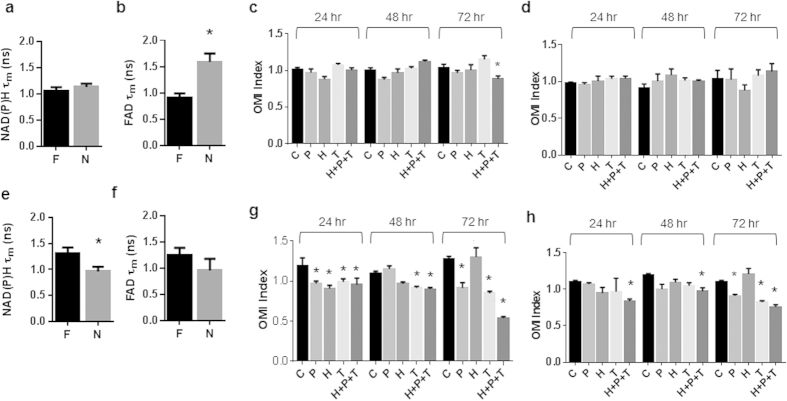
Primary tumor organoids grown in three-dimensional culture provide an excellent platform for studying tumor progression, invasion, and drug response. However, organoid generation protocols require fresh tumor tissue, which limits organoid research and clinical use. This study investigates cellular morphology, viability, and drug response of organoids derived from frozen tissues. The results demonstrate that viable organoids can be grown from flash-frozen and thawed tissue and from bulk tissues slowly frozen in DMSO supplemented media. While the freezing process affects the basal metabolic rate of the cells, the optical metabolic imaging index correlates between organoids derived from fresh and frozen tissue and can be used to detect drug response of organoids grown from frozen tissues. The slow, DMSO frozen tissue yielded organoids with more accurate drug response than the flash frozen tissues, and thus bulk tissue should be preserved for subsequent organoid generation by slow freezing in DMSO supplemented media.


Figures

Figure 1
Figure 1. Organoids derived from frozen-thawed xenograft tumors are viable.
(a) Representative NAD(P)H τm and FAD τm images of BT474 organoids derived from fresh, flash-frozen, and DMSO cyro-preserved tissues. Scale bar is 50 μm. (b) Ki67 and (c) cleaved caspase 3 staining of control organoids derived from fresh, flash-frozen and DMSO frozen BT474 tumors. (d) Representative NAD(P)H τm and FAD τm images of HR6 organoids derived from fresh, flash-frozen, and DMSO cyro-preserved tissues. Scale bar is 50 μm. (e) Ki67 and (f) cleaved caspase 3 staining of control organoids derived from fresh, flash-frozen and DMSO frozen HR6 tumors. F = Fresh, N3/7 = Flash frozen and grown for 3/7 days, D3/7 = DMSO frozen and grown for 3/7 days. n = 5–12 organoids.
Figure 2
Figure 2. Morphology of organoids derived from frozen-thawed xenograft tumors may differ from organoids derived from fresh tissue.
(a) Cell area, (b) nucleus diameter, and (c) nucleus to cytoplasm ratio (NRC) for BT474 organoids derived from fresh and frozen/thawed tissues. (d) Number of cells per organoid for BT474 organoids derived from fresh and frozen/thawed tissues. (e) Cell area, (f) nucleus diameter, and (g) nucleus to cytoplasm ratio for HR6 organoids derived from fresh and frozen/thawed tissues. (h) Number of cells per organoid for HR6 organoids derived from fresh and frozen/thawed tissues. F = Fresh, N3/7 = Flash frozen and grown for 3/7 days, D3/7 = DMSO frozen and grown for 3/7 days. *p < 0.05 versus Fresh. †p < 0.05 as indicated. n = 6–9 organoids.
Figure 3
Figure 3. Drug response of BT474 organoids derived from frozen-thawed tumors matches drug response of organoids derived from fresh tissue.
(a) NAD(P)H τm and (b) FAD τm measured from BT474 organoids derived from fresh or frozen tissues grown for 7 days. *p < 0.05 vs Fresh, †p < 0.05, as indicated; mean+/− SE. n = 30–300 cells. F = Fresh, N = Flash frozen, D = DMSO frozen. Drug response of BT474 organoids derived from fresh tissue (c), flash-frozen tissue grown for 7 days (d), and DMSO frozen tissue grown for 7 days (e) at 24, 48, and 72 hr. *p < 0.05 versus control; mean +/− SE. n = 30–300 cells. Cleaved caspase 3 (f) and Ki67 (g) staining of 72 hr drug-treated organoids derived from fresh and DMSO frozen (grown for 7 days) tissues. *p < 0.05 versus control, within Fresh or DMSO Frozen. n = 5–8 organoids. C = Control, P = Paclitaxel, H = Trastuzumab, X = XL147.
Figure 4
Figure 4. Drug response of HR6 organoids derived from frozen-thawed tumors matches drug response of organoids derived from fresh tissue.
(a) NAD(P)H τm and (b) FAD τm measured from HR6 organoids derived from fresh or frozen tissues grown for 7 days. *p < 0.05 vs. Fresh; mean +/− SE. F = Fresh, N = flash frozen, D = DMSO frozen. n = 30–300 cells. Drug response of HR6 organoids derived from fresh tissue (c), flash-frozen tissue grown for 7 days (d), and DMSO-frozen tissue grown for 7 days (e) at 24, 48, and 72 hr. *p < 0.05 versus control; mean +/− SE. n = 30–300 cells. Cleaved caspase 3 (f) and Ki67 (g) staining of 72 hr drug-treated organoids derived from fresh and DMSO frozen (grown for 7 days) tissues. *p < 0.05 versus control, within Fresh or DMSO Frozen. n = 6–11 organoids. C = Control, P = Paclitaxel, H = Trastuzumab, X = XL147.
Figure 5
Figure 5. Organoids derived from frozen-thawed human tumors are viable.
(a) Representative NAD(P)H τm and FAD τm images of organoids derived from fresh and flash frozen/thawed Patient Sample 1. Scale bar is 50 μm. (b) Cleaved caspase 3 staining, (c) Ki67 staining, (d) cell area, and (e) number of cells per organoid for organoids derived from fresh and flash-frozen/thawed Patient Sample 1. (f) Representative NAD(P)H τm and FAD τm images of organoids derived from fresh and flash frozen/thawed Patient Sample 2. Scale bar is 50 μm. (g) Cleaved caspase 3 staining, (h) Ki67 staining, (i) cell area, and (j) number of cells per organoid for organoids derived from fresh and flash-frozen/thawed Patient Sample 2. †p < 0.05 as indicated; *p < 0.05 versus Fresh. F = Fresh, N3/7 = Flash frozen and grown for 3/7 days. n = 5–10 organoids.
Figure 6
Figure 6. Drug response of organoids derived from flash-frozen thawed human breast tumors resembles drug response of organoids derived from fresh tissue.
(a) NAD(P)H τm and (b) FAD τm measured from Patient Sample 1 organoids derived from fresh or flash-frozen tissues. *p < 0.05, versus Fresh. F = Fresh, N = flash frozen. Drug response of Patient Sample 1 organoids derived from fresh tissue (c) and flash-frozen tissue grown for 7 days (d) at 24, 48, and 72 hr. (e) NAD(P)H τm and (f) FAD τm measured from Patient Sample 2 organoids derived from fresh or flash-frozen tissues. *p < 0.05, versus Fresh. Drug response of Patient Sample 2 organoids derived from fresh tissue (g) and flash frozen tissue grown for 7 days (h) at 24, 48, and 72 hr. *p < 0.05 versus control; mean + /− SE. n = 30–300 cells.

Similar articles

Cited by

References

    1. Debnath J. & Brugge J. S. Modelling glandular epithelial cancers in three-dimensional cultures. Nat Rev Cancer 5, 675–688 (2005). - PubMed
    1. Griffith L. G. & Swartz M. A. Capturing complex 3D tissue physiology in vitro. Nat Rev Mol Cell Bio 7, 211–224 (2006). - PubMed
    1. Gudjonsson T., Ronnov-Jessen L., Villadsen R., Bissell M. J. & Petersen O. W. To create the correct microenvironment: three-dimensional heterotypic collagen assays for human breast epithelial morphogenesis and neoplasia. Methods 30, 247–255 (2003). - PMC - PubMed
    1. Kamb A. What’s wrong with our cancer models? Nat Rev Drug Disc 4, 161–165 (2005). - PubMed
    1. Voskoglou-Nomikos T., Pater J. L. & Seymour L. Clinical predictive value of the in vitro cell line, human xenograft, and mouse allograft preclinical cancer models. Clin Cancer Res 9, 4227–4239 (2003). - PubMed

Publication types

Substances