. 2016 Jan 7:7:10252.
doi: 10.1038/ncomms10252.

TIA1 oxidation inhibits stress granule assembly and sensitizes cells to stress-induced apoptosis

Affiliations

TIA1 oxidation inhibits stress granule assembly and sensitizes cells to stress-induced apoptosis

Kyoko Arimoto-Matsuzaki et al. Nat Commun. .

Abstract

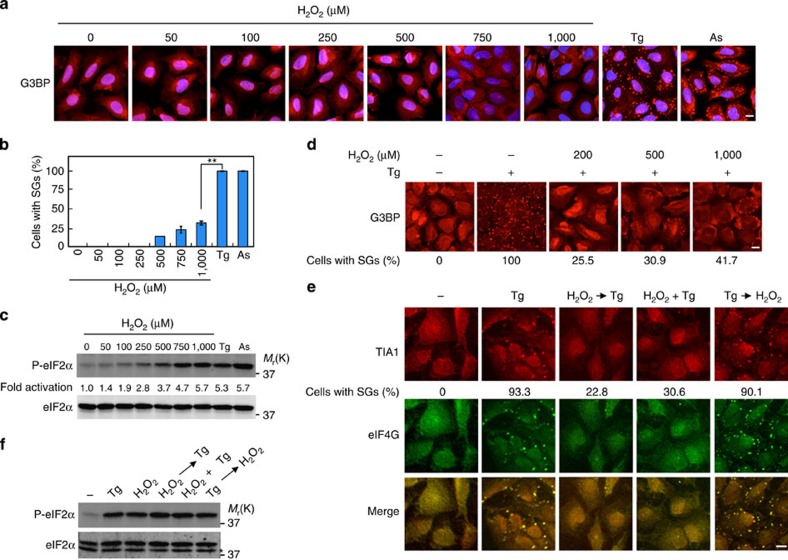
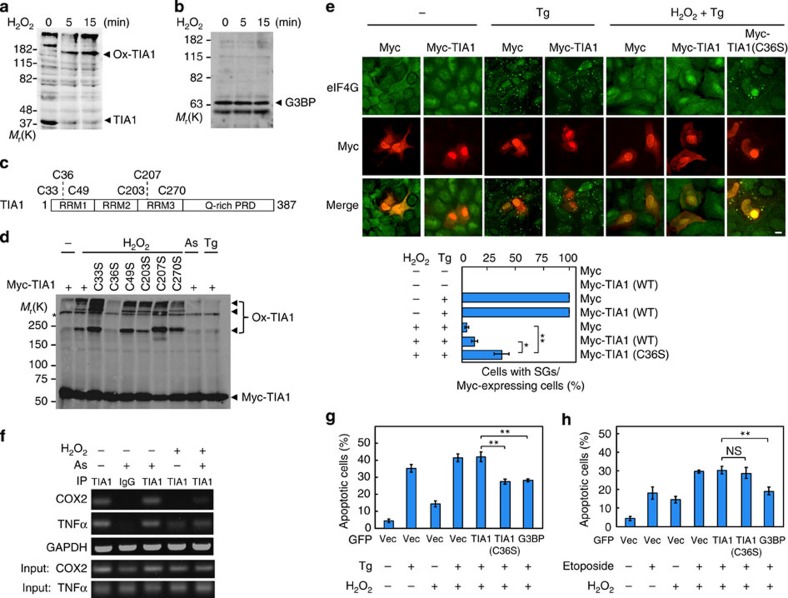
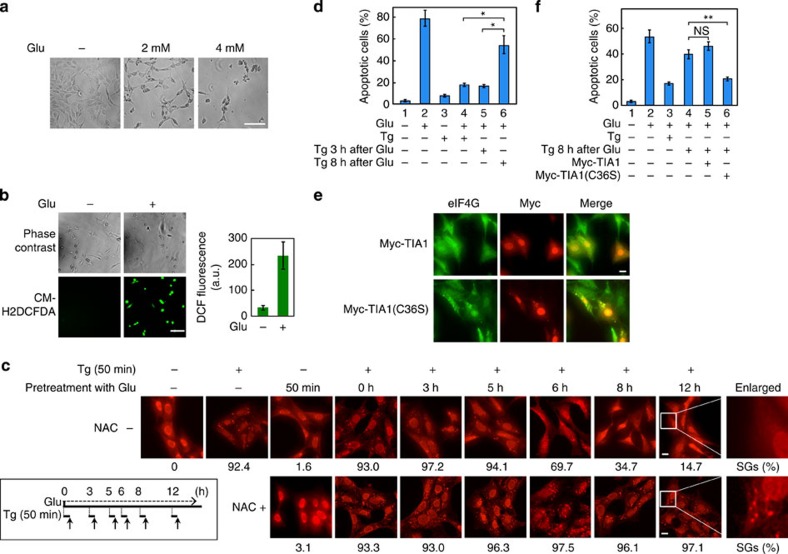
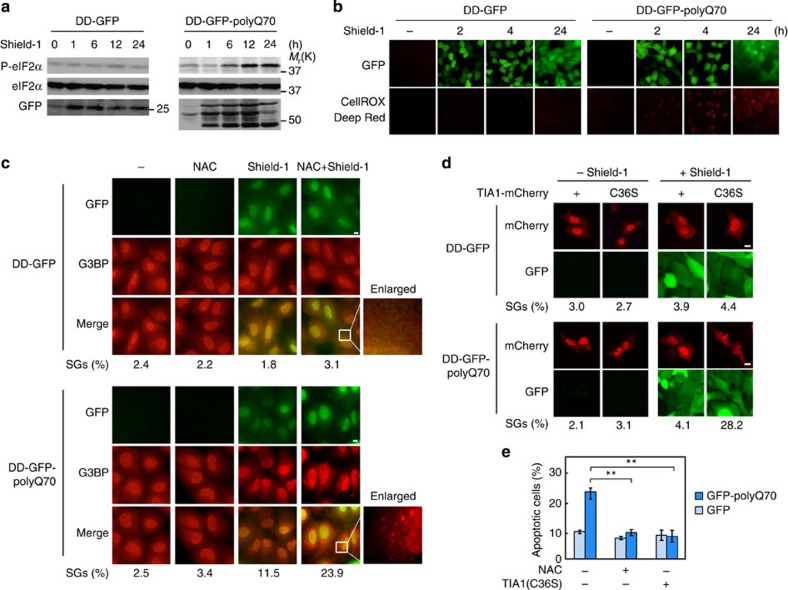
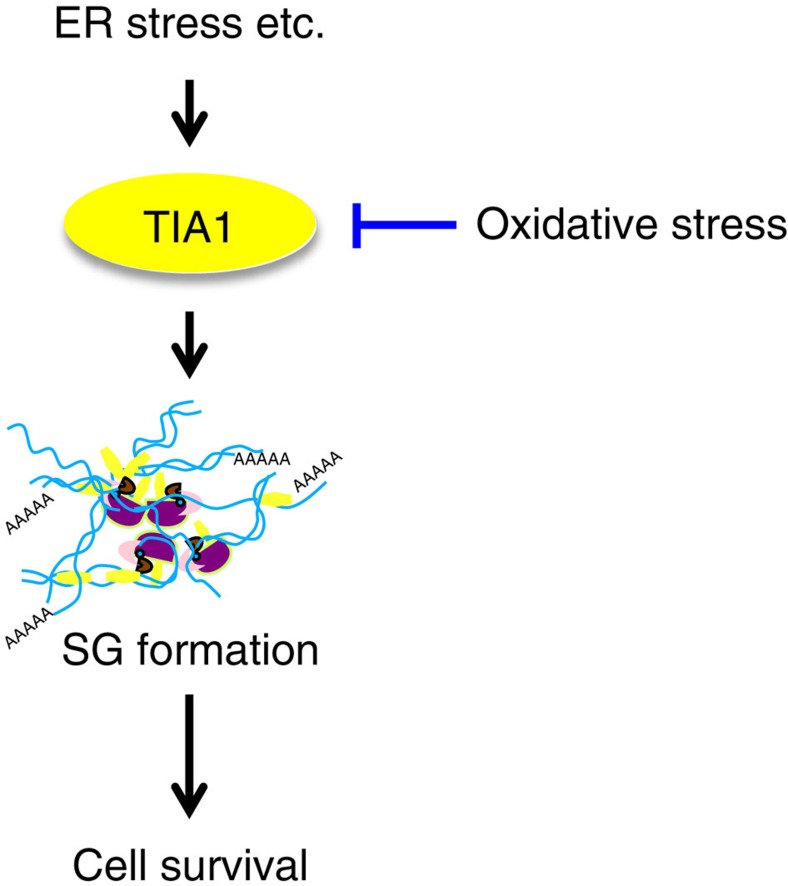
Cytoplasmic stress granules (SGs) are multimolecular aggregates of stalled translation pre-initiation complexes that prevent the accumulation of misfolded proteins, and that are formed in response to certain types of stress including ER stress. SG formation contributes to cell survival not only by suppressing translation but also by sequestering some apoptosis regulatory factors. Because cells can be exposed to various stresses simultaneously in vivo, the regulation of SG assembly under multiple stress conditions is important but unknown. Here we report that reactive oxygen species (ROS) such as H2O2 oxidize the SG-nucleating protein TIA1, thereby inhibiting SG assembly. Thus, when cells are confronted with a SG-inducing stress such as ER stress caused by protein misfolding, together with ROS-induced oxidative stress, they cannot form SGs, resulting in the promotion of apoptosis. We demonstrate that the suppression of SG formation by oxidative stress may underlie the neuronal cell death seen in neurodegenerative diseases.


Figures

Figure 1
Figure 1. H2O2 inhibits SG formation.
(ac) U2OS cells were treated with the indicated concentration of H2O2, 1 μM thapsigargin (Tg) or 0.5 mM arsenite (As) for 50 min, and SGs were visualized by G3BP immunofluorescence (a) and the percentage of cells containing SGs was determined (b). Error bars indicate s.e.m. (n=3). **P<0.01, Student's t-test. In c, phosphorylated eIF2α was probed with phospho-eIF2α antibody (upper row). eIF2α protein expression level is shown (lower row). (d) U2OS cells were treated with 1 μM Tg together with the indicated concentration of H2O2 for 50 min. TIA1 and eIF4G were visualized by immunofluorescence and the percentage of cells containing SGs was determined. (e,f) U2OS cells were treated with 1 μM Tg either alone, 20 min after 200 μM H2O2 or simultaneously with H2O2, or were treated with H2O2 20 min after Tg. Fifty minutes after Tg treatment SGs were visualized with two SG markers, G3BP (red) and eIF4E (green) (e). Phosphorylation level of eIF2α was assessed by immunoblotting using anti-phospho-eIF2α antibody (f). *A nonspecific band. Scale bars, 10 μm.
Figure 2
Figure 2. TIA1-Cys36 is oxidized by H2O2 and SG formation is suppressed.
(a,b) COS cells were stimulated with 1 mM H2O2 for the indicated times and cell extracts were prepared under non-reducing conditions. (a) Endogenous TIA1 was probed by immunoblotting using anti-TIA1 antibody. Ox-TIA1, oxidized TIA1. (b) Endogenous G3BP was probed with anti-G3BP antibody. (c) Schematic structure of the TIA1 protein. PRD, prion-related domain. (d) Myc-tagged TIA1 point mutants were transiently transfected into U2OS cells. After 36 h, the cells were treated with 1 mM H2O2, 0.5 mM As or 1 μM Tg for 50 min. Cell extracts were prepared and Myc-TIA1 was probed with anti-Myc antibody under non-reducing conditions. (e) U2OS cells were transiently transfected as indicated. After 36 h, cells were treated with 1 μM Tg either alone or simultaneously with 200 μM H2O2 for 50 min. Myc-TIA1 and endogenous eIF4G were visualized by immunofluorescence. Scale bar, 10 μm. The percentage of Myc-expressing cells containing SGs was determined and is shown in the graph. Error bars indicate s.e.m. (n=4). *P<0.02, **P<0.01, Student's t-test. (f) U2OS cells were treated with 200 μM H2O2 and 0.5 mM as indicated, and were incubated for 50 min. A RIP assay was performed using anti-TIA1 antibody with rabbit IgG as a negative control. (g,h) Apoptosis induced by Tg was suppressed in cells expressing TIA1(C36S). U2OS cells were transfected as indicated (Vec, vector) and were cultured for 36 h. Cells were then treated with 10 μM Tg and/or 200 μM H2O2 (g) or with 50 μM Etoposide and/or 200 μM H2O2 (h) for another 20 h. To assess apoptosis, cells were stained with Annexin V-Cy3 and visualized by fluorescence microscopy. The number of red-positive apoptotic cells per GFP-positive green cells was determined. About 500 GFP-expressing cells were scored to calculate the percentage of apoptotic cells. Error bars indicate s.e.m. (n=4). **P<0.01. NS, not significant, Student's t-test.
Figure 3
Figure 3. TIA1(C36S) expression restores SG formation under oxidative stress conditions and suppresses apoptosis in HT22 cells.
(a) HT22 cells were treated with the indicated concentrations of Glu for 24 h. Cell morphology was examined by phase contrast microscopy. (b) HT22 cells were incubated with 4 mM Glu for 6 h. ROS production was visualized by fluorescence microscopy using the ROS probe, CM-H2DCFDA (lower panels). The 2′,7′-dichlorodihydrofluorescein (DCF) fluorescence intensity (a.u.) was measured for >200 cells and is shown in the graph (right). Error bars indicate s.e.m. (n=3). (c) HT22 cells were treated with 0.2 μM Tg and 4 mM Glu as indicated. Tg was added either 3, 5, 6, 8 or 12 h after Glu treatment, and SGs were visualized after another 50-min incubation by fluorescence analysis of endogenous G3BP (upper panels). NAC (5 mM) was added to the medium 20 min before Glu treatment (lower panels). (d) HT22 cells were treated with 0.2 μM Tg and 4 mM Glu as indicated. Twenty hours after Glu treatment, apoptosis was assayed by staining with Annexin V-Cy3 and visualized by fluorescence microscopy. Error bars indicate s.e.m. (n=3). *P<0.02, Student's t-test. (e) HT22 cells were transfected with either Myc-TIA1 or Myc-TIA1(C36S) and were incubated for 36 h. Cells were then treated with 4 mM Glu and, after 8 h incubation, were treated with 0.2 μM Tg for another 50 min. SGs and Myc-tagged TIA1 were analysed by immunofluorescence microscopy using anti-eIF4G and anti-Myc antibodies, respectively. (f) HT22 cells, HT22-Myc-TIA1 or HT22-Myc-TIA1(C36S) stable cell lines were treated with 4 mM Glu and 0.2 μM Tg as indicated. Twenty hours after Glu treatment, apoptosis was measured as in d. Error bars indicate s.e.m. (n=3). **P<0.01, Student's t-test. Scale bars, 100 μm (a,b) or 10 μm (c,e).
Figure 4
Figure 4. TIA1(C36S) promotes SG formation and suppresses apoptosis in polyQ70-expressing cells.
(a) U2OS cells stably expressing DD-GFP or DD-GFP-polyQ70 were exposed to 1 μM Shield-1 for the indicated times. Phosphorylated (top) and total (middle) eIF2α in cell lysates were assessed in immunoblotting with specific antibodies. Expression of GFP or GFP-polyQ70 was determined by immunoblotting with an anti-GFP antibody (bottom rows). (b) U2OS cells stably expressing DD-GFP or DD-GFP-polyQ70 were exposed to Shield-1 for 2, 4 or 24 h. ROS production was visualized by fluorescence microscopy using the CellROX Deep Red reagent. (c) U2OS cells stably expressing DD-GFP (upper panels) or DD-GFP-polyQ70 (lower panels) were treated with NAC, Shield-1 or with both simultaneously as indicated and were incubated for 24 h. GFP expression was detected by fluorescence and endogenous G3BP was visualized by immunofluorescence using anti-G3BP antibody. The percentage of the cells containing SGs was determined and is shown below. (d) U2OS cells expressing DD-GFP or DD-GFP-polyQ70 were transfected with mCherry-fusion TIA1 as indicated. Cells were incubated for 24 h and exposed to Shield-1 for 24 h. GFP (green) and mCherry (red) fusion proteins were detected by fluorescence. The percentage of mCherry-expressing cells that contained SGs was determined. (e) HEK293 cells transfected with GFP or GFP-polyQ70 were co-transfected with or without TIA1(C36S) as indicated. Twenty four hours after transfection, the medium was replaced with fresh media, with or without NAC, and the cells were incubated for another 4 days. Apoptosis of GFP-positive cells was assessed by Annexin V staining. Error bars indicate s.e.m. (n=3). **P<0.01, Student's t-test. Scale bars, 10 μm.
Figure 5
Figure 5. Oxidative stress suppresses SG assembly.
When cells are exposed to ER stress, SGs are assembled mainly through homo-oligomerization of TIA1. SG formation is a major adaptive defence mechanism to protect cells from apoptosis. When cells are simultaneously exposed to ER stress and oxidative stress, TIA1 is oxidized and loses its ability to mediate SG formation, resulting in the promotion of apoptosis.

References

    1. Anderson P. & Kedersha N. RNA granules: post-transcriptional and epigenetic modulators of gene expression. Nat. Rev. Mol. Cell Biol. 10, 430–436 (2009) . - PubMed
    1. Buchan J. R. & Parker R. Eukaryotic stress granules: the ins and outs of translation. Mol. Cell 36, 932–941 (2009) . - PMC - PubMed
    1. von Roretz C., Di Marco S., Mazroui R. & Gallouzi I. E. Turnover of AU-rich-containing mRNAs during stress: a matter of survival. Wiley Interdiscip. Rev. RNA 2, 336–347 (2011) . - PubMed
    1. Gilks N. et al. Stress granule assembly is mediated by prion-like aggregation of TIA-1. Mol. Biol. Cell 15, 5383–5398 (2004) . - PMC - PubMed
    1. Tourriere H. et al. The RasGAP-associated endoribonuclease G3BP assembles stress granules. J. Cell Biol. 160, 823–831 (2003) . - PMC - PubMed

Publication types