. 2016 Jan 6;90(6):3160-72.
doi: 10.1128/JVI.03036-15.

Activation of RNase L by Murine Coronavirus in Myeloid Cells Is Dependent on Basal Oas Gene Expression and Independent of Virus-Induced Interferon

Affiliations

Activation of RNase L by Murine Coronavirus in Myeloid Cells Is Dependent on Basal Oas Gene Expression and Independent of Virus-Induced Interferon

L Dillon Birdwell et al. J Virol. .

Abstract

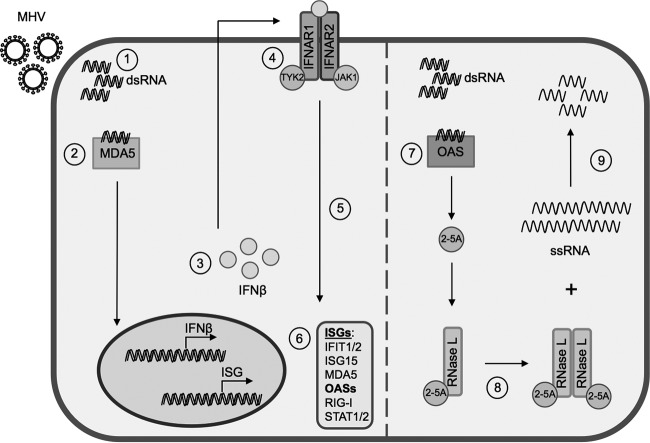
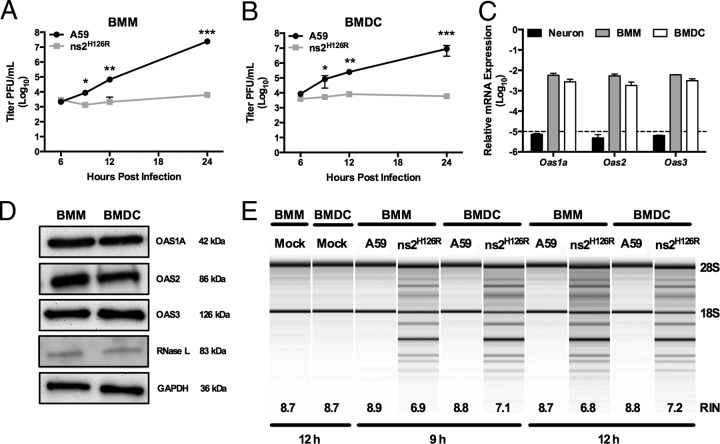
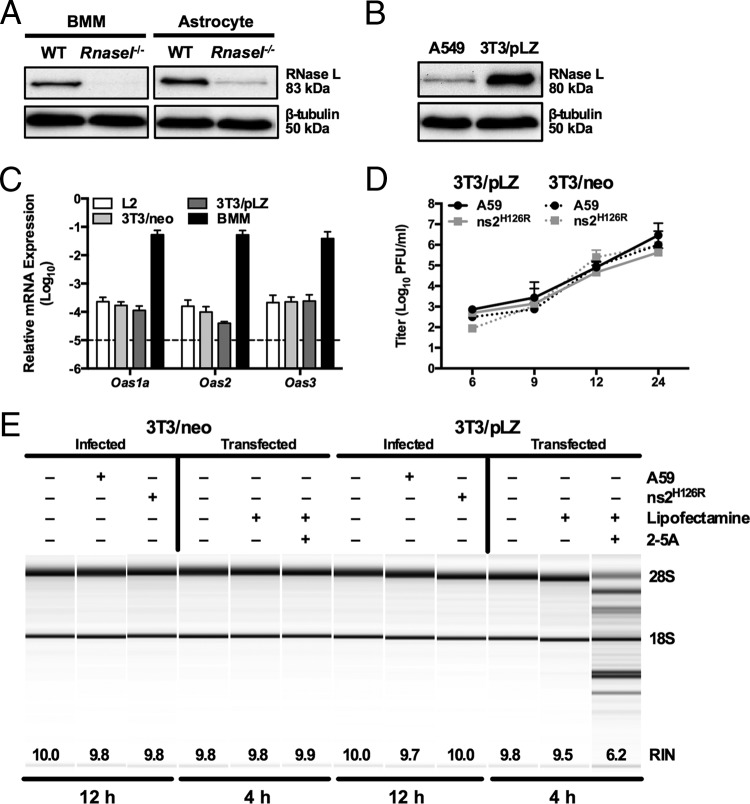
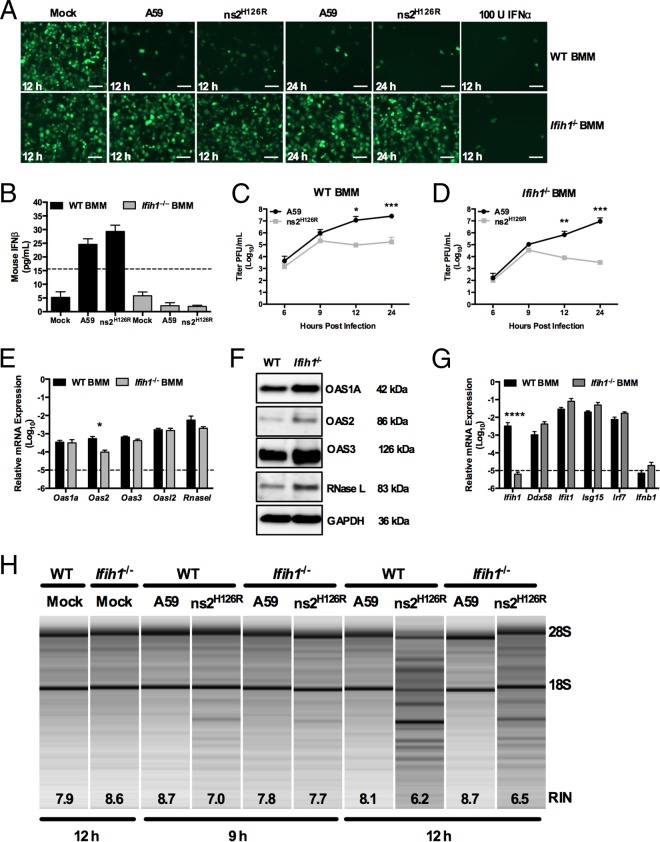
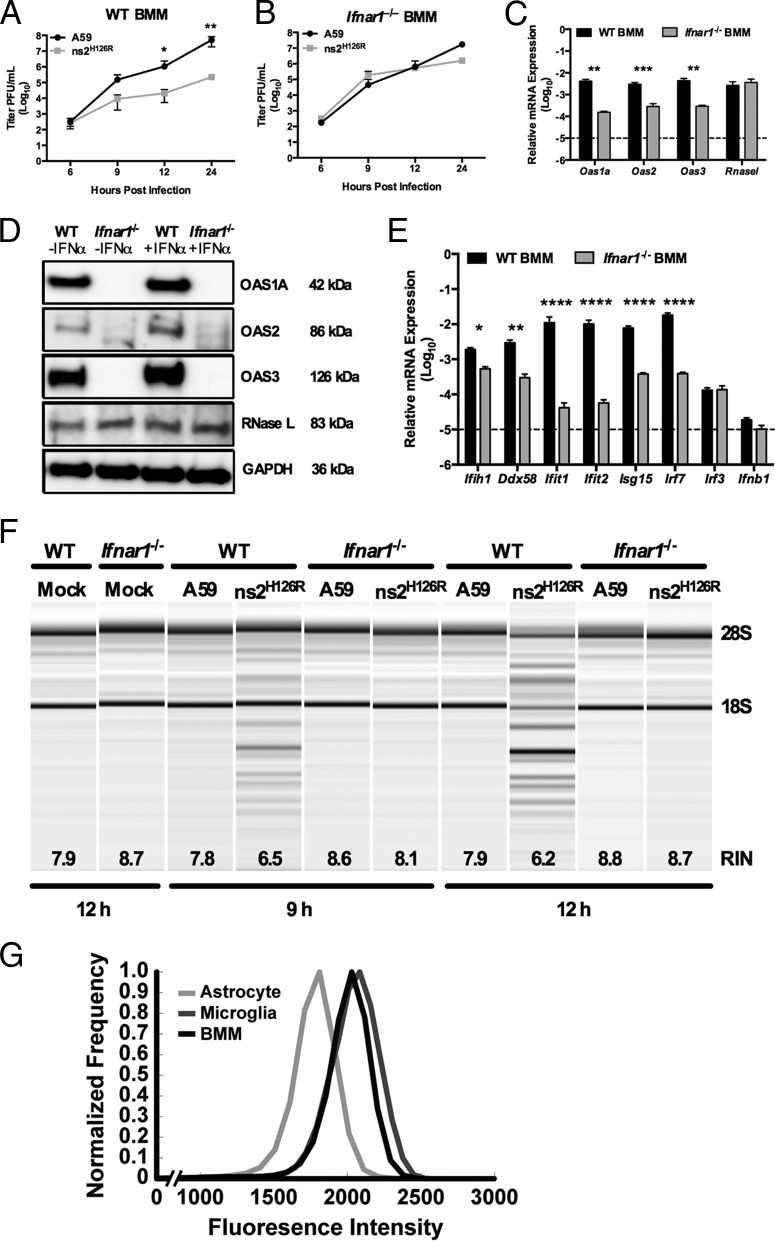
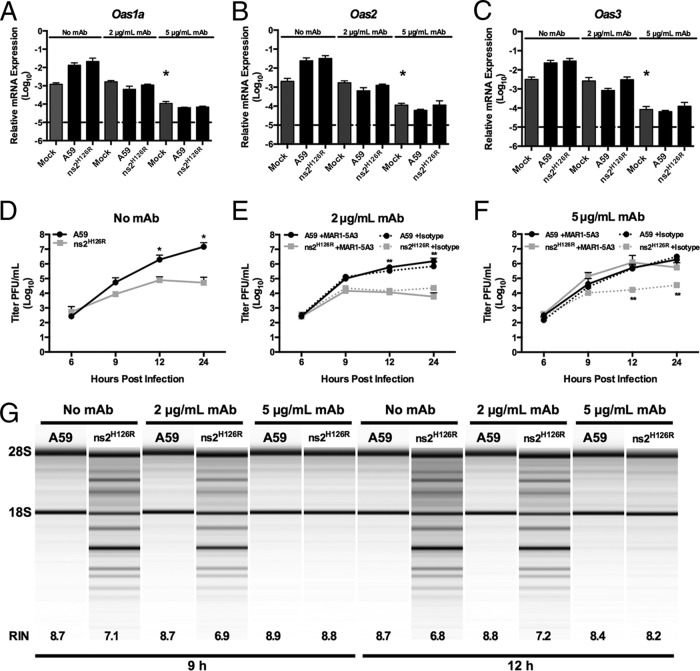
The oligoadenylate synthetase (OAS)-RNase L pathway is a potent interferon (IFN)-induced antiviral activity. Upon sensing double-stranded RNA, OAS produces 2',5'-oligoadenylates (2-5A), which activate RNase L. Murine coronavirus (mouse hepatitis virus [MHV]) nonstructural protein 2 (ns2) is a 2',5'-phosphodiesterase (PDE) that cleaves 2-5A, thereby antagonizing RNase L activation. PDE activity is required for robust replication in myeloid cells, as a mutant of MHV (ns2(H126R)) encoding an inactive PDE fails to antagonize RNase L activation and replicates poorly in bone marrow-derived macrophages (BMM), while ns2(H126R) replicates to high titer in several types of nonmyeloid cells, as well as in IFN receptor-deficient (Ifnar1(-/-)) BMM. We reported previously that myeloid cells express significantly higher basal levels of OAS transcripts than nonmyeloid cells. Here, we investigated the contributions of Oas gene expression, basal IFN signaling, and virus-induced IFN to RNase L activation. Infection with ns2(H126R) activated RNase L in Ifih1(-/-) BMM to a similar extent as in wild-type (WT) BMM, despite the lack of IFN induction in the absence of MDA5 expression. However, ns2(H126R) failed to induce RNase L activation in BMM treated with IFNAR1-blocking antibody, as well as in Ifnar1(-/-) BMM, both expressing low basal levels of Oas genes. Thus, activation of RNase L does not require virus-induced IFN but rather correlates with adequate levels of basal Oas gene expression, maintained by basal IFN signaling. Finally, overexpression of RNase L is not sufficient to compensate for inadequate basal OAS levels.

Importance: The oligoadenylate synthetase (OAS)-RNase L pathway is a potent antiviral activity. Activation of RNase L during murine coronavirus (mouse hepatitis virus [MHV]) infection of myeloid cells correlates with high basal Oas gene expression and is independent of virus-induced interferon secretion. Thus, our data suggest that cells with high basal Oas gene expression levels can activate RNase L and thereby inhibit virus replication early in infection upon exposure to viral double-stranded RNA (dsRNA) before the induction of interferon and prior to transcription of interferon-stimulated antiviral genes. These findings challenge the notion that activation of the OAS-RNase L pathway requires virus to induce type I IFN, which in turn upregulates OAS gene expression, as well as to provide dsRNA to activate OAS. Our data further suggest that myeloid cells may serve as sentinels to restrict viral replication, thus protecting other cell types from infection.


Figures

FIG 1
FIG 1
OAS-RNase L pathway. (Left) Interferon induction and signaling. Viral dsRNA is produced during virus replication (1) and sensed by PRRs, such as MDA5 (2), initiating a signaling pathway leading to transcription, translation, and secretion of IFN-α/β (3). Autocrine and paracrine IFN signaling through the interferon receptor (IFNAR1) (4) stimulates the expression of ISGs (5 and 6). (Right) RNase L activation. (7) OASs sense viral dsRNA and synthesize 2-5A. (8) 2-5A binds to RNase L, inducing its dimerization and subsequent activation. (9) RNase L degrades RNA.
FIG 2
FIG 2
Activation of RNase L by ns2H126R during infection of BMM and BMDC cultures. (A and B) BMM (A) and BMDC (B) cultures were infected with A59 or ns2H126R (1 PFU/cell), and at the times indicated, the virus titer was determined by plaque assay of the supernatant. The data are pooled from two independent experiments carried out in triplicate and are shown as means ± standard errors of the mean (SEM). *, P < 0.05; **, P < 0.01; ***, P < 0.001. (C) RNA was extracted from infected BMM, BMDC, and neuron cultures, and Oas1a, Oas2, and Oas3 mRNA expression was quantified by qRT-PCR. mRNA expression levels relative to β-actin mRNA are expressed as 2−ΔCT, where ΔCT is equal to CT Target Gene minus CT β-actin. The dashed line indicates the lower limit of detection. The data are from one representative experiment of two, each performed in triplicate. (D) Protein lysates from BMM and BMDC were electrophoresed in acrylamide gels and then probed with antibodies against OAS1A, OAS2, OAS3, RNase L (MAb), and GAPDH. (E) RNA was extracted from infected BMM and BMDC cultures at 9 and 12 h postinfection, as well as cultures 12 h post-mock infection, and rRNA degradation was assessed with a bioanalyzer. RIN values (45), a measurement of RNA integrity produced by the bioanalyzer, are also indicated. The positions of 28S and 18S rRNAs are indicated.
FIG 3
FIG 3
Overexpression of RNase L is not sufficient to overcome low OAS levels to promote RNase L degradation. (A) Proteins were extracted from WT and Rnasel−/− BMM and astrocytes, electrophoresed in polyacrylamide gels, and probed by Western blotting with antibodies directed against RNase L (rabbit polyclonal) and β-tubulin. BMM and astrocyte lysates were electrophoresed on the same gel and blot; intervening lanes were removed and replaced by spaces between samples. (B) Proteins were extracted from human A549 and murine 3T3/pLZ cells, electrophoresed in polyacrylamide gels, and probed by Western blotting with antibodies directed against human RNase L and human β-tubulin. (C) RNA was extracted from L2, 3T3/pLZ, 3T3/neo, and BMM cultures, and basal expression levels of Oas mRNAs were quantified by qRT-PCR. mRNA expression levels relative to β-actin mRNA are expressed as 2−ΔCT, where ΔCT is equal to CT Target Gene minus CT β-actin. The data are from one representative experiment of two (except for pLZ/neo mRNA), each performed in triplicate. The dashed line indicates the lower limit of detection. The error bars indicate SEM. (D) 3T3/pLZ and 3T3/neo cells were infected with A59 or ns2H126R (1 PFU/cell), and at the times indicated, the virus titer was determined by plaque assay of the supernatant. The data are pooled from two independent experiments (3T3/pLZ) or from one experiment (3T3/neo), each performed in triplicate. (E) 3T3/pLZ and 3T3/neo cells were mock infected or infected with A59 or ns2H126R (1 PFU/cell), and at 12 h postinfection, the cells were lysed and RNA was extracted. In a separate experiment, cells were transfected with 10 μM 2-5A in Lipofectamine or with Lipofectamine alone or were left untreated, and 4 h later, the cells were lysed and RNA was extracted. rRNA degradation was assessed with a bioanalyzer. 28S and 18S rRNAs are indicated.
FIG 4
FIG 4
Infection of Ifih1−/− macrophages with A59 and ns2H126R. (A) WT or Ifih1−/− BMM cultures were either mock infected or infected with A59 or ns2H126R (1 PFU/cell). At 12 h postinfection, the supernatants were treated with UV light to inactivate the virus and incubated with L2 mouse fibroblasts for 24 h, followed by infection with NDV-GFP (1 PFU/cell). As a positive control, L2 cells were treated with IFN-α for 24 h and then infected with NDV-GFP. At 12 or 24 h postinfection, the cells were fixed and examined for EGFP expression by microscopy. The scale bars represent 50 μm. (B) Supernatants taken at 12 h postinfection from the same mock-infected or A59- and ns2H126R-infected WT and Ifih1−/− BMM cultures were analyzed by ELISA for mouse IFN-β with a VeriKine kit. The limit of detection is indicated by the dashed line. The data are from one representative experiment of two. (C and D) WT BMM (C) and Ifih1−/− BMM (D) cultures were infected with A59 and ns2H126R (1 PFU/cell), and at the times indicated, the virus titer was determined by plaque assay of the supernatant. The data are pooled from two independent experiments performed in triplicate and are shown as means ± SEM. *, P < 0.05; **, P < 0.01; ***, P < 0.001. (E and G) mRNA expression levels relative to β-actin mRNA are expressed as 2−ΔCT, where ΔCT is equal to CT Target Gene minus CT β-actin. The dashed lines indicate the lower limit of detection. The data shown are pooled from two independent experiments, each performed in triplicate, and are shown as means and SEM. *, P < 0.05; ****, P < 0.0001. (F) Proteins were extracted from WT and Ifih1−/− BMM and probed by Western blotting with antibodies directed against OAS1A, OAS2, OAS3, RNase L (MAb), and GAPDH. (H) RNA was extracted from infected WT and Ifih1−/− BMM cultures at 9 and 12 h postinfection, as well as cultures 12 h post-mock infection, and rRNA degradation was assessed with a bioanalyzer. 28S and 18S rRNAs are indicated.
FIG 5
FIG 5
RNase L is not activated during infection of Ifnar1−/− macrophages. (A and B) WT (A) and Ifnar1−/− (B) BMM cultures were infected with A59 or ns2H126R (1 PFU/cell), and at the times indicated, the virus titer was determined by plaque assay of the supernatant. The data are pooled from two independent experiments performed in triplicate and are shown as means ± SEM. *, P < 0.05; **, P < 0.01. (C) RNA was extracted from uninfected WT and Ifnar1−/− BMM cultures, and Oas1a, Oas2, Oas3, and Rnasel mRNAs were quantified by qRT-PCR. mRNA expression levels relative to β-actin mRNA are expressed as 2−ΔCT, where ΔCT is equal to CT Target Gene minus CT β-actin. The dashed line indicates the lower limit of detection. The data are pooled from two independent experiments, each performed in triplicate, and are shown as means and SEM. **, P < 0.01; ***, P < 0.001. (D) WT and Ifnar1−/− BMM cultures were either mock treated or treated with 100 U/ml of universal IFN-α for 4 h; protein was extracted, electrophoresed in polyacrylamide gels, and probed with antibodies directed against OAS1A, OAS2, OAS3, RNase L (MAb), and GAPDH. (E) RNA was extracted from uninfected WT and Ifnar1−/− BMM cultures, and ISG mRNAs were quantified by qRT-PCR. mRNA expression levels relative to β-actin mRNA are expressed as 2−ΔCT, where ΔCT is equal to CT Target Gene minus CT β-actin. The dashed line indicates the lower limit of detection. The data are pooled from three independent experiments, each performed in triplicate, and are shown as means and SEM. *, P < 0.05; **, P < 0.01; ****, P < 0.0001. (F) RNA was extracted from BMM cultures at 9 and 12 h postinfection, as well as from cultures 12 h post-mock infection, and rRNA degradation was assessed with a bioanalyzer. 28S and 18S rRNAs are indicated. (G) Astrocytes and microglia from mixed glial cultures and macrophages from bone marrow-derived cultures were stained with cell-type-specific antibodies, as well as for IFNAR1, and analyzed by flow cytometry with an LSR II (Becton Dickinson), and the resulting data were analyzed using FlowJo software (Treestar). Astrocytes (GFAP+ CD11b F4/80), microglia (GFAP CD11b+ F4/80+), and macrophages (GFAP CD11b+ F4/80+) were assessed for surface expression of IFNAR1. The data are from one representative experiment of two, each performed with triplicate cultures of each cell type.
FIG 6
FIG 6
Activation of RNase L activity in BMM treated with IFNAR1-blocking MAR1-5A3 MAb. WT BMM were treated with 2 μg/ml or 5 μg/ml MAR1-5A3 IFNAR1-blocking MAb or no MAb or with isotype control Ab (panels E and F only) for 1 h before infection with A59 or ns2H126R (1 PFU/cell) or mock infection. RNA was extracted from the cells at time zero post-mock infection and 12 h post-virus infection. (A to C) Expression levels of Oas1a (A), Oas2 (B), and Oas3 (C) mRNAs were quantified by qRT-PCR. The levels of mRNA expression relative to β-actin mRNA are expressed as 2−ΔCT, where ΔCT is equal to CT Target Gene minus CT β-actin. The dashed lines indicate the lower limit of detection. The data are pooled from two independent experiments, each performed in triplicate, and are shown as means and SEM. The values for mock-infected, 5 μg/ml MAb-treated cells are significantly different from those for mock-infected, 0 MAb- or 2 μg/ml MAb-treated cells, *, P < 0.05. (D to F) Virus titers of supernatants from A59- or ns2H126R-infected BMM cultures pretreated with no MAb (D), 2 μg/ml IFNAR1-blocking MAb (solid lines) or istoype control Ab (dotted lines) (E), and 5 μg/ml of IFNAR1 blocking MAb (solid lines) or istotype control Ab (dotted lines) (F) were determined by plaque assay. The data are pooled from three independent experiments (except for isotype control-treated cells, which were assayed one time), each performed in triplicate, and are shown as means and SEM. *, P < 0.05; **, P < 0.01. (G) RNA was extracted at 9 and 12 h postinfection from BMM cultures that had been pretreated with MAb as indicated, and rRNA degradation was assessed with a bioanalyzer. 28S and 18S rRNAs are indicated. RNA from mock-infected cultures appeared similar to that from A59-infected cells (not shown), as in Fig. 2E, 3E, 4H, and 5F.

References

    1. Navas-Martin S, Weiss SR. 2003. SARS: lessons learned from other coronaviruses. Viral Immunol 16:461–474. doi:10.1089/088282403771926292. - DOI - PubMed
    1. Zhao L, Rose KM, Elliott R, Van Rooijen N, Weiss SR. 2011. Cell-type-specific type I interferon antagonism influences organ tropism of murine coronavirus. J Virol 85:10058–10068. doi:10.1128/JVI.05075-11. - DOI - PMC - PubMed
    1. Lavi E, Gilden DH, Wroblewska Z, Rorke LB, Weiss SR. 1984. Experimental demyelination produced by the A59 strain of mouse hepatitis virus. Neurology 34:597–603. doi:10.1212/WNL.34.5.597. - DOI - PubMed
    1. Marten NW, Stohlman SA, Atkinson RD, Hinton DR, Fleming JO, Bergmann CC. 2000. Contributions of CD8+ T cells and viral spread to demyelinating disease. J Immunol 164:4080–4088. doi:10.4049/jimmunol.164.8.4080. - DOI - PubMed
    1. Marten NW, Stohlman SA, Bergmann CC. 2001. MHV infection of the CNS: mechanisms of immune-mediated control. Viral Immunol 14:1–18. doi:10.1089/08828240151061329. - DOI - PubMed

Publication types

Substances