. 2016 Jan 7:7:10256.
doi: 10.1038/ncomms10256.

Label-free cell cycle analysis for high-throughput imaging flow cytometry

Affiliations

Label-free cell cycle analysis for high-throughput imaging flow cytometry

Thomas Blasi et al. Nat Commun. .

Abstract

Imaging flow cytometry combines the high-throughput capabilities of conventional flow cytometry with single-cell imaging. Here we demonstrate label-free prediction of DNA content and quantification of the mitotic cell cycle phases by applying supervised machine learning to morphological features extracted from brightfield and the typically ignored darkfield images of cells from an imaging flow cytometer. This method facilitates non-destructive monitoring of cells avoiding potentially confounding effects of fluorescent stains while maximizing available fluorescence channels. The method is effective in cell cycle analysis for mammalian cells, both fixed and live, and accurately assesses the impact of a cell cycle mitotic phase blocking agent. As the same method is effective in predicting the DNA content of fission yeast, it is likely to have a broad application to other cell types.


Conflict of interest statement

Although the software described is completely open-source, a provisional patent application has been filed relating to the method proposed in this manuscript.

Figures

Figure 1
Figure 1. Label-free imaging flow cytometry workflow.
First the brightfield and darkfield images of the cells are measured by an imaging flow cytometer. The brightfield and darkfield images depict the light transmitted through the cell and light scattered from the cells within a cone centered at a 90° angle, respectively. Then the images are preprocessed, where we reshape the images to have their sizes coincide and tile them to montages of 15 × 15 images. The montages are loaded into the open-source image software CellProfiler that we use to segment the cells' brightfield images and to extract morphological features from the images. Finally, we apply supervised machine learning such as classification. For this purpose we need an annotated set of cells where the actual cell state is known to train the classifier and to test its predictive power. Once the classifier is trained it is used to predict the state of unlabelled cells and to digitally sort the cells into bins.
Figure 2
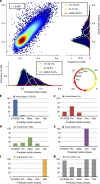
Figure 2. Machine learning allows for robust label-free prediction of DNA content and cell cycle phases of Jurkat cells.
(a) We find a Pearson's correlation of r=0.896±0.007 (error bars indicate the s.d. obtained via 10-fold cross-validation) between actual DNA content and predicted DNA content based on regression using brightfield and darkfield morphological features only (see Methods section). We used the Watson pragmatic curve fitting algorithm to specify the fraction of cells in the G1, S and G2 phases. (bf) For cells that are actually in a particular phase (for example, b shows cells in G1/S/G2), the bar plots show the classification results based on brightfield and darkfield morphological features only (for example, b shows that the few cells in prophase (Pro), metaphase (Meta), anaphase (Ana), and telophase (Telo) are errors). (g) Bar plot of the true positive rates of the cell cycle classification.
Figure 3
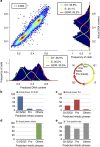
Figure 3. Label-free prediction of DNA content and cell cycle phases for fixed Jurkat cells treated with a prophase blocking agent.
(a) Based only on brightfield and darkfield features, we find a Pearson's correlation of r=0.894±0.032 (error bars indicate the s.d. obtained via 10-fold cross-validation) between actual DNA content and predicted DNA content using regression (see Methods section). We applied the Watson pragmatic algorithm to determine the G1, S and G2/M phases in the DNA histograms. (bd) For cells that are actually in a particular phase (for example, b shows cells in G1/S/G2), the bar plots show the classification results (see Methods section) (for example, b shows that the few cells in prophase (Pro) and the other mitotic phases (others) are errors). Note that we grouped the cells in metaphase, anaphase and telophase into one class since we only detected very little cells in those phases after treatment with the prophase blocking agent. (e) Bar plot of the true positive rates of the cell cycle classification. Using boosting with random undersampling to compensate for class imbalances, we obtain true positive rates of 65.5±6.3% (P), 85.8±1.4% (G1/S/G2) and 100% (others).
Figure 4
Figure 4. Label-free prediction of DNA content for live Jurkat cells and detection of a phase blockage.
(a) Supervised machine learning (trained using live cells stained with DRAQ5 to determine the DNA content) allows for robust label-free prediction of the DNA content of live cells based only on brightfield and darkfield images. We find a Pearson correlation of r=0.786±0.010 (error bars indicate the s.d. obtained via 10-fold cross-validation) between actual DNA content and predicted DNA content using regression (see Methods section). We believe this reduction in correlation from the value of 0.896 obtained for fixed cells to be a consequence of the greater variability of the uptake of the live DNA dye compared with the staining achieved with fixed cells. Despite the reduction in correlation a value of 0.786 is still high enough to make this a viable method for the cell cycle analysis of live cells. As previously, we determine the fraction of cells in the G1, S and G2/M phases using the Watson pragmatic curve fitting algorithm. (b) We predict an increase of 13.4% in the G2/M phase after the cells were treated with 50μM Nocodazole, which is in good agreement with the average increase of 19.0±11.0% in G2/M as was found for three independent cell populations under the same treatment (Supplementary Figure 3). The phase-blocked data set was not labelled with any marker. Instead, we trained our machine learning algorithm on the untreated data set, which was labelled with a DRAQ5 DNA stain (see a) and used the trained machine learning algorithm to predict the DNA stain of the blocked cells.
Figure 5
Figure 5. Label-free prediction of DNA content and cell cycle phases for fission yeast cells.
(a) Based only on brightfield and darkfield features, we find a Pearson's correlation of r=0.855±0.006 (error bars indicate the s.d. obtained via 10-fold cross-validation) between actual DNA content and predicted DNA content using regression (see Methods section). Note that the fission yeast cell cycle is different from the Jurkat cell cycle since the two daughter cells divide between the S and G2 phases (and not at the end of M phase as is the case for Jurkat cells). (be) For cells that are actually in a particular phase (for example, b shows cells in G1), the bar plots show the classification results (see Methods section) (for example, b shows that the cells in S, G2 and M are errors). (f) Bar plot of the true positive rates of the cell cycle classification. Using boosting with random undersampling to compensate for class imbalances, we obtain true positive rates of 70.2±2.2% (G1), 90.1±1.1% (S), 96.8±0.3% (G2) and 44.0±8.4 (M).

References

    1. Brown M. & Wittwer C. Flow cytometry: principles and clinical applications in hematology. Clin. Chem. 46, 1221–1229 (2000) . - PubMed
    1. Darzynkiewicz Z. & Huang X. Analysis of cellular DNA content by flow cytometry. Curr. Protoc. Immunol. 5, 7 (2004) . - PubMed
    1. Hans F. & Dimitrov S. Histone H3 phosphorylation and cell division. Oncogene 20, 3021–3027 (2001) . - PubMed
    1. Sakaue-Sawano A. et al. Visualizing spatiotemporal dynamics of multicellular cell-cycle progression. Cell 132, 487–498 (2008) . - PubMed
    1. Chen et al. DNA minor groove-binding ligands: a different class of mammalian DNA topoisomerase inhibitors. Proc. Natl Acad. Sci. USA 9, 8131–8135 (1993) . - PMC - PubMed

Publication types