

Anonymisation of geographical distance matrices via Lipschitz embedding
- PMID: 26739310
- PMCID: PMC4704375
- DOI: 10.1186/s12942-015-0031-7
Anonymisation of geographical distance matrices via Lipschitz embedding
Abstract
Background: Anonymisation of spatially referenced data has received increasing attention in recent years. Whereas the research focus has been on the anonymisation of point locations, the disclosure risk arising from the publishing of inter-point distances and corresponding anonymisation methods have not been studied systematically.
Methods: We propose a new anonymisation method for the release of geographical distances between records of a microdata file--for example patients in a medical database. We discuss a data release scheme in which microdata without coordinates and an additional distance matrix between the corresponding rows of the microdata set are released. In contrast to most other approaches this method preserves small distances better than larger distances. The distances are modified by a variant of Lipschitz embedding.
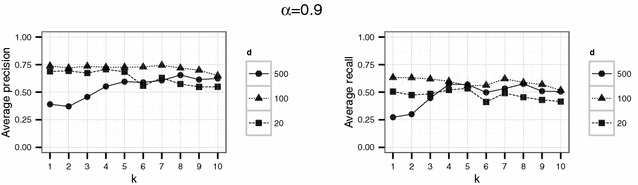
Results: The effects of the embedding parameters on the risk of data disclosure are evaluated by linkage experiments using simulated data. The results indicate small disclosure risks for appropriate embedding parameters.
Conclusion: The proposed method is useful if published distance information might be misused for the re-identification of records. The method can be used for publishing scientific-use-files and as an additional tool for record-linkage studies.
Figures


Similar articles
-
Preventing Unintended Disclosure of Personally Identifiable Data Following Anonymisation.Stud Health Technol Inform. 2017;235:313-317. Stud Health Technol Inform. 2017. PMID: 28423805
-
Proposal and Assessment of a De-Identification Strategy to Enhance Anonymity of the Observational Medical Outcomes Partnership Common Data Model (OMOP-CDM) in a Public Cloud-Computing Environment: Anonymization of Medical Data Using Privacy Models.J Med Internet Res. 2020 Nov 26;22(11):e19597. doi: 10.2196/19597. J Med Internet Res. 2020. PMID: 33177037 Free PMC article.
-
Clinical records anonymisation and text extraction (CRATE): an open-source software system.BMC Med Inform Decis Mak. 2017 Apr 26;17(1):50. doi: 10.1186/s12911-017-0437-1. BMC Med Inform Decis Mak. 2017. PMID: 28441940 Free PMC article. Review.
-
Preserving Privacy when Querying OMOP CDM Databases.Stud Health Technol Inform. 2022 Aug 31;298:163-164. doi: 10.3233/SHTI220930. Stud Health Technol Inform. 2022. PMID: 36073478
-
Current recommendations/practices for anonymising data from clinical trials in order to make it available for sharing: A scoping review.Clin Trials. 2022 Aug;19(4):452-463. doi: 10.1177/17407745221087469. Epub 2022 Jun 22. Clin Trials. 2022. PMID: 35730910 Free PMC article.
Cited by
-
Using mobile location data in biomedical research while preserving privacy.J Am Med Inform Assoc. 2018 Oct 1;25(10):1402-1406. doi: 10.1093/jamia/ocy071. J Am Med Inform Assoc. 2018. PMID: 29889279 Free PMC article.
-
Novel e-Health Applications for the Management of Cardiometabolic Risk Factors in Children and Adolescents in Greece.Nutrients. 2020 May 12;12(5):1380. doi: 10.3390/nu12051380. Nutrients. 2020. PMID: 32408523 Free PMC article. Review.
-
A linear tessellation model for the identification of "food desert": A case study of Shanghai, China.PLoS One. 2025 Jan 22;20(1):e0317003. doi: 10.1371/journal.pone.0317003. eCollection 2025. PLoS One. 2025. PMID: 39841653 Free PMC article.
-
Locational privacy-preserving distance computations with intersecting sets of randomly labeled grid points.Int J Health Geogr. 2021 Mar 20;20(1):14. doi: 10.1186/s12942-021-00268-y. Int J Health Geogr. 2021. PMID: 33743719 Free PMC article.
References
-
- Bivand RS, Pebesma EJ, Gómez-Rubio V. Applied spatial data analysis with R. New York: Springer; 2013.
-
- Trinckes JJ. The Definitive Guide to Complying with the HIPAA/HITECH Privacy and Security Rules. Boca Raton: CRC Press; 2013.
-
- Duncan G, Lambert D. The risk of disclosure for microdata. J Bus Econ Stat. 1989;7(2):207–217.
-
- El Emam K, Arbuckle L. Anonymizing health data: case studies and methods to get you started. Sebastopol: O’Reilly; 2014.
-
- Clarke KC. A multiscale masking method for point geographic data. Int J Geogr Inf Sci. 2016;30(2):300–315. doi: 10.1080/13658816.2015.1085540. - DOI
Publication types
MeSH terms
LinkOut - more resources
Full Text Sources
Other Literature Sources
