. 2016 Mar 15;310(6):C479-90.
doi: 10.1152/ajpcell.00171.2015. Epub 2016 Jan 6.

Endothelial mitochondria regulate the intracellular Ca2+ response to fluid shear stress

Affiliations

Endothelial mitochondria regulate the intracellular Ca2+ response to fluid shear stress

Christopher G Scheitlin et al. Am J Physiol Cell Physiol. .

Abstract

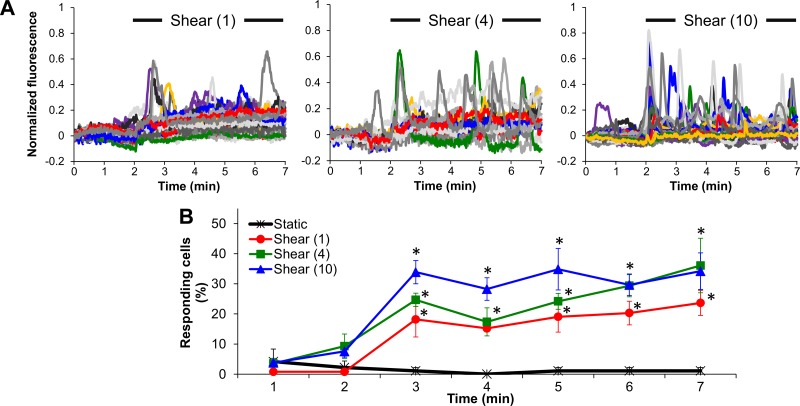
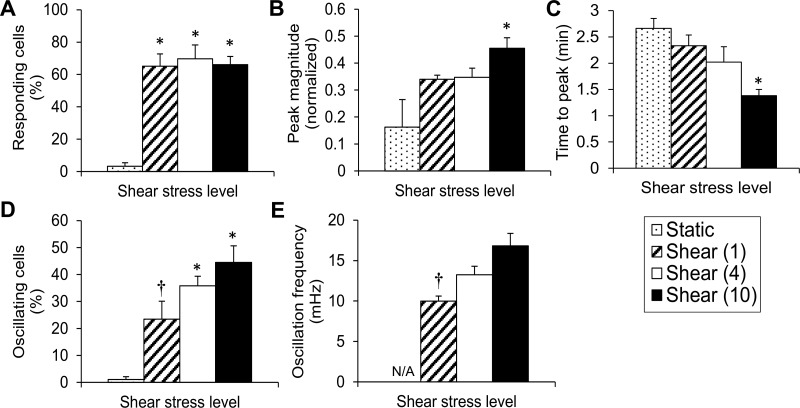
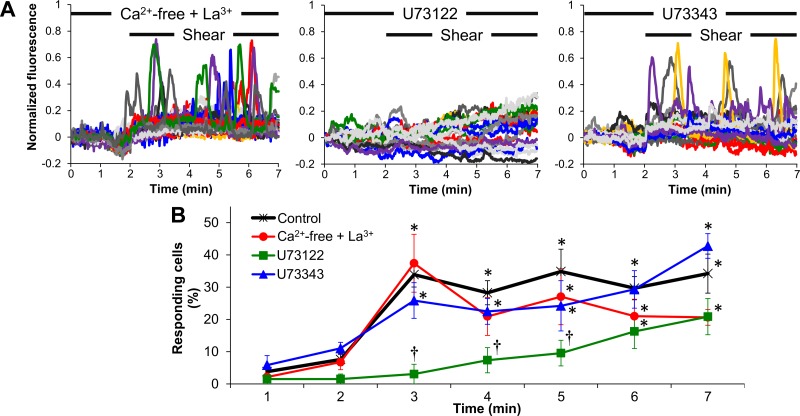
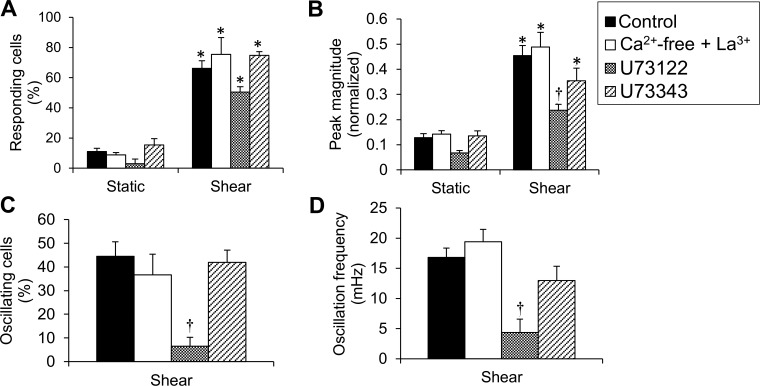
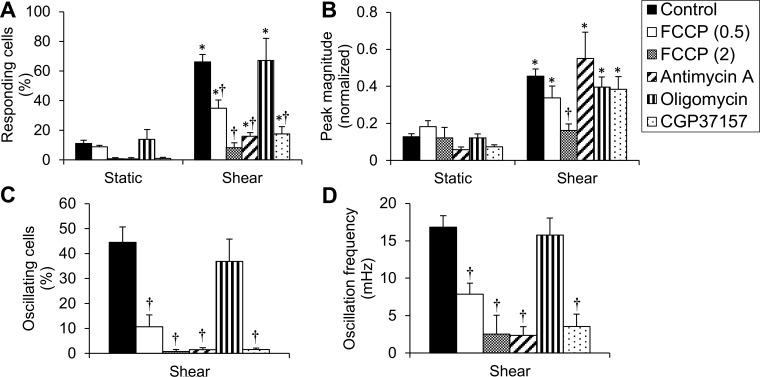
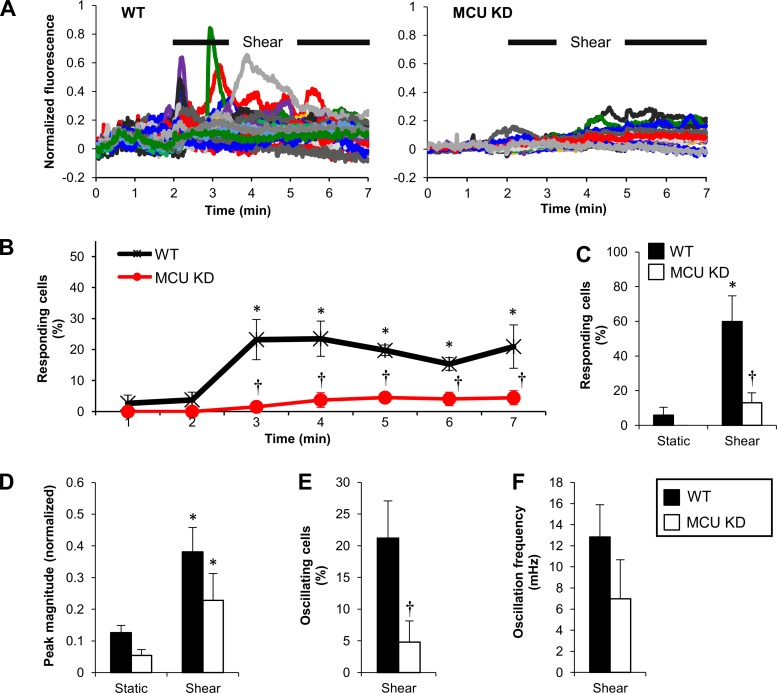
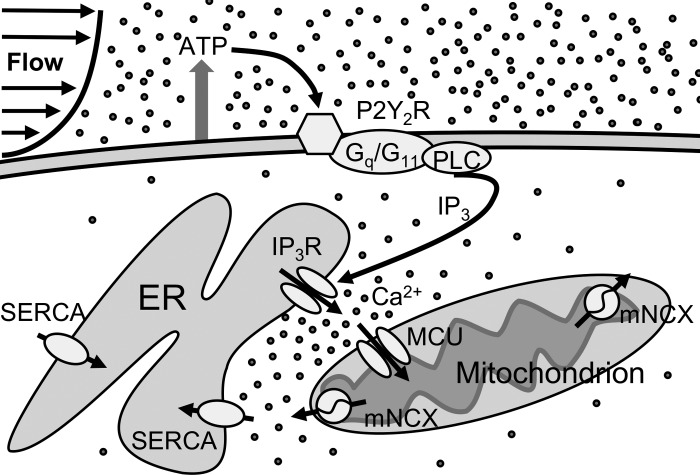
Shear stress is known to stimulate an intracellular free calcium concentration ([Ca(2+)]i) response in vascular endothelial cells (ECs). [Ca(2+)]i is a key second messenger for signaling that leads to vasodilation and EC survival. Although it is accepted that the shear-induced [Ca(2+)]i response is, in part, due to Ca(2+) release from the endoplasmic reticulum (ER), the role of mitochondria (second largest Ca(2+) store) is unknown. We hypothesized that the mitochondria play a role in regulating [Ca(2+)]i in sheared ECs. Cultured ECs, loaded with a Ca(2+)-sensitive fluorophore, were exposed to physiological levels of shear stress. Shear stress elicited [Ca(2+)]i transients in a percentage of cells with a fraction of them displaying oscillations. Peak magnitudes, percentage of oscillating ECs, and oscillation frequencies depended on the shear level. [Ca(2+)]i transients/oscillations were present when experiments were conducted in Ca(2+)-free solution (plus lanthanum) but absent when ECs were treated with a phospholipase C inhibitor, suggesting that the ER inositol 1,4,5-trisphosphate receptor is responsible for the [Ca(2+)]i response. Either a mitochondrial uncoupler or an electron transport chain inhibitor, but not a mitochondrial ATP synthase inhibitor, prevented the occurrence of transients and especially inhibited the oscillations. Knockdown of the mitochondrial Ca(2+) uniporter also inhibited the shear-induced [Ca(2+)]i transients/oscillations compared with controls. Hence, EC mitochondria, through Ca(2+) uptake/release, regulate the temporal profile of shear-induced ER Ca(2+) release. [Ca(2+)]i oscillation frequencies detected were within the range for activation of mechanoresponsive kinases and transcription factors, suggesting that dysfunctional EC mitochondria may contribute to cardiovascular disease by deregulating the shear-induced [Ca(2+)]i response.

Keywords: calcium oscillations; endothelial cell; fluid shear stress; intracellular calcium; mitochondria.


Figures

Fig. 1.
Fig. 1.
Shear stress causes endothelial cell (EC) intracellular free calcium concentration ([Ca2+]i) transient increases compared with static. A: characteristic normalized fluo-4 fluorescence signals vs. time during a 2-min static followed by a 5-min shear period at either 1, 4, or 10 dyn/cm2 (each colored line corresponds to a single cell in a microscope field of view; 10 colors are being repeated). B: responding cells (%) plotted every minute (at the end of each minute) during either a 7-min static period or a 2-min static period followed by a 5-min shear period (1, 4, or 10 dyn/cm2). Data are means ± SE (n = 4–8 independent experiments). *P < 0.05 vs. its corresponding (preshear) static period (average of the first 2-min data points).
Fig. 2.
Fig. 2.
Shear stress dose-dependently changes key quantifiable measures of the [Ca2+]i, response. A: responding cells (%) at the end of 5 min is plotted vs. shear stress level (0, 1, 4, or 10 dyn/cm2). B: magnitude of normalized fluorescence of the largest peak is averaged over all responding cells/experiment and independent experiments and plotted vs. shear stress level. C: time to first peak is processed and plotted as in B. D: oscillating cells (%) at the end of 5 min are plotted vs. shear stress level. E: oscillation frequency (mHz) of oscillating cells is plotted vs. shear stress level. Due to the shortage of oscillating cells under static, calculation of the oscillation frequency was labeled not applicable (N/A). Data are means ± SE (n = 4–8 independent experiments). *P < 0.05 vs. static. †P < 0.05 vs. the highest shear tested (10 dyn/cm2).
Fig. 3.
Fig. 3.
Shear-induced [Ca2+]i increases are due to inositol 1,4,5-trisphosphate (IP3)-dependent endoplasmic reticulum (ER) Ca2+ release. A: characteristic normalized fluorescence signals vs. time for endothelial cells (ECs) during a 2-min static incubation followed by shear (10 dyn/cm2) in either Ca2+-free solution supplemented with La3+ or in regular solution in the presence of either U73122 or U73343 (each colored line corresponds to a single cell in a microscope field of view). B: responding cells (%) vs. time (every minute) for control (shear at 10 dyn/cm2), Ca2+-free + La3+, U73122, or U73343. Data are means ± SE (n = 4–8 independent experiments). *P < 0.05 vs. its corresponding (preshear) static period. †P < 0.05 vs. control (at the corresponding time point).
Fig. 4.
Fig. 4.
ER Ca2+ release is required for shear-induced [Ca2+]i transients and oscillations. A: responding cells (%) throughout the (preshear) static period vs. the shear period for control, Ca2+-free + La3+, U73122, and U73343. B: peak magnitude of normalized fluorescence during static vs. shear for the same treatments as in A. C: oscillating cells (%) for the same treatments (since there were no oscillating cells during static, data were plotted only for ECs under shear). D: oscillation frequency (mHz) for the same treatments. Data are means ± SE (n = 4–8 independent experiments). *P < 0.05 vs. static under the same treatment. †P < 0.05 vs. control.
Fig. 5.
Fig. 5.
Shear-induced [Ca2+]i transients and oscillations require Ca2+ buffering by mitochondria. A: characteristic normalized fluorescence signals vs. time for ECs during a 2-min static incubation followed by shear (10 dyn/cm2) in the presence of either FCCP (0.5), antimycin A, or CGP37157. B: responding cells (%) vs. time (every min) for control, FCCP (0.5 or 2 μM), antimycin A, oligomycin. or CGP37157. Data are means ± SE (n = 4–8 independent experiments). *P < 0.05 vs. its corresponding (preshear) static period. †P < 0.05 vs. control (at the corresponding time point).
Fig. 6.
Fig. 6.
EC mitochondria regulate the shear-induced [Ca2+]i transients and oscillations. A: responding cells (%) throughout the (preshear) static period vs. the shear period for control, FCCP (0.5 or 2 μM), antimycin A, oligomycin, and CGP37157. B: peak magnitude of normalized fluorescence during static vs. shear for the same treatments as in A. C: oscillating cells (%) for the same treatments. D: oscillation frequency (mHz) for the same treatments. Data are means ± SE (n = 4–8 independent experiments). *P < 0.05 vs. static under the same treatment. †P < 0.05 vs. control.
Fig. 7.
Fig. 7.
EC mitochondrial Ca2+ ([Ca2+]mt) uptake is required for shear-induced [Ca2+]i transients and oscillations. A: characteristic normalized fluorescence signals vs. time for wild-type (WT) and mitochondrial Ca2+ uniporter (MCU) knockdown (KD) ECs during a 2-min static incubation followed by shear (10 dyn/cm2). B: responding cells (%) vs. time for WT and MCU KD. Data are means ± SE (n = 4–8 independent experiments). *P < 0.05 vs. corresponding static. †P < 0.05 vs. WT (at each time point). C: responding cells (%) throughout static and shear for wild-type (WT) and MCU knockdown (KD). D: peak magnitude during static and shear for WT and MCU KD. E and F: oscillating cells (%) and oscillation frequency, respectively, during shear of WT and MCU KD. For C–F: *P < 0.05 vs. corresponding static. †P < 0.05 vs. WT.
Fig. 8.
Fig. 8.
Schematic diagram of proposed Ca2+ signaling in ECs exposed to shear stress. Shear stress, mainly via ATP binding to P2Y2R, is thought to activate the G protein/PLC/IP3 pathway. IP3 activates the IP3R and causes Ca2+ release from the ER, which at high concentrations may deactivate the IP3R in the subcellular region between ER and mitochondria. Both [Ca2+]mt uptake via the MCU and [Ca2+]mt release via the mNCX may differentially regulate the activation of IP3R locally and, thus, play a role in shaping the first [Ca2+]i transient and, in particular, the subsequent oscillations. [Ca2+]mt release is thought to also help refill the ER store via the sarco-endoplasmic reticulum Ca2+-ATPase (SERCA).

References

    1. Ando J, Yamamoto K. Flow detection and calcium signaling in vascular endothelial cells. Cardiovasc Res 99: 260–268, 2013. - PubMed
    1. Andrews AM, Jaron D, Buerk DG, Barbee KA. Shear stress-induced NO production is dependent on ATP autocrine signaling and capacitative calcium entry. Cell Mol Bioeng 7: 510–520, 2014. - PMC - PubMed
    1. Arnaudeau S, Kelley WL, Walsh JV Jr, Demaurex N. Mitochondria recycle Ca2+ to the endoplasmic reticulum and prevent the depletion of neighboring endoplasmic reticulum regions. J Biol Chem 276: 29430–29439, 2001. - PubMed
    1. Belmonte S, Morad M. “Pressure-flow”-triggered intracellular Ca2+ transients in rat cardiac myocytes: possible mechanisms and role of mitochondria. J Physiol 586: 1379–1397, 2008. - PMC - PubMed
    1. Belmonte S, Morad M. Shear fluid-induced Ca2+ release and the role of mitochondria in rat cardiac myocytes. Ann NY Acad Sci 1123: 58–63, 2008. - PubMed

Publication types

MeSH terms

Substances

LinkOut - more resources