. 2016 Jan 26;113(4):925-30.
doi: 10.1073/pnas.1516847113. Epub 2016 Jan 6.

Marine biogenic source of atmospheric organic nitrogen in the subtropical North Atlantic

Affiliations

Marine biogenic source of atmospheric organic nitrogen in the subtropical North Atlantic

Katye E Altieri et al. Proc Natl Acad Sci U S A. .

Abstract

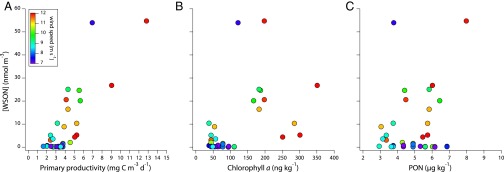
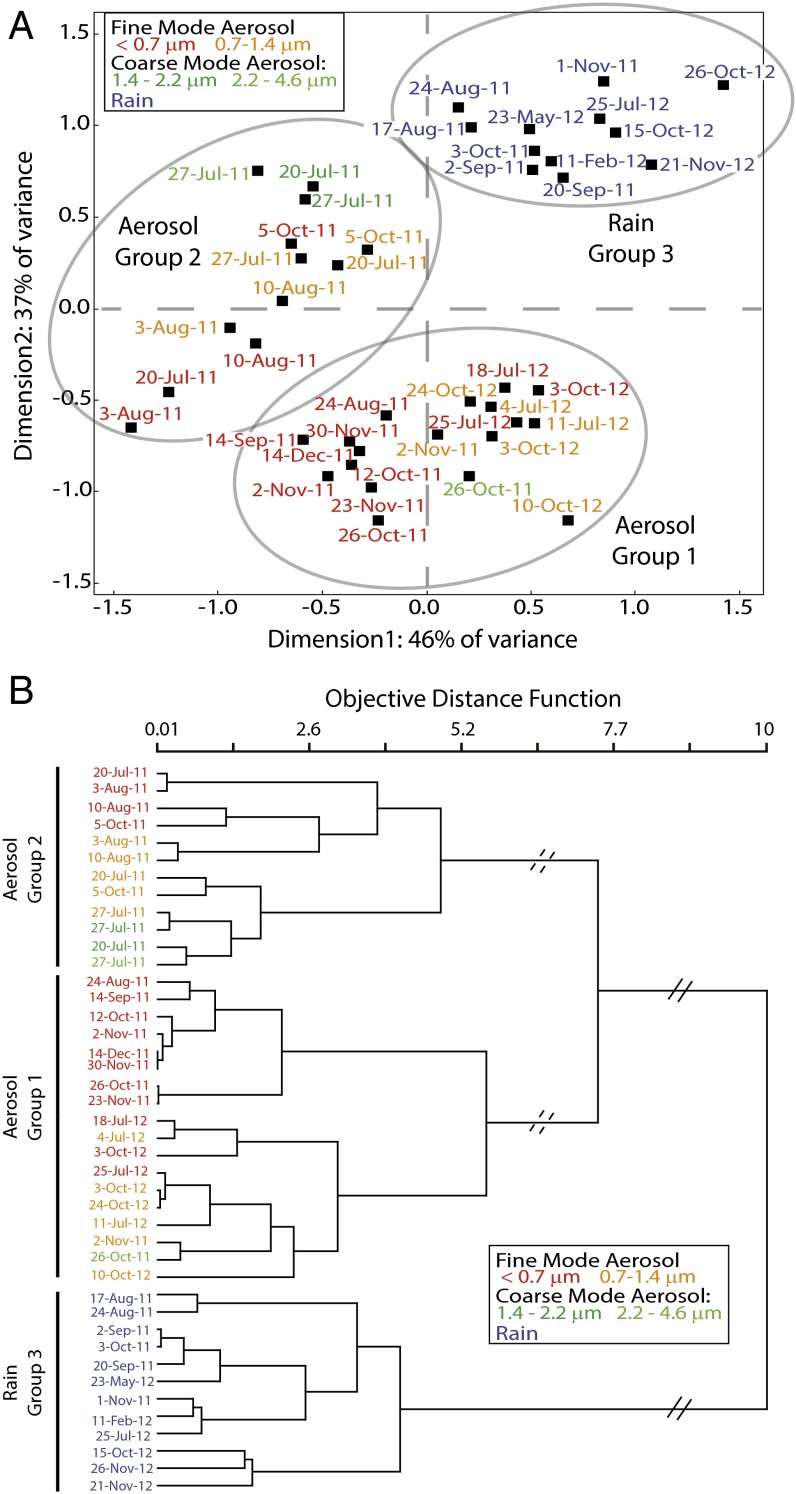
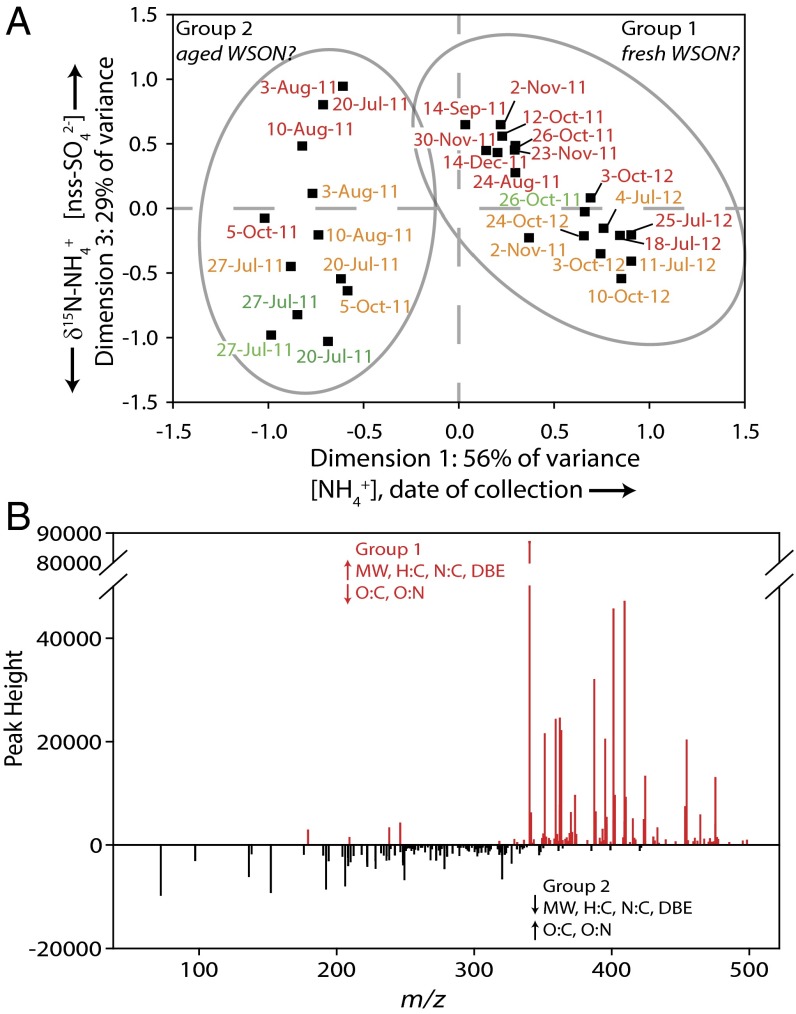
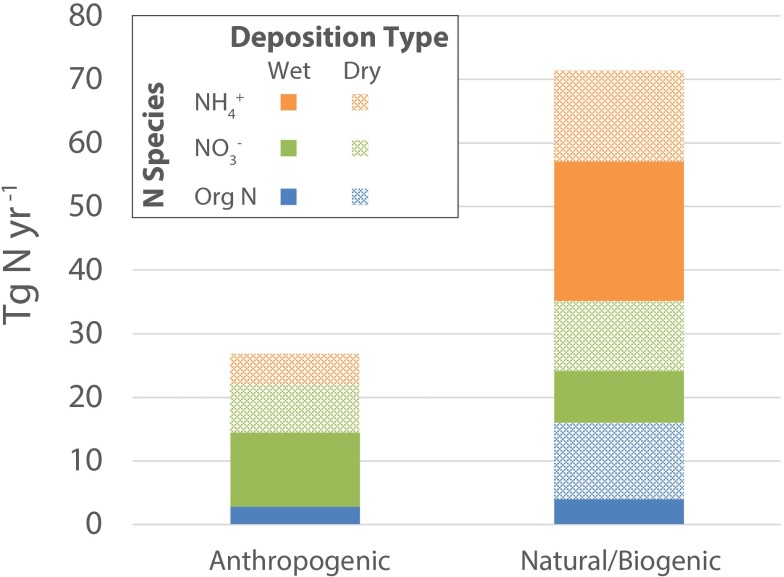
Global models estimate that the anthropogenic component of atmospheric nitrogen (N) deposition to the ocean accounts for up to a third of the ocean's external N supply and 10% of anthropogenic CO2 uptake. However, there are few observational constraints from the marine atmospheric environment to validate these findings. Due to the paucity of atmospheric organic N data, the largest uncertainties related to atmospheric N deposition are the sources and cycling of organic N, which is 20-80% of total N deposition. We studied the concentration and chemical composition of rainwater and aerosol organic N collected on the island of Bermuda in the western North Atlantic Ocean over 18 mo. Here, we show that the water-soluble organic N concentration ([WSON]) in marine aerosol is strongly correlated with surface ocean primary productivity and wind speed, suggesting a marine biogenic source for aerosol WSON. The chemical composition of high-[WSON] aerosols also indicates a primary marine source. We find that the WSON in marine rain is compositionally different from that in concurrently collected aerosols, suggesting that in-cloud scavenging (as opposed to below-cloud "washout") is the main contributor to rain WSON. We conclude that anthropogenic activity is not a significant source of organic N to the marine atmosphere over the North Atlantic, despite downwind transport from large pollution sources in North America. This, in conjunction with previous work on ammonium and nitrate, leads to the conclusion that only 27% of total N deposition to the global ocean is anthropogenic, in contrast to the 80% estimated previously.

Keywords: aerosol; atmospheric deposition; marine atmosphere; organic nitrogen; rain.


Conflict of interest statement

The authors declare no conflict of interest.

Figures

Fig. 1.
Fig. 1.
Aerosol [WSON] as a function of (A) gross primary production (GPP; r2 = 0.69), (B) chlorophyll-a concentration (r2 = 0.25), and (C) PON concentration in the surface ocean (i.e., upper 5–10 m) at BATS (r2 = 0.05). The wind speeds indicated by the color shading are the average of the daily recordings taken by the Bermuda Weather Service (www.weather.bm) for the time period during which the aerosol sampler was deployed (1 wk).
Fig. 2.
Fig. 2.
(A) Ordination plot for NMS of the rain and aerosol samples. The two aerosol groups and one rain group are labeled Aerosol Group 1, Aerosol Group 2, and Rain Group 3, respectively. (B) Linkage diagram of rain and aerosol samples calculated from the original Bray−Curtis distance matrix and Ward’s method. The horizontal distance represents the objective distance function. The dendrogram was clipped at the highest level (solid diagonal lines) into two groups, one of rain samples and one of aerosol samples, and then a second time (dashed diagonal lines), splitting the aerosol samples into two groups.
Fig. 3.
Fig. 3.
(A) Ordination plot for NMS of the aerosol samples. The ordination was calculated with the N-containing elemental formulas from each sample. Dates in red and orange are fine-mode aerosols (<0.7 µm and 0.7–1.4 µm), and dates in green are coarse-mode aerosols (1.4–2.2 µm and 2.2–4.6 µm). The circles indicating groups 1 and 2 are the same designations as from the NMS ordination in Fig. 2A and the cluster dendrogram in Fig. 2B. The chemical composition data indicate that group 1 aerosols are likely fresh WSON, whereas group 2 aerosols are consistent with aged WSON. Dimension 1 is positively correlated with [NH4+] and date of collection, whereas dimension 3 is positively correlated with [nss-SO42-] and negatively correlated with δ15N−NH4+. (B) Indicator m/z values for the aerosol samples in group 1 (red lines) and group 2 (black lines) when absolute peak height was converted to presence/absence as 1/0. The group 2 aerosol indicator values are plotted as negative peak heights for comparison purposes only. Group 1 aerosols have indicator m/zs with higher molecular weight, H:C and N:C ratios, and DBE, and lower O:C and O:N ratios compared with group 2 aerosol indicator m/z’s.
Fig. 4.
Fig. 4.
Global anthropogenic and biogenic/natural N deposition scaled from concentrations at Bermuda to the global ocean and separated according to species (NH4+, NO3, Org N/WSON; colors) and type (wet and dry deposition; solid and pattern). The anthropogenic vs. natural source apportionment is discussed in Implications for Estimates of Atmospheric N Deposition to the Ocean and presented in Table S4.

References

    1. Duce RA, et al. Impacts of atmospheric anthropogenic nitrogen on the open ocean. Science. 2008;320(5878):893–897. - PubMed
    1. Jickells T, Baker AR, Cape JN, Cornell SE, Nemitz E. The cycling of organic nitrogen through the atmosphere. Philos Trans R Soc Lond B Biol Sci. 2013;368(1621):20130115. - PMC - PubMed
    1. Zhang Y, et al. Evidence for organic N deposition and its anthropogenic sources in China. Atmos Environ. 2008;42(6):1035–1041.
    1. Kanakidou M, et al. Atmospheric fluxes of organic N and P to the global ocean. Global Biogeochem Cycles. 2012;26(3):GB3026.
    1. Altieri KE, Hastings MG, Gobel AR, Peters AJ, Sigman DM. Isotopic composition of rainwater nitrate at Bermuda: The influence of air mass source and chemistry in the marine boundary layer. J Geophys Res. 2013;118(D19):11304–11316.

Publication types

LinkOut - more resources