. 2016 Feb 1:292:40-55.
doi: 10.1016/j.taap.2015.12.020. Epub 2015 Dec 29.

A cellular model to study drug-induced liver injury in nonalcoholic fatty liver disease: Application to acetaminophen

Affiliations

A cellular model to study drug-induced liver injury in nonalcoholic fatty liver disease: Application to acetaminophen

Anaïs Michaut et al. Toxicol Appl Pharmacol. .

Abstract

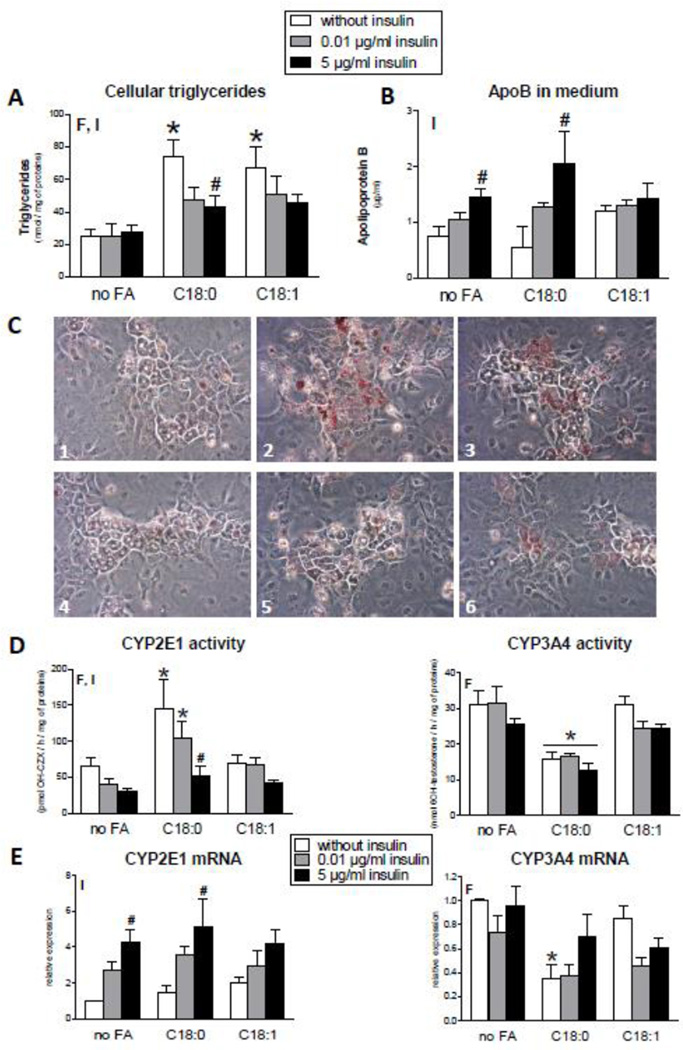
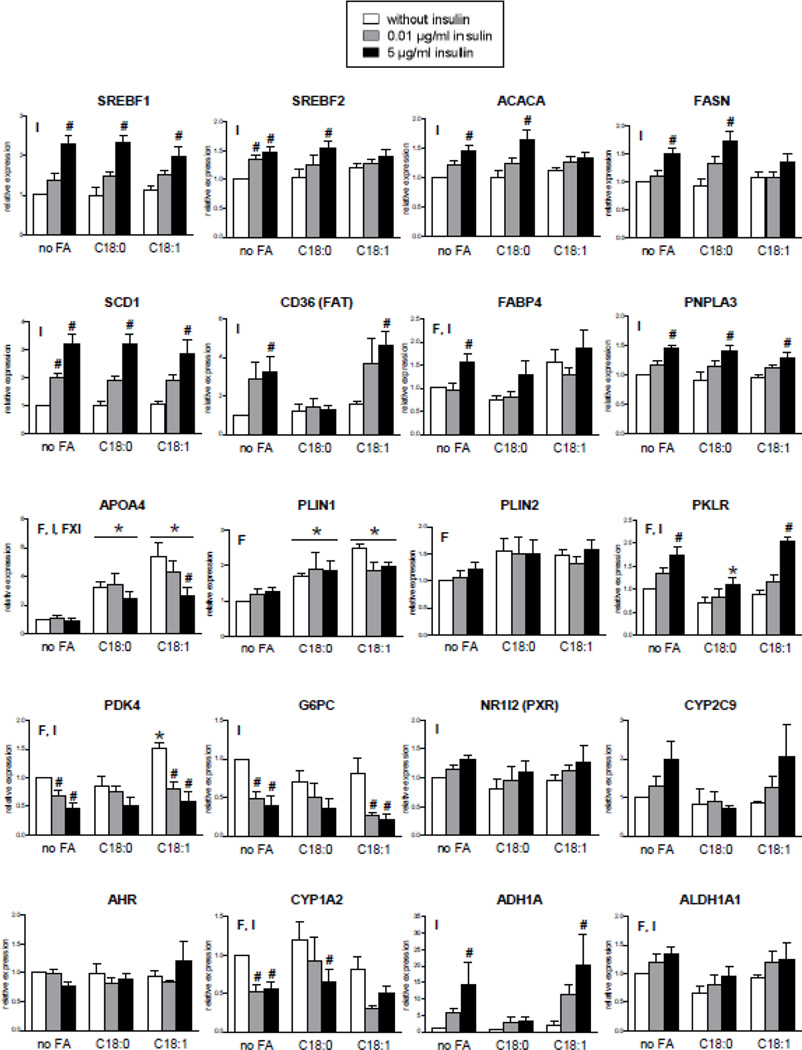
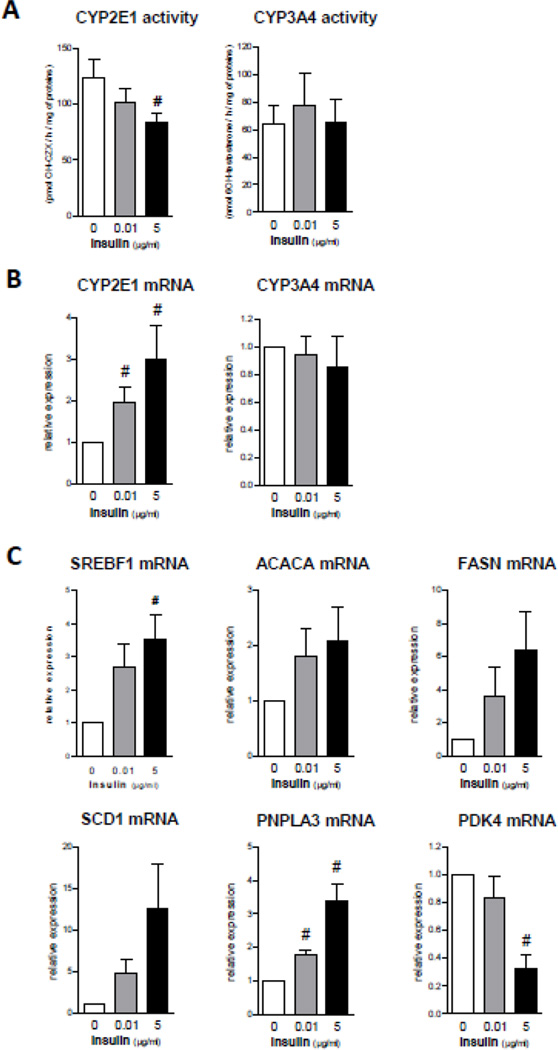
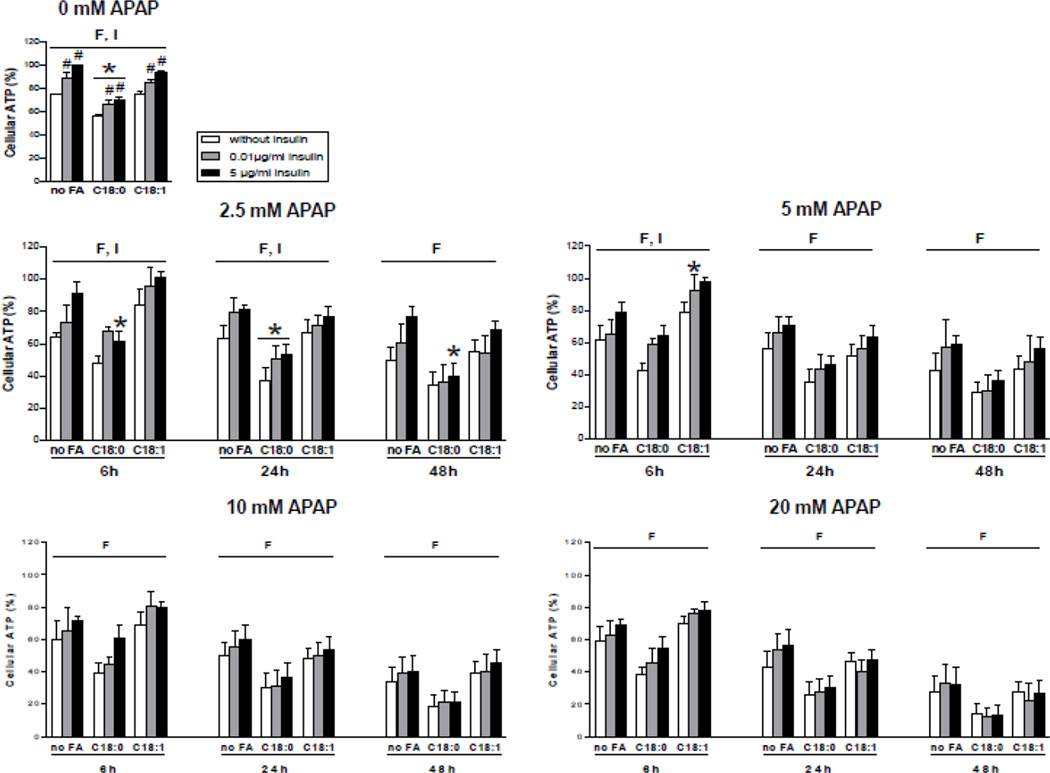
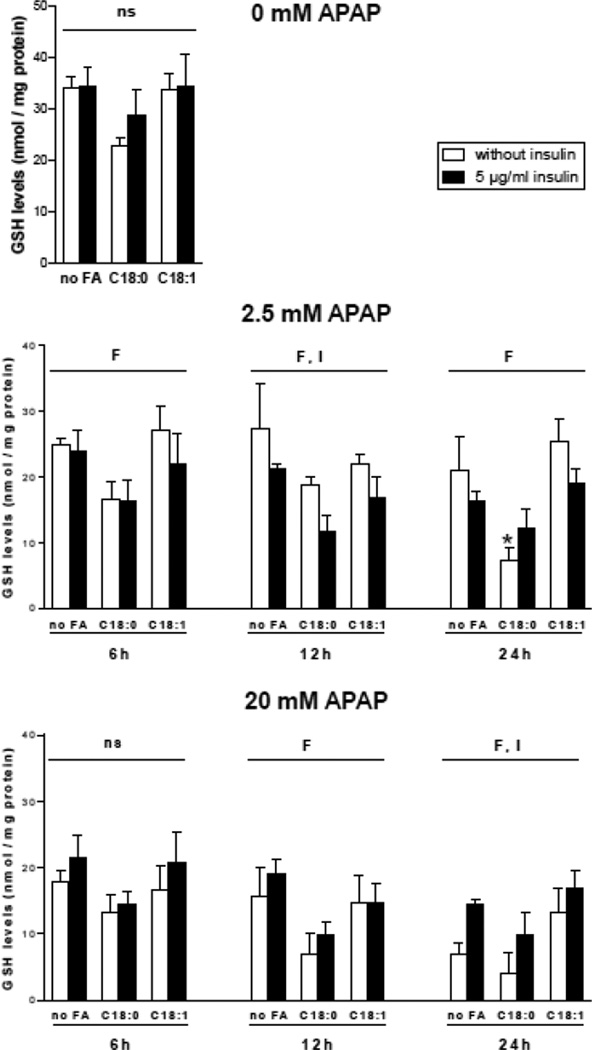
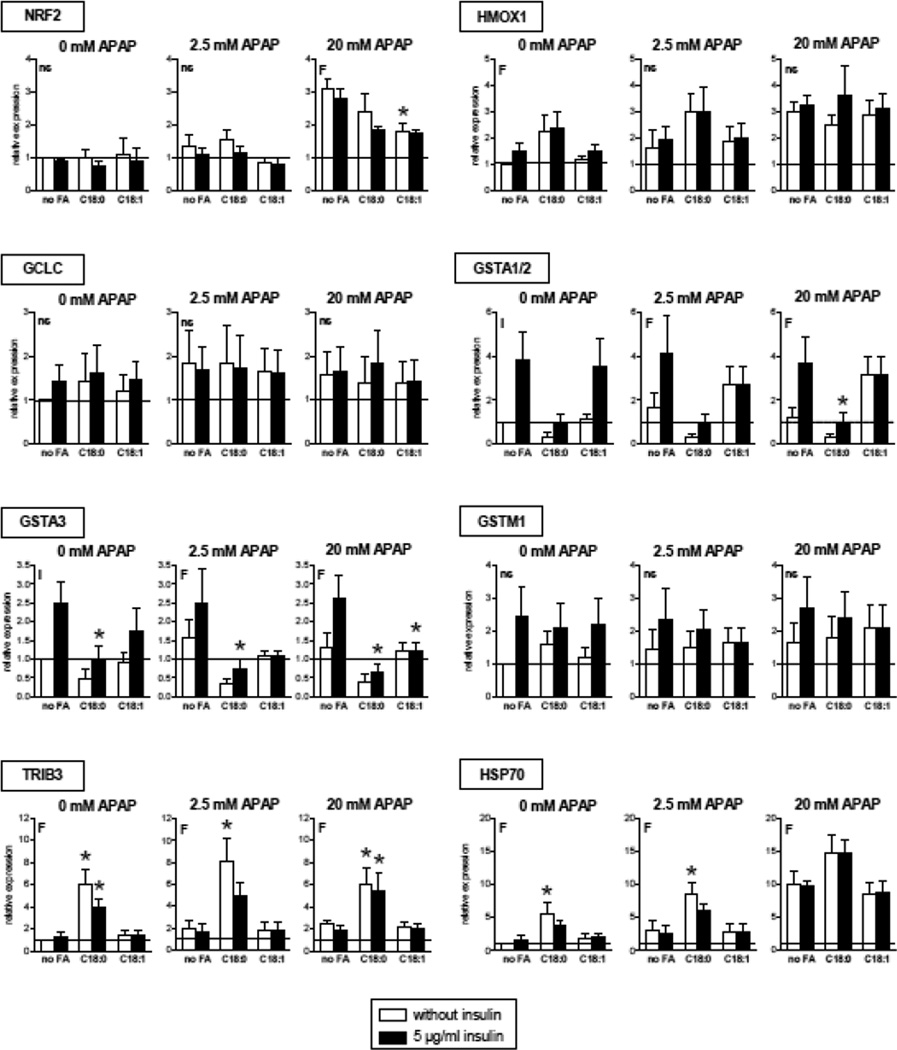
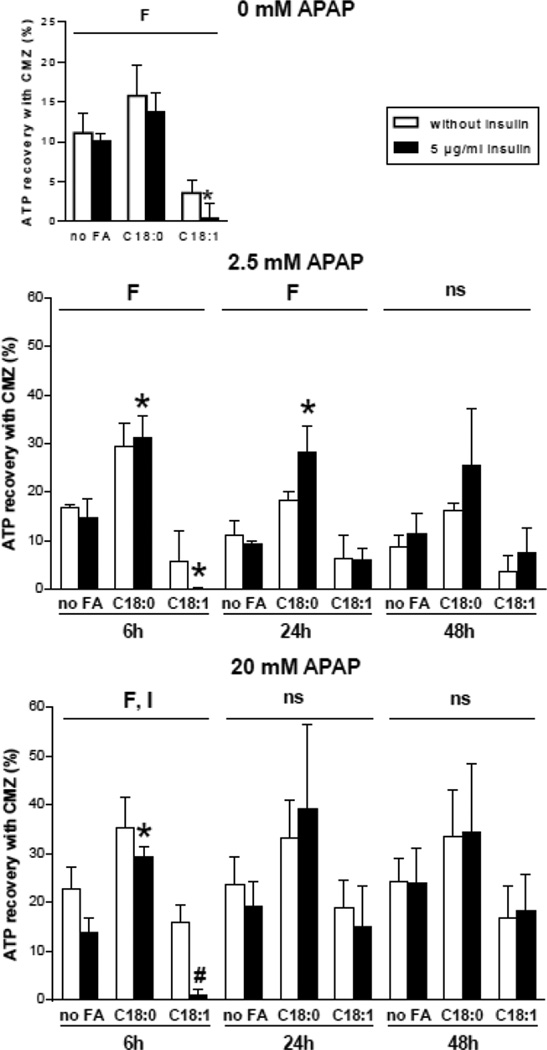
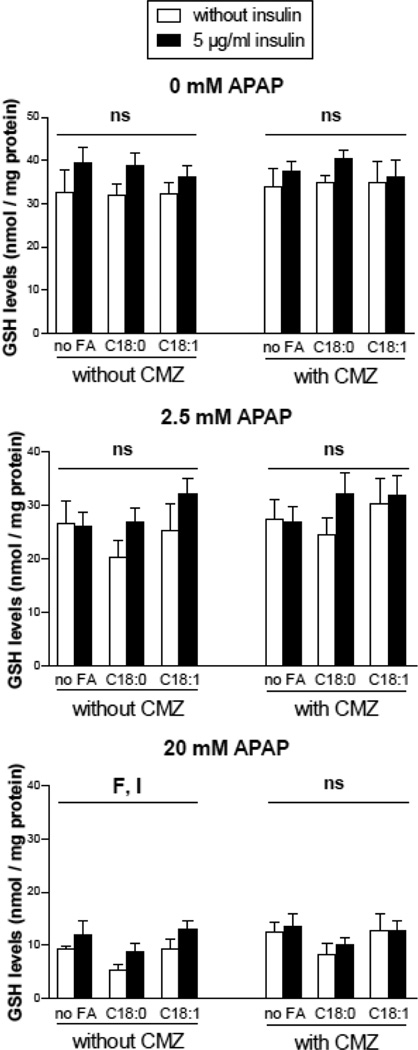
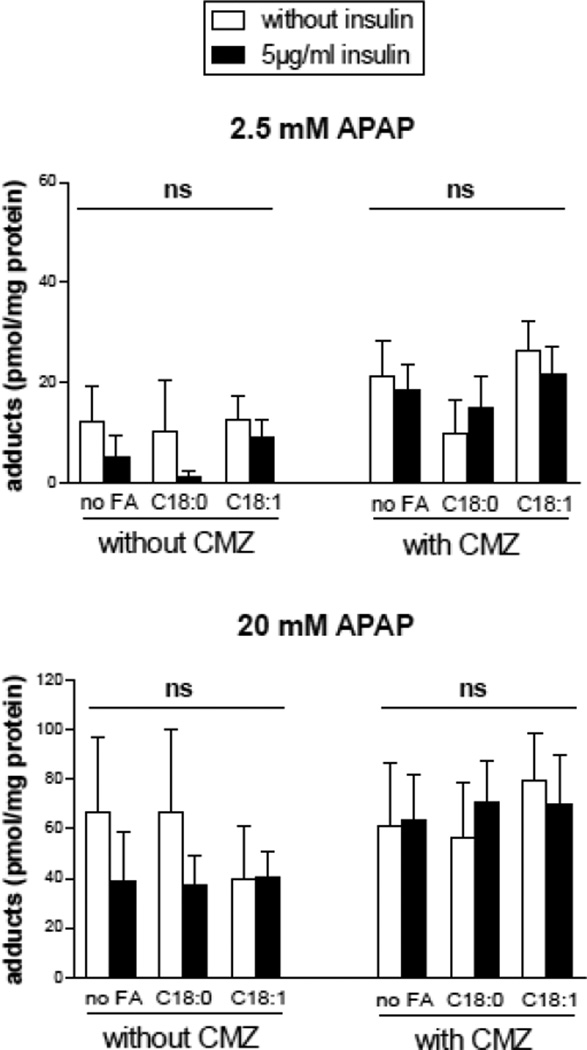
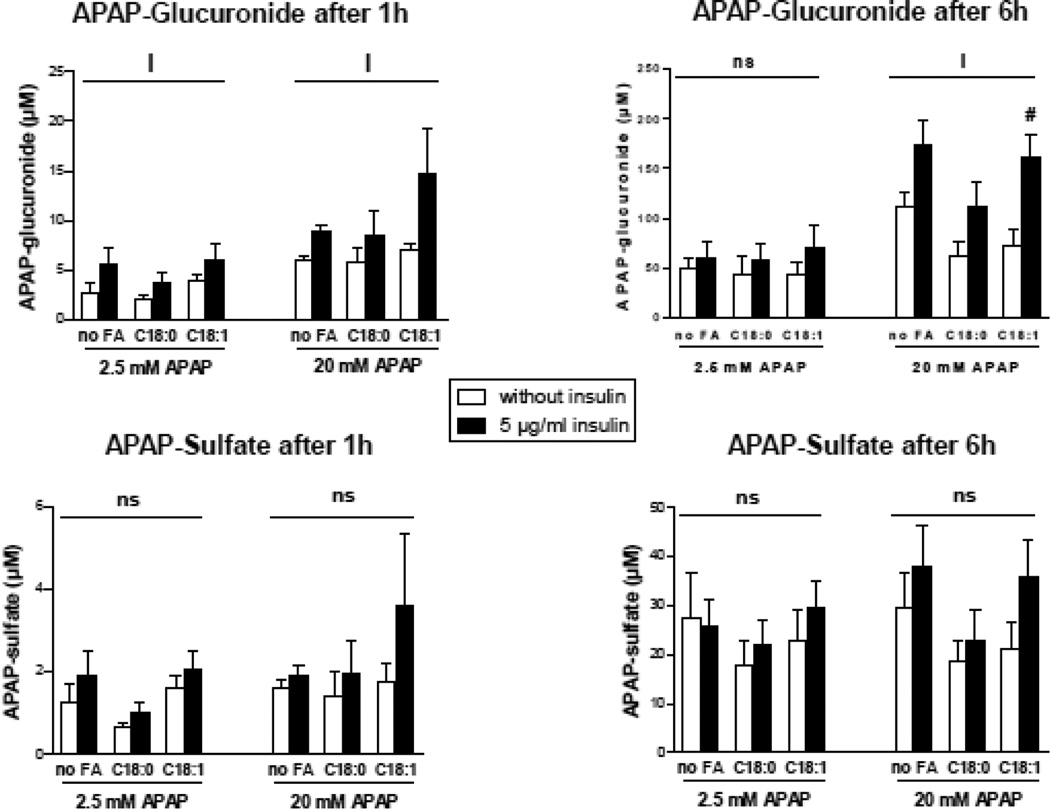
Obesity and nonalcoholic fatty liver disease (NAFLD) can increase susceptibility to hepatotoxicity induced by some xenobiotics including drugs, but the involved mechanisms are poorly understood. For acetaminophen (APAP), a role of hepatic cytochrome P450 2E1 (CYP2E1) is suspected since the activity of this enzyme is consistently enhanced during NAFLD. The first aim of our study was to set up a cellular model of NAFLD characterized not only by triglyceride accumulation but also by higher CYP2E1 activity. To this end, human HepaRG cells were incubated for one week with stearic acid or oleic acid, in the presence of different concentrations of insulin. Although cellular triglycerides and the expression of lipid-responsive genes were similar with both fatty acids, CYP2E1 activity was significantly increased only by stearic acid. CYP2E1 activity was reduced by insulin and this effect was reproduced in cultured primary human hepatocytes. Next, APAP cytotoxicity was assessed in HepaRG cells with or without lipid accretion and CYP2E1 induction. Experiments with a large range of APAP concentrations showed that the loss of ATP and glutathione was almost always greater in the presence of stearic acid. In cells pretreated with the CYP2E1 inhibitor chlormethiazole, recovery of ATP was significantly higher in the presence of stearate with low (2.5mM) or high (20mM) concentrations of APAP. Levels of APAP-glucuronide were significantly enhanced by insulin. Hence, HepaRG cells can be used as a valuable model of NAFLD to unveil important metabolic and hormonal factors which can increase susceptibility to drug-induced hepatotoxicity.

Keywords: Acetaminophen; CYP2E1; Hepatotoxicity; Liver; NAFLD; Obesity.


Conflict of interest statement

Conflict of interest statement

Anaïs Michaut, Dounia Le Guillou, Caroline Moreau, Simon Bucher, Mitchell McGill, Sophie Martinais, Thomas Gicquel, Isabelle Morel and Marie-Anne Robin have nothing to disclose.

Figures

Figure 1
Figure 1
Effects of 1 week of treatment with 100 µM stearic acid (C18:0), 100 µM oleic acid (C18:1) and different concentrations of insulin on cellular triglycerides, neutral lipid deposition, apoB levels in culture medium and mRNA activity and expression of CYP2E1 and CYP3A4 in HepaRG cells. (A) Cellular triglycerides. Results are means ± SEM for 5 independent cultures, with data in duplicates for each culture. (B) ApoB levels in culture medium. Results are means ± SEM for 3 independent cultures. (C) Cellular lipids stained with oil red O. The pictures 1 to 6 (magnification × 200) are representative of the following conditions: 1) HepaRG cells incubated without insulin and fatty acids; 2) HepaRG cells incubated without insulin and with stearic acid; 3) HepaRG cells incubated without insulin and with oleic acid; 4) HepaRG cells incubated with 5 µg/ml insulin and without fatty acids; 5) HepaRG cells incubated with 5 µg/ml insulin and with stearic acid; 6) HepaRG cells incubated with 5 µg/ml insulin and with oleic acid. (D) CYP2E1 and CYP3A4 activity. Results are means ± SEM for 5 independent cultures, with data in duplicates for each culture. (E) mRNA levels of CYP2E1 and CYP3A4. Results are means ± SEM for 5 independent cultures, with data in duplicates for each culture. In panels showing bar graphs, letters F and I indicate a significant effect (P<0.05) of fatty acids and insulin, respectively. *Significantly different from HepaRG cells incubated without fatty acids and with the same condition of insulin treatment (P<0.05). #Significantly different from HepaRG cells incubated without insulin and with the same condition of fatty acid treatment (P<0.05).
Figure 2
Figure 2
Effects in HepaRG cells of 1 week of treatment with 100 µM stearic acid (C18:0), 100 µM oleic acid (C18:1) and different concentrations of insulin on the expression of 20 different genes. Results are means ± SEM for 5 independent cultures, with data in duplicates for each culture. Letters F and I indicate a significant effect (P<0.05) of fatty acids and insulin, respectively. FxI indicates a significant interaction between the effects of fatty acids and insulin. *Significantly different from HepaRG cells incubated without fatty acids and with the same condition of insulin treatment (P<0.05). #Significantly different from HepaRG cells incubated without insulin and with the same condition of fatty acid treatment (P<0.05).
Figure 3
Figure 3
Effects of 1 week of treatment with different concentrations of insulin in cultured PHH. (A) CYP2E1 and CYP3A4 activity. Results are means ± SEM for 5 and 4 independent cultures, respectively for the activity of CYP2E1 and CYP3A4. #Significantly different from PHH incubated without insulin (P<0.05). (B) mRNA levels of CYP2E1 and CYP3A4. Results are means ± SEM for 4 independent cultures. #Significantly different from PHH incubated without insulin (P<0.05). (C) mRNA expression of genes responsive to insulin. Results are means ± SEM for 4 independent cultures. #Significantly different from PHH incubated without insulin (P<0.05).
Figure 4
Figure 4
Levels of ATP in HepaRG cells treated or not with APAP. HepaRG cells were incubated for 1 week with different conditions of incubation with 100 µM stearic acid (C18:0), 100 µM oleic acid (C18:1) and different concentrations of insulin and subsequently treated or not with 2.5, 5, 10 or 20 mM of APAP. ATP levels were measured 6, 24 or 48 h after APAP treatment. Cellular ATP levels were set at 100% in HepaRG cells incubated for 1 week without fatty acids and with 5 µg/ml of insulin and not treated with APAP. Results are means ± SEM for 3 to 6 independent cultures, with data in duplicates for each culture. Letters F and I indicate a significant effect (P<0.05) of fatty acids and insulin, respectively. *Significantly different from HepaRG cells incubated without fatty acids and with the same condition of insulin treatment (P<0.05). #Significantly different from HepaRG cells incubated without insulin and with the same condition of fatty acid treatment (P<0.05).
Figure 5
Figure 5
Levels of total GSH in HepaRG cells treated or not with APAP. HepaRG cells were incubated for 1 week with different conditions of incubation with 100 µM stearic acid (C18:0), 100 µM oleic acid (C18:1) and two concentrations of insulin and subsequently treated or not with 2.5 or 20 mM of APAP. Total GSH levels were measured 6, 12 or 24 h after APAP treatment. Results are means ± SEM for 5 independent cultures. Letters F and I indicate a significant effect (P<0.05) of fatty acids and insulin, respectively and ns, not significant with a two-way ANOVA analysis. *Significantly different from HepaRG cells incubated without fatty acids and with the same condition of insulin treatment (P<0.05).
Figure 6
Figure 6
Expression of different genes involved in oxidative stress in HepaRG cells treated or not with APAP. HepaRG cells were incubated for 1 week with different conditions of incubation with 100 µM stearic acid (C18:0), 100 µM oleic acid (C18:1) and two concentrations of insulin and subsequently treated with 2.5 or 20 mM of APAP. Gene expression was measured 6 h after APAP treatment. Results are means ± SEM for 3–4 independent cultures, with data in duplicates for each culture. Letters F and I indicate a significant effect (P<0.05) of fatty acids and insulin, respectively and ns, not significant with a two-way ANOVA analysis. *Significantly different from HepaRG cells incubated without fatty acids and with the same condition of insulin treatment (P<0.05).
Figure 7
Figure 7
Recovery of ATP in HepaRG cells pretreated with the CYP2E1 inhibitor CMZ and subsequently treated with APAP. HepaRG cells were incubated for 1 week with different conditions of incubation with 100 µM stearic acid (C18:0), 100 µM oleic acid (C18:1), two concentrations of insulin and 150 µM CMZ and subsequently treated or not with 2.5 or 20 mM of APAP. ATP levels were measured 6, 24 or 48 h after APAP treatment. ATP recovery was determined by calculating the difference of ATP levels measured with and without CMZ. Results are means ± SEM for 3 independent cultures, with data in triplicates for each culture. Letters F and I indicate a significant effect (P<0.05) of fatty acids and insulin, respectively and ns, not significant with a two-way ANOVA analysis. *Significantly different from HepaRG cells incubated without fatty acids and with the same condition of insulin treatment (P<0.05). #Significantly different from HepaRG cells incubated without insulin and with the same condition of fatty acid treatment (P<0.05).
Figure 8
Figure 8
Total GSH levels in HepaRG cells pretreated or not with the CYP2E1 inhibitor CMZ and subsequently treated with APAP. HepaRG cells were incubated for 1 week with different conditions of incubation with 100 mM stearic acid (C18:0), 100 mM oleic acid (C18:1), two concentrations of insulin and 150 mM CMZ and subsequently treated or not with 2.5 or 20 mM APAP. GSH levels were measured 24 hours after APAP treatment. Results are means ± SEM for 5 independent cultures. Letters F and I indicate a significant effect (P<0.05) of fatty acids and insulin, respectively and ns, not significant with a two-way ANOVA analysis.
Figure 9
Figure 9
APAP-protein adducts in HepaRG cells pretreated or not with the CYP2E1 inhibitor CMZ and subsequently treated with APAP. HepaRG cells were incubated for 1 week with different conditions of incubation with 100 mM stearic acid (C18:0), 100 mM oleic acid (C18:1), two concentrations of insulin and 150 mM CMZ and subsequently treated or not with 2.5 or 20 mM APAP. APAP-protein adducts were measured 6 hours after APAP treatment. Results are means ± SEM for 3 independent cultures. The letters ns indicate that there was no significant effect of fatty acids or insulin with a two-way ANOVA analysis.
Figure 10
Figure 10
Concentrations of APAP-glucuronide and APAP-sulfate in the culture media of HepaRG cells treated with 2.5 or 20 mM of APAP. HepaRG cells were incubated for 1 week with different conditions of incubation with 100 µM stearic acid (C18:0), 100 µM oleic acid (C18:1) and two concentrations of insulin and subsequently treated with 2.5 or 20 mM of APAP. APAP-glucuronide and APAP-sulfate were measured 1 and 6 h after APAP treatment. Results are means ± SEM for 4 independent cultures. The letter I indicates a significant effect (P<0.05) of insulin, and ns, not significant with a two-way ANOVA analysis. #Significantly different from HepaRG cells incubated without insulin and with the same condition of fatty acid treatment (P<0.05).

References

    1. Andersson TB, Kanebratt KP, Kenna JG. The HepaRG cell line: a unique in vitro tool for understanding drug metabolism and toxicology in human. Expert Opin Drug Metab Toxicol. 2012;8:909–920. - PubMed
    1. Aninat C, Piton A, Glaise D, Le Charpentier T, Langouët S, Morel F, Guguen-Guillouzo C, Guillouzo A. Expression of cytochromes P450, conjugating enzymes and nuclear receptors in human hepatoma HepaRG cells. Drug Metab. Dispos. 2006;34:75–83. - PubMed
    1. Anthérieu S, Chesné C, Li R, Camus S, Lahoz A, Picazo L, Turpeinen M, Tolonen A, Uusitalo J, Guguen-Guillouzo C, Guillouzo A. Stable expression, activity, and inducibility of cytochromes P450 in differentiated HepaRG cells. Drug Metab. Dispos. 2010;38:516–525. - PubMed
    1. Anthérieu S, Rogue A, Fromenty B, Guillouzo A, Robin MA. Induction of vesicular steatosis by amiodarone and tetracycline is associated with up-regulation of lipogenic genes in HepaRG cells. Hepatology. 2011;53:1895–1905. - PubMed
    1. Anthérieu S, Chesné C, Li R, Guguen-Guillouzo C, Guillouzo A. Optimization of the HepaRG cell model for drug metabolism and toxicity studies. Toxicol. In Vitro. 2012;26:1278–1285. - PubMed

Publication types

MeSH terms