The descriptive epidemiology of accelerometer-measured physical activity in older adults
- PMID: 26739758
- PMCID: PMC4704380
- DOI: 10.1186/s12966-015-0316-z
The descriptive epidemiology of accelerometer-measured physical activity in older adults
Abstract
Background: Objectively measured physical activity between older individuals and between populations has been poorly described. We aimed to describe and compare the variation in accelerometry data in older UK (EPIC-Norfolk) and American (NHANES) adults.
Methods: Physical activity was measured by uniaxial accelerometry in 4,052 UK (49-91 years) and 3459 US older adults (49-85 years). We summarized physical activity as volume (average counts/minute), its underlying intensity distribution, and as time spent <100counts/minute, ≥809counts/minute and ≥2020counts/minute both for total activity and that undertaken in ≥10-min bouts.
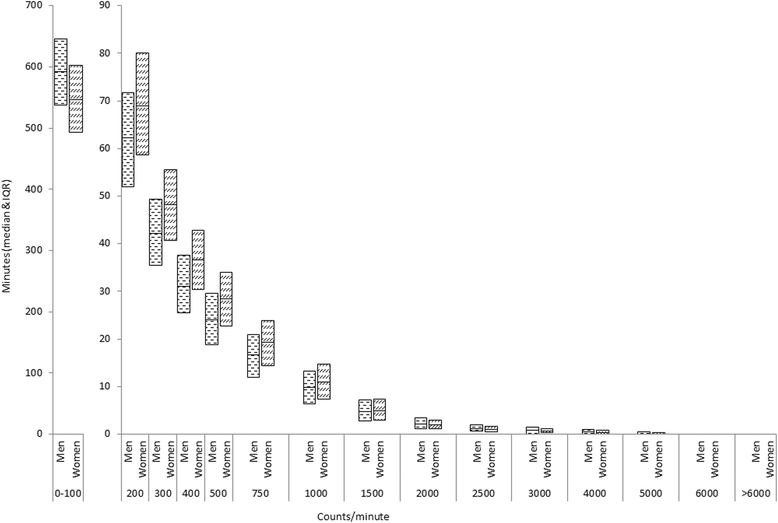
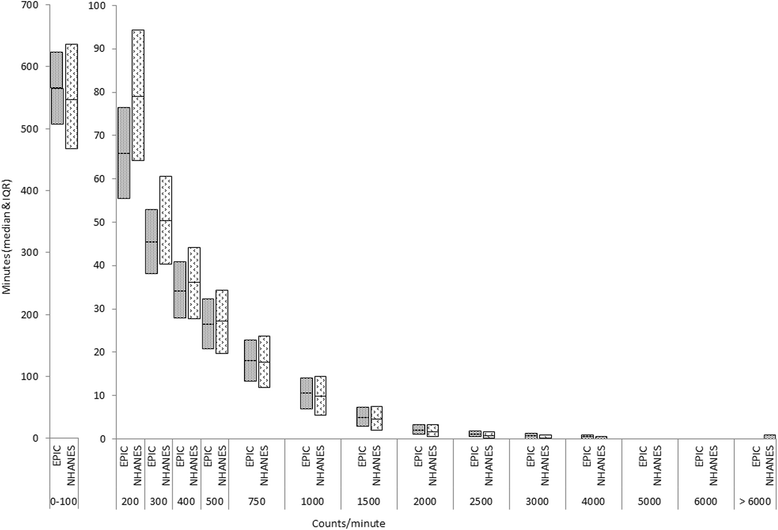
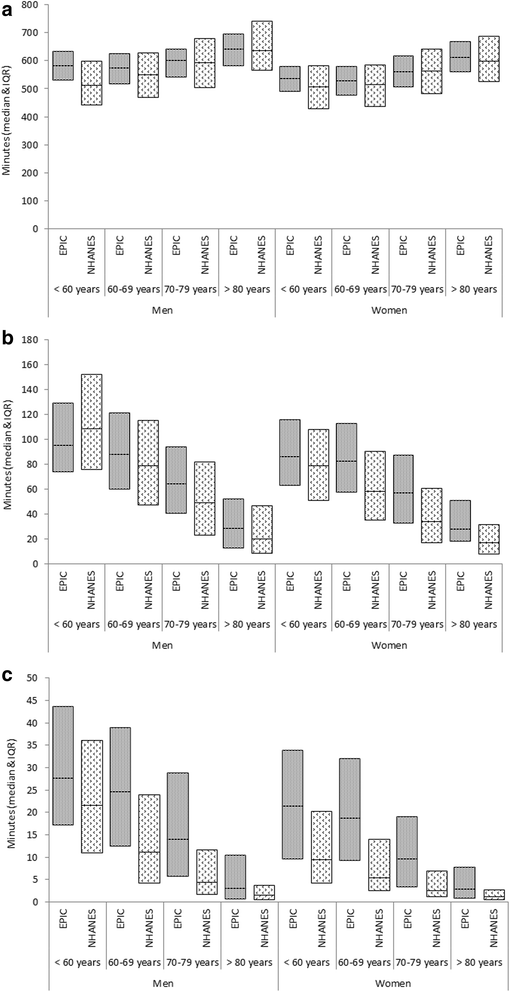
Results: In EPIC-Norfolk 65% of wear-time was spent at <100 counts/minute and 20% spent in the range 100-500 counts/minute. Only 4.1% of this cohort accumulated more than 30 min/day of activity above 2020 counts/minute in 10-min bouts. If a cut-point of >809 counts/minute is used 18.7% of people reached the 30 min/day threshold. By comparison, 2.5% and 9.5% of American older adults accumulated activity at these levels, respectively.
Conclusion: As assessed by objectively measured physical activity, the majority of older adults in this UK study did not meet current activity guidelines. Older adults in the UK were more active overall, but also spent more time being sedentary than US adults.
Figures


References
-
- Aresu M, Bécares L, Brage S, Chaudhury M, Doyle-Francis M, Esliger D, et al. Health Survey for England 2008: Volume 1 Physical activity and fitness. NHS, The Information Centre for Health and Social Care. 2011. p. 894–910. Available from: http://www.hscic.gov.uk/pubs/hse08physicalactivity.
-
- Department of Health. Start Active, Stay Active: A report on physical activity for health from the four home countries’ Chief Medical Officers. Strategy. 2011. https://www.gov.uk/government/publications/start-active-stay-active-a-re....
-
- Wareham NJ, Rennie KL. The assessment of physical activity in individuals and populations: why try to be more precise about how physical activity is assessed? Int J Obes Relat Metab Disord. 1998;22(Suppl 2):S30–8. - PubMed
Publication types
MeSH terms
Grants and funding
- MR/K023187/1/MRC_/Medical Research Council/United Kingdom
- G0401527/MRC_/Medical Research Council/United Kingdom
- C864/A8257/CRUK_/Cancer Research UK/United Kingdom
- MR/K025147/1/MRC_/Medical Research Council/United Kingdom
- MC_UU_12015/1/MRC_/Medical Research Council/United Kingdom
- MC_U106179471/MRC_/Medical Research Council/United Kingdom
- 14136/CRUK_/Cancer Research UK/United Kingdom
- MC_UU_12015/4/MRC_/Medical Research Council/United Kingdom
- MC_U106179474/MRC_/Medical Research Council/United Kingdom
- FS/12/58/29709/BHF_/British Heart Foundation/United Kingdom
- G1000143/MRC_/Medical Research Council/United Kingdom
- MC_UU_12015/3/MRC_/Medical Research Council/United Kingdom
- G9502233/MRC_/Medical Research Council/United Kingdom
- MC_U106179473/MRC_/Medical Research Council/United Kingdom
LinkOut - more resources
Full Text Sources
Other Literature Sources
Medical
Research Materials

