. 2016 Jan 7:9:2.
doi: 10.1186/s13045-015-0230-5.

Combined deletion of Xrcc4 and Trp53 in mouse germinal center B cells leads to novel B cell lymphomas with clonal heterogeneity

Affiliations

Combined deletion of Xrcc4 and Trp53 in mouse germinal center B cells leads to novel B cell lymphomas with clonal heterogeneity

Zhangguo Chen et al. J Hematol Oncol. .

Abstract

Background: Activated B lymphocytes harbor programmed DNA double-strand breaks (DSBs) initiated by activation-induced deaminase (AID) and repaired by non-homologous end-joining (NHEJ). While it has been proposed that these DSBs during secondary antibody gene diversification are the primary source of chromosomal translocations in germinal center (GC)-derived B cell lymphomas, this point has not been directly addressed due to the lack of proper mouse models.

Methods: In the current study, we establish a unique mouse model by specifically deleting a NHEJ gene, Xrcc4, and a cell cycle checkpoint gene, Trp53, in GC B cells, which results in the spontaneous development of B cell lymphomas that possess features of GC B cells.

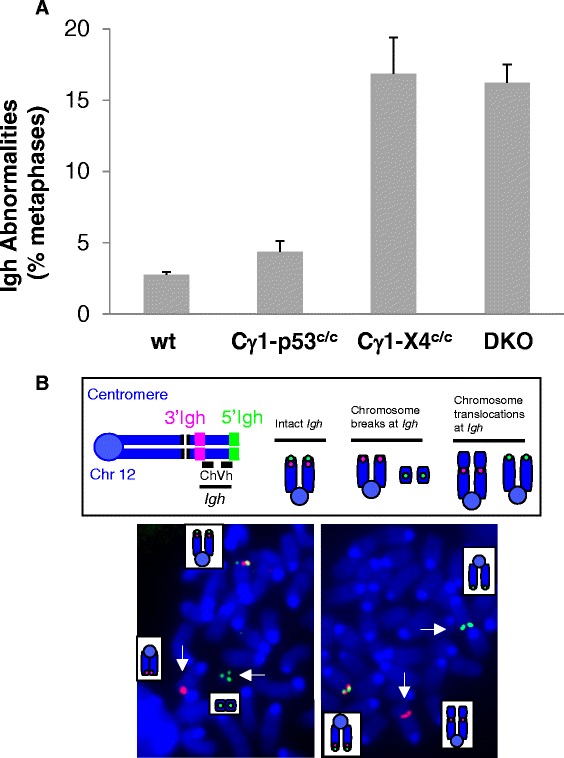
Results: We show that these NHEJ deficient lymphomas harbor translocations frequently targeting immunoglobulin (Ig) loci. Furthermore, we found that Ig translocations were associated with distinct mechanisms, probably caused by AID- or RAG-induced DSBs. Intriguingly, the AID-associated Ig loci translocations target either c-myc or Pvt-1 locus whereas the partners of RAG-associated Ig translocations scattered randomly in the genome. Lastly, these NHEJ deficient lymphomas harbor complicated genomes including segmental translocations and exhibit a high level of ongoing DNA damage and clonal heterogeneity.

Conclusions: We propose that combined NHEJ and p53 defects may serve as an underlying mechanism for a high level of genomic complexity and clonal heterogeneity in cancers.


Figures

Fig. 1
Fig. 1
Deletion of Xrcc4 but not Trp53 via Cγ1cre leads to a high level of genomic instability at the Igh locus. a Quantification of Igh abnormalities in day 4 anti-CD40/IL4-activated wt (n = 6), Cγ1-p53c/c (n = 4), Cγ1-X4c/c (n = 3), and DKO (n = 6) splenic B cells. Data are presented as mean ± s.e.m. Statistical analyses were calculated by a Student’s t test with two-tailed distribution and equal variance. p = 0.024 (control vs Cγ1-p53c/c), p = 6.78E-05 (control vs Cγ1-X4c/c), p = 1.03E-06 (control vs DKO), p = 0.805 (Cγ1-X4c/c vs DKO). b Top: Diagram of Igh metaphase FISH probes and abnormalities. An intact Igh shows co-localized red and green signals while a broken locus appears as split red and green signals. Bottom: Example of metaphase FISH showing Igh breaks indicated with white arrows
Fig. 2
Fig. 2
Establishment of the G1XP B cell lymphoma model. a Kaplan-Meier survival curve: percent survival of wt controls (n = 37) and Cγ1CreX c P c mice (n = 51) vs age in days is shown. b Southern Blot analysis of second cohort of Cγ1CreX c P c mice for JH rearrangements. G1XP lymphoma genomic DNA was employed for EcoRI digestion and hybridized with the JH4 probe. Germline (GL) bands are indicated (arrow heads). MLN stands for mesenteric lymph node. c H&E analysis of G1XP lymphomas. Left: a high level of apoptotic cells (red arrows) (objective ×40); Right: diffusely enlarged nuclei (red arrow, bottom) and salient nucleoli (red arrow, top) (objective ×63). Scale bars 50 μm
Fig. 3
Fig. 3
Analysis of CTX junctions identifies known and novel translocation partners. a A Circos plot depicts all CTXs involving Igh, Igκ, and Igλ loci. Individual chromosomes are shown as color-coded bars with specific banding patterns. The region on chr12 (in green) (114,480,000–117,249,000) is zoomed in ×400 including the Igh locus while the region on chr15 (in blue) (61,800,000–62,083,000) is zoomed in ×1600 including c-myc and Pvt1 loci. All Igh CTXs involving S or C regions are translocated to c-myc or Pvt1 locus shown as a cluster of blue lines. All other Ig CTXs involving V gene segments are translocated to various chromosomes shown as different color-coded lines. b The view within the IGV browser shows all the CTX breakpoints occurring upstream of or within c-myc 1st exon. c The location of Pvt1 translocations shown in the IGV browser. d Analysis of junction sequences of the Igh-Pvt1 translocation. Sequences from NGS are aligned with genomic sequences of mm9 with chr15 sequence in black and chr12 sequence in blue. Micro-homology at the junctions is in red and underlined
Fig. 4
Fig. 4
FISH validation of Igh locus translocations. a, b Inactivation of Xrcc4 and Trp53 via Cγ1-cre leads to reciprocal Igh-c-myc translocation in G1XP lymphoma (46 J). a Upper left: Diagram of Igh FISH probes. Bottom left: An example of metaphase Igh FISH image. An intact Igh shows co-localized red and green signals while a translocated locus appears as split red and green signals on different chromosomes (white arrow). Upper right: Diagram of c-myc FISH probes. Bottom right: An example of metaphase FISH showing c-myc locus translocation (yellow arrow) and an intact c-myc locus. b Left: A metaphase FISH image showing the t(12;15) translocation with 3′Igh (red) and 3′c-myc (green) probes juxtaposed on the derivative chr12 (white arrow). Right: A metaphase FISH image showing the t(15;12) translocation with 5′c-myc (red) and 5′Igh (green) probes juxtaposed on the derivative chr15 (yellow arrow). A normal chr12 and chr15 are also present in the metaphase. c Left: a metaphase FISH image showing the Igh locus translocations in G1XP lymphoma (119 J) with 3′ and 5′Igh probes split. Right: a metaphase FISH image showing the intact c-myc locus with 3′ and 5′ probes co-localized in the same lymphoma sample
Fig. 5
Fig. 5
G1XP lymphomas harbor segmental translocations involving Pvt1 locus. a Metaphase FISH analysis of the Igh-Pvt1 translocation in G1XP lymphoma (119 J). Top: Diagrams of Igh or Pvt1 FISH probes. Bottom left: five copies of the 5′ (green) and 3′ (red) Pvt1 probes are co-localized (yellow arrows); Bottom middle: three copies of the 3′Igh (green) and 3′Pvt1 probes are co-localized (white arrows); Bottom right: five copies of 5′Pvt1 probe (green) and two copies of 5′ Igh probe (red) are not co-localized (indicated by green or red arrows, respectively). b Quantification of Igh-Pvt1 translocations analysis in G1XP lymphoma (119 J). The number of analyzed metaphases is indicated. c Schematic map of t(15;12;15) translocation in G1XP 119 J. Chr15 is in red and the Pvt1 locus is depicted in blue line with the 5′ and 3′ flanking FISH probes indicated. The inserted region of Chr12 is in green encompassing the region from Sα (junction 2) to Sμ (junction 1) as shown in Fig. 3d. The breakpoints of Pvt1 locus are adjacent to each other in these two CTX junctions with only 143 bp deleted in the Pvt1 locus
Fig. 6
Fig. 6
G1XP lymphomas harbor ongoing DNA damage. a FACS analysis of a GC B cell marker, PNA (left panel) and γ-H2AX foci staining (right panel) for G1XP lymphomas (n = 3 per group). b Wt splenocytes were isolated from immunized mice and stained for GC B cell markers, B220 and PNA. The level of γ-H2AX foci staining was shown for naïve B cells (B220+PNAlow) and GC B cells (B220+PNAhigh). Representative FACS plots are shown from three independent experiments using independent tumor samples
Fig. 7
Fig. 7
G1XP lymphomas harbor a high level of clonal heterogeneity. a Quantification of c-myc translocations in G1XP lymphoma samples (n = 3 independent tumor samples) analyzed by metaphase FISH. We subdivide the configuration of FISH signals into three categories: Intact: green and red probes co-localized; G only: green probe only (3′ c-myc), R only: red probe only (5′ c-myc). The frequency of different configurations of FISH signals was shown from one representative sample, and at least 150 metaphases were analyzed in total for each sample. b Top: Diagram of c-myc FISH probes. Bottom: Representative c-myc translocations showing different configurations of FISH signals. Numbers in parenthesis indicate the number of FISH signals for each category. Intact: yellow arrows; G only: green arrows; R only: red arrows

References

    1. Kuppers R. Mechanisms of B-cell lymphoma pathogenesis. Nat Rev Cancer. 2005;5(4):251–262. doi: 10.1038/nrc1589. - DOI - PubMed
    1. Alt FW, Zhang Y, Meng FL, Guo C, Schwer B. Mechanisms of programmed DNA lesions and genomic instability in the immune system. Cell. 2013;152(3):417–429. doi: 10.1016/j.cell.2013.01.007. - DOI - PMC - PubMed
    1. Nussenzweig A, Nussenzweig MC. Origin of chromosomal translocations in lymphoid cancer. Cell. 2010;141(1):27–38. doi: 10.1016/j.cell.2010.03.016. - DOI - PMC - PubMed
    1. Bassing CH, Swat W, Alt FW. The mechanism and regulation of chromosomal V(D)J recombination. Cell. 2002;109(Suppl):S45–55. doi: 10.1016/S0092-8674(02)00675-X. - DOI - PubMed
    1. Dudley DD, Chaudhuri J, Bassing CH, Alt FW. Mechanism and control of V(D)J recombination versus class switch recombination: similarities and differences. Adv Immunol. 2005;86:43–112. doi: 10.1016/S0065-2776(04)86002-4. - DOI - PubMed

Publication types

MeSH terms

Substances