. 2016 Mar;115(3):1399-409.
doi: 10.1152/jn.00732.2015. Epub 2016 Jan 6.

Inhibitory stabilization and visual coding in cortical circuits with multiple interneuron subtypes

Affiliations

Inhibitory stabilization and visual coding in cortical circuits with multiple interneuron subtypes

Ashok Litwin-Kumar et al. J Neurophysiol. 2016 Mar.

Abstract

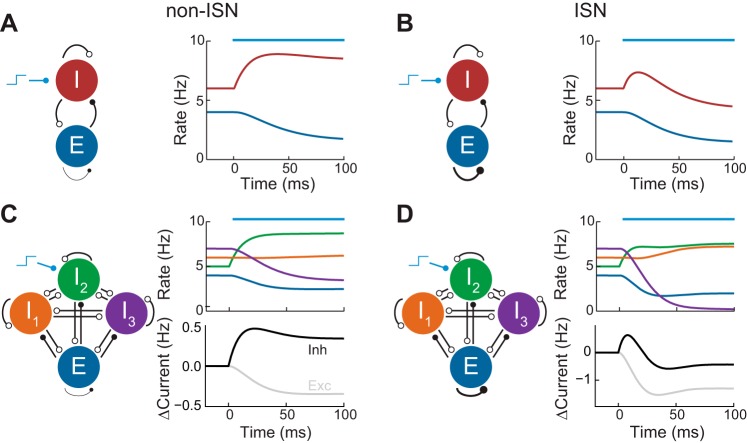
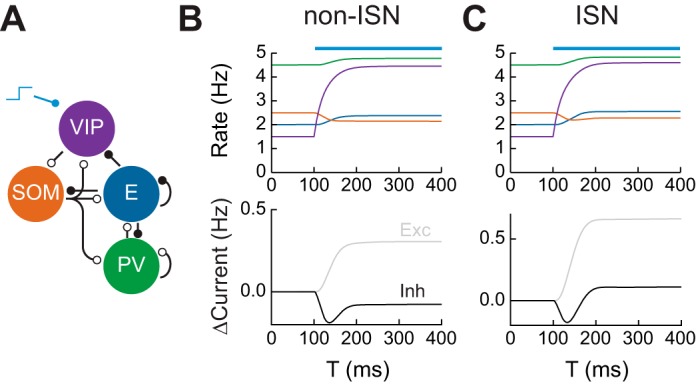
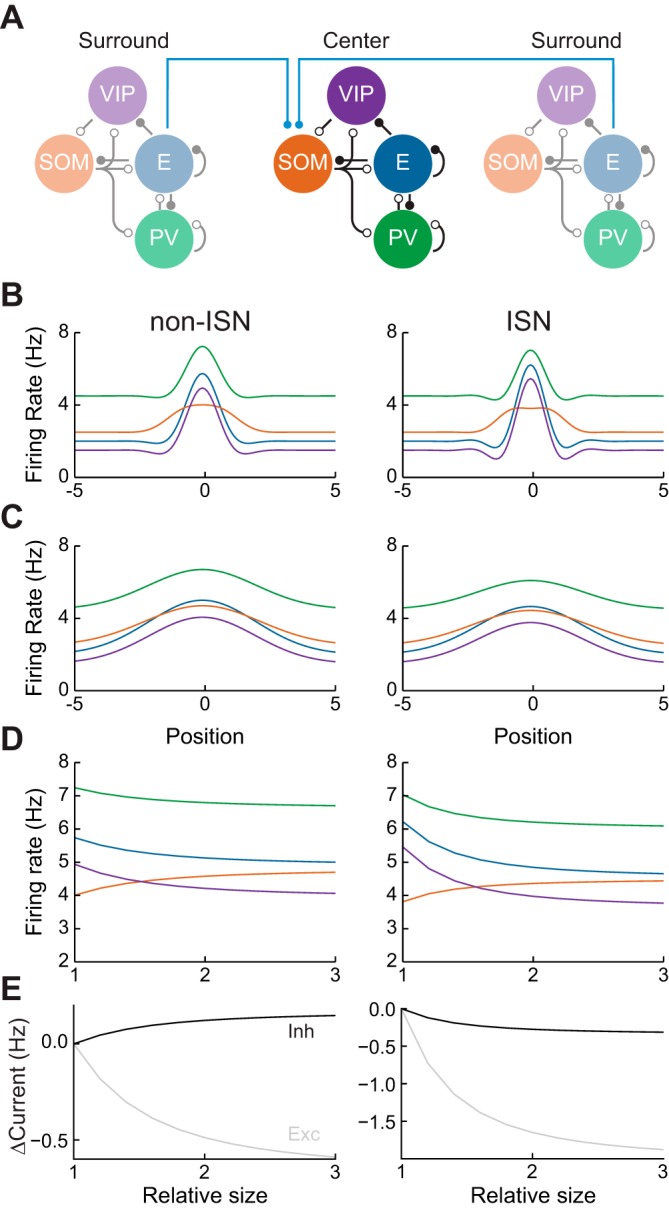
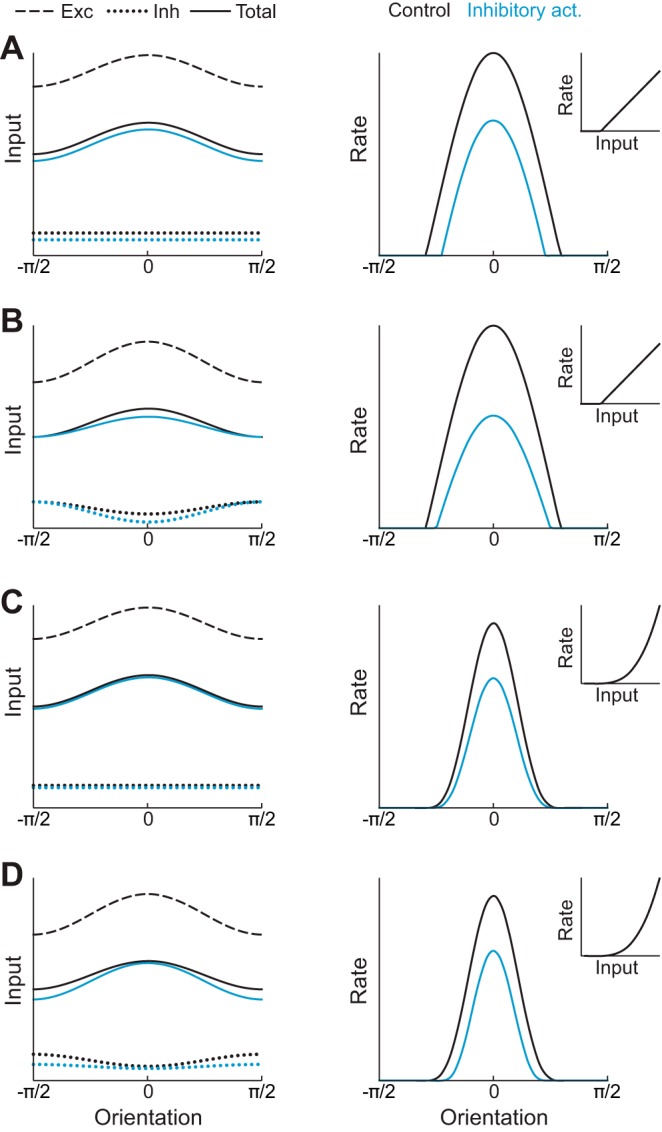
Recent anatomical and functional characterization of cortical inhibitory interneurons has highlighted the diverse computations supported by different subtypes of interneurons. However, most theoretical models of cortex do not feature multiple classes of interneurons and rather assume a single homogeneous population. We study the dynamics of recurrent excitatory-inhibitory model cortical networks with parvalbumin (PV)-, somatostatin (SOM)-, and vasointestinal peptide-expressing (VIP) interneurons, with connectivity properties motivated by experimental recordings from mouse primary visual cortex. Our theory describes conditions under which the activity of such networks is stable and how perturbations of distinct neuronal subtypes recruit changes in activity through recurrent synaptic projections. We apply these conclusions to study the roles of each interneuron subtype in disinhibition, surround suppression, and subtractive or divisive modulation of orientation tuning curves. Our calculations and simulations determine the architectural and stimulus tuning conditions under which cortical activity consistent with experiment is possible. They also lead to novel predictions concerning connectivity and network dynamics that can be tested via optogenetic manipulations. Our work demonstrates that recurrent inhibitory dynamics must be taken into account to fully understand many properties of cortical dynamics observed in experiments.

Keywords: V1; inhibition; modeling.


Figures

Fig. 1.
Fig. 1.
Inhibition stabilized networks (ISNs) and non-ISNs. A, left: schematic of non-ISN with excitatory (E) and inhibitory (I) populations. Open circles represent inhibitory synapses while closed circles represent excitatory synapses. Right: E and I population firing rates in response to a stimulus applied to the I population (blue bar). B: same as A but for an ISN in which the EE connection is strong. C, left: schematic of non-ISN with 3 inhibitory populations. Right: population firing rates and change in magnitude of the total excitatory and inhibitory currents received by the excitatory population in response to a stimulus applied to population I2 (blue bar). D: same as C but for an ISN.
Fig. 2.
Fig. 2.
Connectivity in mouse V1 and disinhibition. A: connectivity between neuronal subtypes in mouse V1. Open circles represent inhibitory synapses while closed circles represent excitatory synapses. SOM, somatostatin; PV, parvalbumin. B, top: firing rates of neuronal subpopulations in a non-ISN in response to activation of vasointestinal peptide (VIP)-expressing interneurons at T = 100 ms. Bottom: change in magnitude of total excitatory and inhibitory currents received by the excitatory subpopulation. C: same as B for an ISN.
Fig. 3.
Fig. 3.
Dynamics of surround suppression. A: surround suppression circuit. Local networks as in Fig. 2 interact via long-range projections from excitatory subpopulations to SOM subpopulations (blue lines). B: firing rates of each subpopulation as a function of distance from stimulus center, when a center stimulus is presented. C: same as B for a center + surround stimulus. D: firing rates of each neuronal subtype at the stimulus center, as a function of relative stimulus size. E: change in magnitude of total excitatory and inhibitory currents received by excitatory neurons at the stimulus center.
Fig. 4.
Fig. 4.
Possible mechanisms of division and subtraction. A, left: schematic of excitatory (dashed) and inhibitory (dotted) inputs to an E neuron and their sum (solid) as a function of orientation. Activation of inhibitory neurons increases untuned inhibition, reducing the total input (blue curves). Right: E neuron tuning curve, calculated by applying a threshold-linear function (inset) to the total input on the left. Activation of inhibitory neurons leads to subtraction of the tuning curve (blue line). B: similar to A, but with a power-law transfer function, leading to approximate division of the tuning curve. C: similar to A, but with inhibition whose tuning increases during activation, leading to approximate division of the tuning curve. D: similar to A, but with a power-law transfer function and inhibition whose tuning is reduced during activation. The total subthreshold input is both reduced and sharpened, leading to approximate subtraction of the tuning curve.
Fig. 5.
Fig. 5.
Large-scale network model of mouse V1. A: excitatory postsynaptic potentials (EPSPs) and inhibitory postsynaptic potentials (IPSPs) (bottom traces) in neuronal subtypes that are connected to a presynaptic neuron in which spikes are evoked (top traces). B: spike rasters in response to visual stimulation, in control conditions (left), with PV neuron activation (middle), and with SOM neuron activation (right).
Fig. 6.
Fig. 6.
Modulation of pyramidal neuron tuning curves by inhibitory activation in a network with tuned PV neurons. A: excitatory neuron tuning curves in control and PV/SOM-activated states. B: same as A for PV neurons. C: tuning of excitatory conductance onto excitatory neurons. D: same as C but for PV neuron conductance. E: same as C but for SOM neuron conductance. F: tuning of total inhibitory conductance onto excitatory neurons, showing decreased tuning of inhibition during SOM activation. Green, PV neuron activation; orange, SOM neuron activation.
Fig. 7.
Fig. 7.
Orientation selectivity in different networks. A, left: excitatory neuron tuning curves in control, PV neuron activation, and SOM neuron activation conditions, for the network in Fig. 6. Right: orientation selectivity index (OSI) in the 3 conditions. B: same as A for a network without tuned PV neurons. C: Same as B for a network in which excitatory neurons were modeled with 2 compartments.
Fig. 8.
Fig. 8.
Three hypotheses for the mechanism of subtraction. A: untuned inhibition leads to subtraction if excitatory f-I curves are linear. B: withdrawal of tuned PV inhibition leads to sharpening of subthreshold input and approximate subtraction if excitatory f-I curves are nonlinear. C: nonlinear dendritic integration allows untuned SOM inhibition to sharpen tuned excitatory input, leading to subtraction if excitatory f-I curves are nonlinear.

References

    1. Adesnik H, Bruns W, Taniguchi H, Huang ZJ, Scanziani M. A neural circuit for spatial summation in visual cortex. Nature 490: 226–231, 2012. - PMC - PubMed
    1. Atallah B, Bruns W, Carandini M, Scanziani M. Parvalbumin-expressing interneurons linearly transform cortical responses to visual stimuli. Neuron 73: 159–170, 2012. - PMC - PubMed
    1. Avermann M, Tomm C, Mateo C, Gerstner W, Petersen CC. Microcircuits of excitatory and inhibitory neurons in layer 2/3 of mouse barrel cortex. J Neurophysiol 107: 3116–3134, 2012. - PubMed
    1. Ayaz A, Saleem A, Schölvinck M, Carandini M. Locomotion controls spatial integration in mouse visual cortex. Curr Biol 23: 890–894, 2013. - PMC - PubMed
    1. Ben-Yishai R, Bar-Or RL, Sompolinsky H. Theory of orientation tuning in visual cortex. Proc Natl Acad Sci USA 92: 3844–3848, 1995. - PMC - PubMed

Publication types

MeSH terms

LinkOut - more resources