. 2016 Mar 15;25(6):1100-15.
doi: 10.1093/hmg/ddv633. Epub 2016 Jan 5.

α-Synuclein interferes with the ESCRT-III complex contributing to the pathogenesis of Lewy body disease

Affiliations

α-Synuclein interferes with the ESCRT-III complex contributing to the pathogenesis of Lewy body disease

Brian Spencer et al. Hum Mol Genet. .

Abstract

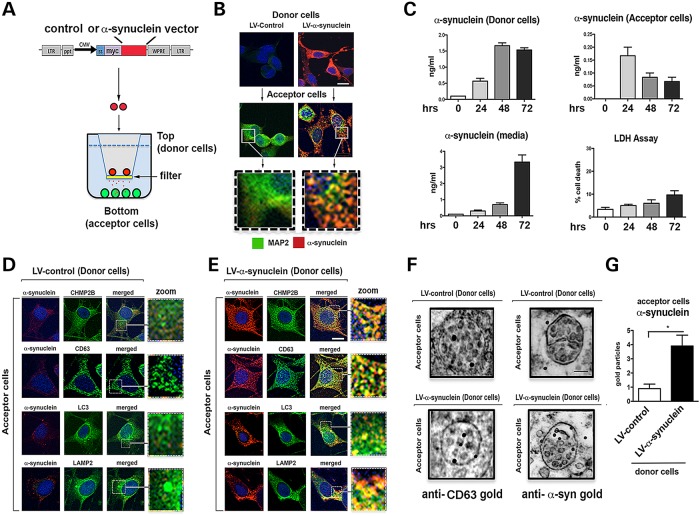
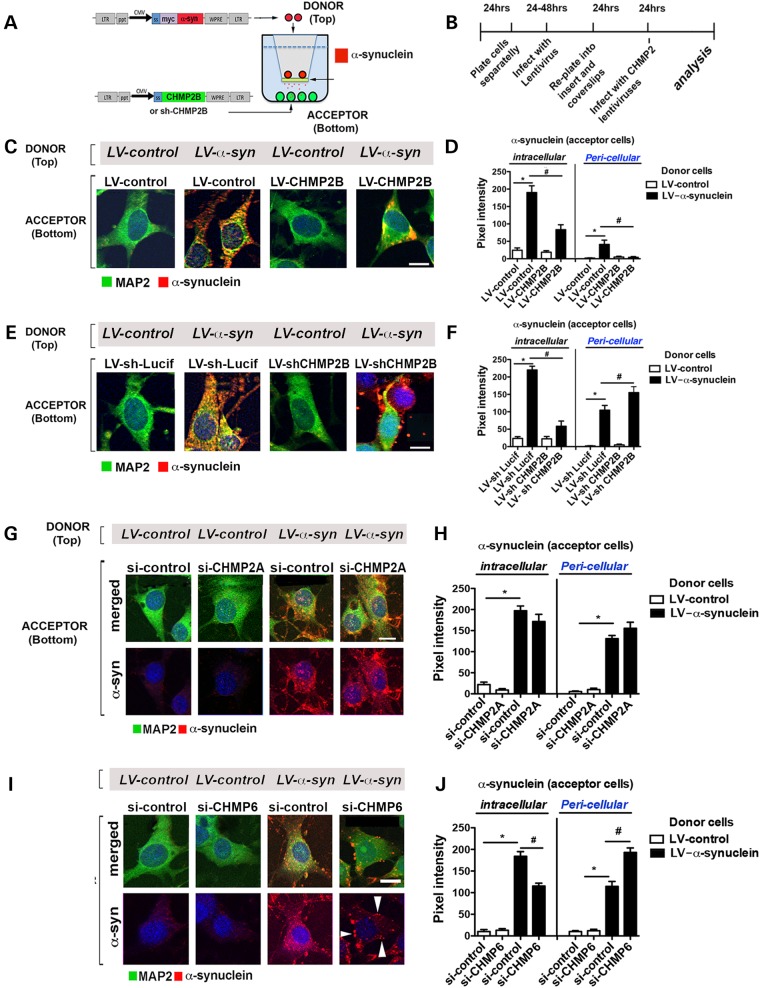
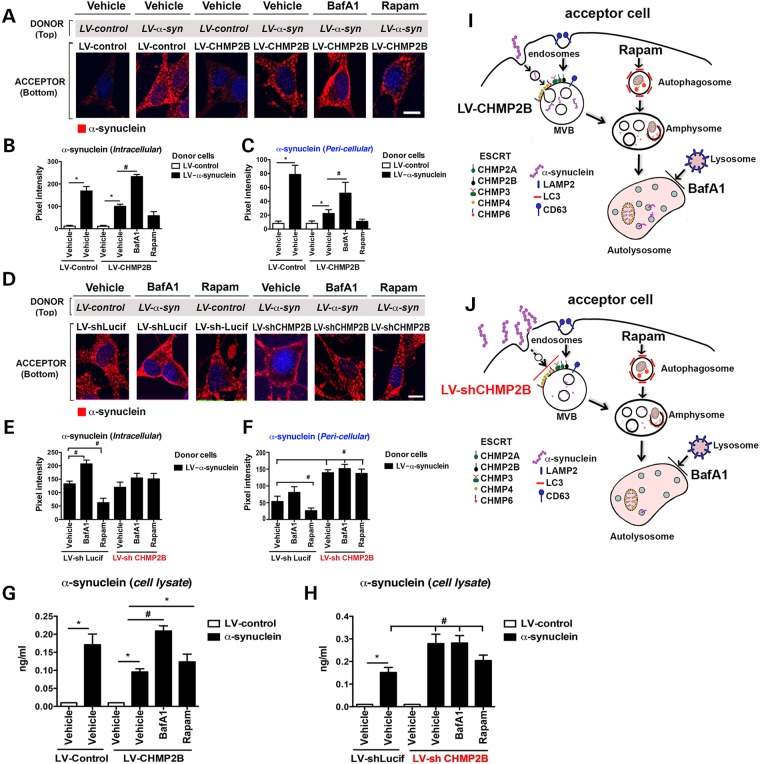
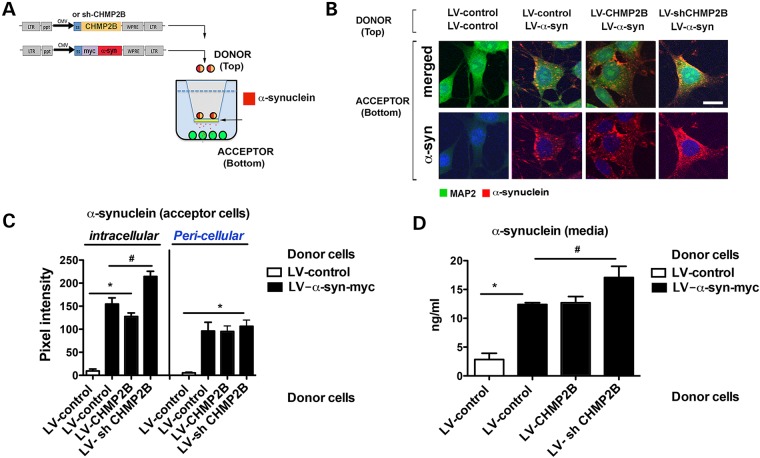
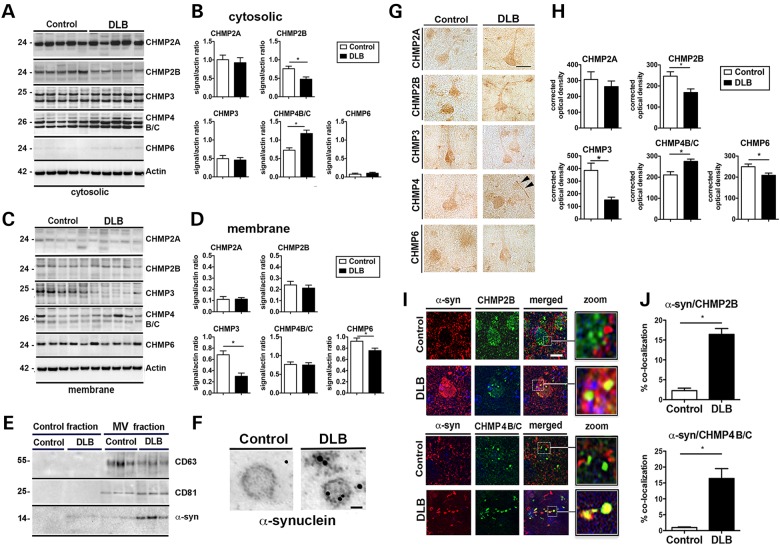
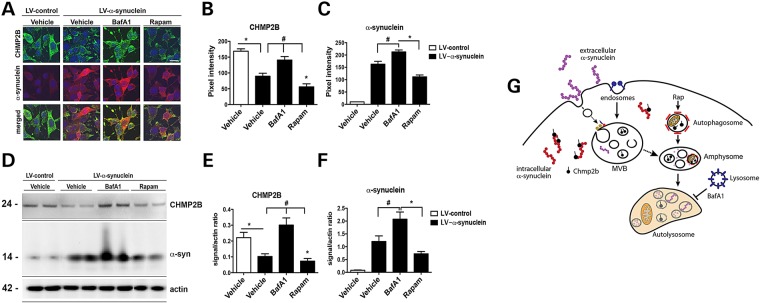
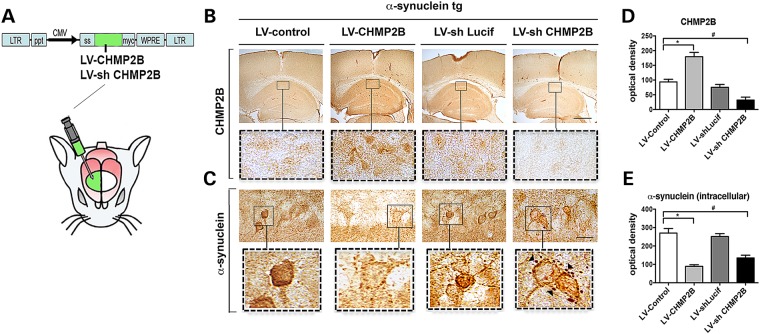
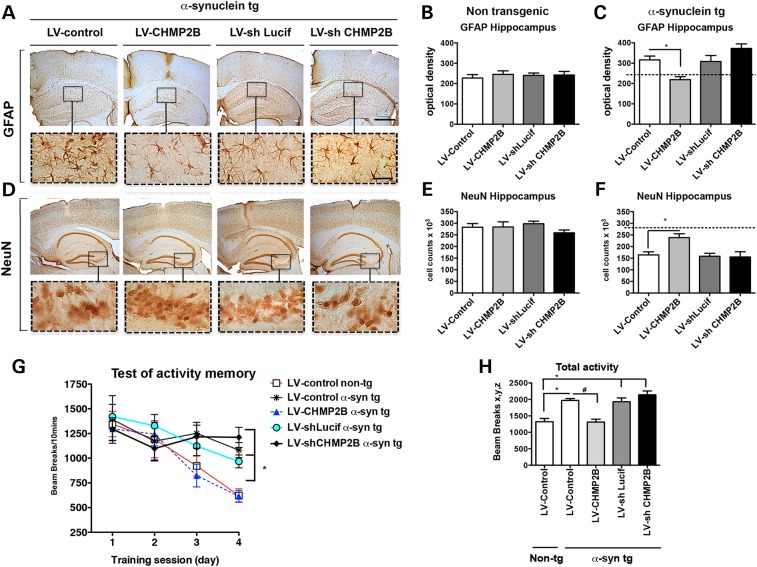
α-Synuclein (α-syn) has been implicated in neurological disorders with parkinsonism, including Parkinson's disease and Dementia with Lewy body. Recent studies have shown α-syn oligomers released from neurons can propagate from cell-to-cell in a prion-like fashion exacerbating neurodegeneration. In this study, we examined the role of the endosomal sorting complex required for transport (ESCRT) pathway on the propagation of α-syn. α-syn, which is transported via the ESCRT pathway through multivesicular bodies for degradation, can also target the degradation of the ESCRT protein-charged multivesicular body protein (CHMP2B), thus generating a roadblock of endocytosed α-syn. Disruption of the ESCRT transport system also resulted in increased exocytosis of α-syn thus potentially increasing cell-to-cell propagation of synuclein. Conversely, delivery of a lentiviral vector overexpressing CHMP2B rescued the neurodegeneration in α-syn transgenic mice. Better understanding of the mechanisms of intracellular trafficking of α-syn might be important for understanding the pathogenesis and developing new treatments for synucleinopathies.


Figures

Figure 1.
Figure 1.
Endocytosed α-syn is targeted to the MVB in an in vitro cell-to-cell transmission assay. (A) An in vitro neuronal co-culture system was devised to mimic the propagation of α-syn. B103 neuronal ‘donor cells’ infected with LV-α-syn or LV-control (red) were plated in cell culture inserts containing a 0.4 µm membrane. B103 neuronal ‘acceptor cells’ were plated on coverslips. (B) Immunohistochemistry showing α-syn protein (red) from the donor cells was secreted and taken up by acceptor cells with the neuronal protein MAP2 (green). Scale bar = 15 µm. (C) Time course of α-syn expression from the donor cells, secretion into the media, uptake by the acceptor cells and LDH release assay for cell death of donor cells (n = 4 wells for each assay). Immunohistochemistry of co-culture with donor cells infected with (D) LV-control or (E) LV-α-syn. Scale bar = 15 µm. Coverslips were stained for α-syn (red) and CHMP2B, CD63, LC3 or LAMP2 (green) as well as nuclei (DAPI, blue) (n = 3 wells for each experiment). (F) Electron microscopy of acceptor cells incubated with donor cells infected with LV-control or LV-α-syn stained with gold particle labeled anti-CD63 or anti-α-syn. Scale bar = 1 µm. (G) Quantitation of gold particles per multivesicular body (n = 3 wells for each experiment). *Statistical significance P < 0.05 compared with LV-control-infected cells. One-way ANOVA with post hoc Tukey–Krammer.
Figure 2.
Figure 2.
CHMP2B is involved in the transport of endocytosed α-syn to the MVB in an in vitro cell-to-cell transmission assay. (A) An in vitro neuronal co-culture system with B103 neuronal ‘donor cells’ infected with LV-α-syn or LV-control (red). B103 neuronal ‘acceptor cells’ infected with LV-CHMP2B, LV-control, LV-shCHMP2B, LV-shLucif or transfected with si-CHMP2A, si-CHMP6 or si-control were plated on coverslips. (B) Timeline indicating infection, co-culture and analysis protocol for the experiment. (C) Immunohistochemistry of acceptor cells infected with LV-control or LV-CHMP2B co-cultured with donor cells infected with LV-control or LV-α-syn. Coverslips were stained for α-syn (red) and MAP2 (green) as well as nuclei (DAPI, blue). (D) Coverslips were analyzed to determine levels of α-syn immunoreactivity expressed as pixel intensity. (E) Immunohistochemistry of acceptor cells infected with LV-shLucif or LV-shCHMP2B co-cultured with donor cells infected with LV-control or LV-α-syn. Coverslips were stained for α-syn (red) and MAP2 (green) as well as nuclei (DAPI, blue). (F) Coverslips were analyzed to determine levels of α-syn immunoreactivity expressed as pixel intensity. (G) Immunohistochemistry of acceptor cells (bottom) transfected with si-control or si-CHMP2A and co-cultured with donor cells (top) infected with LV-control or LV-α-syn. Coverslips were immunostained for α-syn (red) and MAP2 (green) as well as nuclei (DAPI, blue). Panels are presented as merged and split image for α-syn (red). (H) Coverslips were analyzed with ImageJ to determine levels of α-syn immunoreactivity expressed as pixel intensity in the intracellular and pericellular compartments. (I) Immunohistochemical analysis of acceptor cells (bottom) transfected with si-control or si-CHMP6 and co-cultured with donor cells (top) infected with LV-control or LV-α-syn. Coverslips were immunostained for α-syn (red) and MAP2 (green) as well as nuclei (DAPI, blue). (J) Coverslips were analyzed to determine levels of α-syn immunoreactivity expressed as pixel intensity. Scale bar = 15 µm. *Statistical significance P < 0.05 compared with co-culture with LV-control-infected donor cells. #Statistical significance P < 0.05 compared with LV-control or LV-shLucif infected or si-control transfected acceptor cells. One-way ANOVA with post hoc Tukey–Krammer (n = 3 wells for each experiment).
Figure 3.
Figure 3.
Endocytosed α-syn is transported to the autophagosome for degradation in an ESCRT-III-dependent manner. (A) Immunohistochemistry of acceptor cells infected with LV-control or LV-CHMP2B co-cultured with donor cells infected with LV-control or LV-α-syn. Cultures were then treated with BafA1, Rapamycin (Rapam) or Vehicle. Coverslips were stained for α-syn (red) and nuclei (DAPI, blue). (B and C) Coverslips were analyzed to determine levels of α-syn immunoreactivity expressed as pixel intensity. (D) Immunohistochemistry of acceptor cells infected with LV-shCHMP2B or LV-shLucif co-cultured with donor cells infected with LV-α-syn. Cultures were then treated with Baf, Rapam or Vehicle. Coverslips were stained for α-syn (red) and nuclei (DAPI, blue). (E and F) Coverslips were analyzed to determine levels of α-syn immunoreactivity expressed as pixel intensity. (G and H) Lysates from acceptor cells were assayed by electrochemical α-syn assay. (I) Model of the effects of CHMP2B overexpression on α-syn autophagy degradation. (J) Model of the effects of CHMP2B downregulation on α-syn autophagy degradation. *Indicates statistical significance P < 0.05 compared with vehicle treatment with LV-control-infected donor cells. #Statistical significance P < 0.05 compared with vehicle treatment with LV-α-syn-infected donor cells. One-way ANOVA with post hoc Tukey–Krammer (n = 3 experiments per group).
Figure 4.
Figure 4.
Effects of CHMP2B on cell-to-cell transmission of α-syn when added to donor cells. (A) The in vitro co-culture system was used with donor neuronal cell line B103 (top) infected with both LV-control or LV-α-syn and LV-CHMP2B or LV-shCHMP2B. (B) Uninfected acceptor neuronal cell line B103 (bottom) were examined by immunohistochemistry for MAP2 (green), α-syn (red) and nuclei (DAPI, blue). Panels are presented as merged and split image for α-syn (red). (C) Neuronal cells were analyzed with ImageJ to determine levels of α-syn immunoreactivity expressed as pixel intensity. (D) Supernatant from the acceptor cell chamber was assayed by electrochemical assay for α-syn. *Indicates statistical significance P < 0.05 compared with acceptor cells with LV-control only. #Statistical significance P < 0.05 compared with acceptor cells with LV-α-syn alone. One-way ANOVA with post hoc Tukey–Krammer (n = 3 experiments per condition).
Figure 5.
Figure 5.
Dysregulation of ESCRT-III proteins in DLB. Western blot analysis of (A) cytosolic and (C) membrane fractions of brain homogenates showing levels of ESCRT-III complex proteins CHMP2A, CHMP2B, CHMP3, CHMP4B/C and CHMP6 on postmortem human brain samples from control subjects and DLB patients. Densitometric analysis of (B) cytosolic and (D) membrane fraction western blots of CHMP2A, CHMP2B, CHMP3, CHMP4B/C and CHMP6 immunoreactivity analyzed as ratio to β-actin signal. (E) Microvesicles (MV) isolated from whole brain homogenates of normal or DLB patient brains were analyzed by immunoblot for the multivesicular body marker CD63 and CD81 as well as the presence of α-syn. (F) Electron microscopy of isolated MV stained with gold particle labeled anti-α-syn. Scale bar = 50 nm (n = 4 control and n = 4 DLB cases). (G) Immunohistochemical detection of CHMP2A, CHMP2B, CHMP3 and CHMP4B/C in control and DLB brains. Scale bar = 20 µm. Arrowheads indicate Lewy neurite. (H) Optical density analysis of immunohistochemical immunoreactivity. (I) Brain sections from the control subject and DLB patients were double labeled with antibodies against α-syn (red) and CHMP2B or CHMP4B/C (green) and imaged with the laser scanning confocal microscope. (J) Analysis of % of cells showing co-localization between α-syn and CHMP2B or CHMP4B/C. *Indicates statistical significance P < 0.05 compared with control subjects. One-way ANOVA with post hoc Tukey–Krammer (n = 8 control cases and n = 12 DLB cases).
Figure 6.
Figure 6.
α-syn overexpression leads to CHMP2B degradation through the autophagy pathway. B103 neuronal cells were infected with LV-α-syn or LV-control and then treated with BafA1, Rapamycin (Rapam) or vehicle (control). (A) Immunohistochemistry of fixed cells with α-syn (red), CHMP2B (green) and nuclei (DAPI, blue). Optical density analysis of immunohistochemical immunoreactivity for (B) CHMP2B and (C) α-syn is calculated as pixel intensity. (D) Representative immunoblot of B103 cells infected with LV-control of LV-α-syn and treated with BafA1, Rapam or Vehicle. Quantitative densitometry of immunoblot for (E) CHMP2B and (F) α-syn normalized to actin signal. (G) Model of intracellular α-syn affecting CHMP2B degradation and its effects on endocytosis of extracellular α-syn. *Indicates statistical significance P < 0.05 compared with LV-control-infected cells. #Statistical significance P < 0.05 compared with vehicle treated LV-α-syn-infected cells. One-way ANOVA with post hoc Tukey–Krammer (n = 3 wells for each experiment).
Figure 7.
Figure 7.
Lentivirus overexpression of CHMP2B reduces accumulation of α-syn in the α-syn tg mouse model of DLB. (A) The LV-CHMP2B, LV-Control, LV-shCHMP2B or LV-shLucif lentivirus vectors were delivered by stereotaxic injection into the hippocampus of α-syn tg mouse model of DLB. (B and D) Four weeks after injection, mice were sacrificed and brains were analyzed by immunohistochemistry and computer-aided image analysis for CHMP2B. (C and E) Brains were analyzed by immunohistochemistry for α-syn. Arrowheads indicate pericellular α-syn aggregates. *Indicates statistical significance P < 0.05 compared with treatment with LV-control. One-way ANOVA with post hoc Tukey–Krammer. Scale bar represents 200 µm in low power images and 40 µm in high power images (n = 10 mice per group).
Figure 8.
Figure 8.
Lentivirus overexpression of CHMP2B ameliorates neurodegeneration and behavior deficits in the α-syn tg mouse model of DLB. The LV-CHMP2B, LV-control, LV-shCHMP2B or LV-shLucif lentivirus vectors were delivered by stereotaxic injection to the D-line α-syn tg mouse model of DLB. Four weeks after injection, mice were sacrificed and brains were analyzed by immunohistochemistry for (A) GFAP and (D) NeuN. Insets show high power magnification of sections from the hippocampus. Optical density analysis of immunohistochemical immunoreactivity of GFAP in the hippocampus was analyzed in (B) non-tg and (C) α-syn tg mice. Stereological estimates (dissector method) of total NeuN positive neuronal counts was measured in the hippocampus of (E) non-tg and (F) α-syn tg mice. (G) Behavioral performance analysis in the context-dependent learning in an open field test. (H) Total activity on Day 4 in the open field. *Indicates statistical significance P < 0.05 compared with treatment with LV-control non-tg. #Statistical significance P < 0.05 compared with LV-control α-syn tg. One-way ANOVA with post hoc Tukey–Krammer. Scale bar represents 200 µm in low power images and 40 µm in high power images (n = 10 non-tg and tg mice per group).

Similar articles

Cited by

References

    1. Nakamura T., Lipton S.A. (2009) Cell death: protein misfolding and neurodegenerative diseases. Apoptosis, 14, 455–468. - PubMed
    1. Lee S.J., Lim H.S., Masliah E., Lee H.J. (2011) Protein aggregate spreading in neurodegenerative diseases: problems and perspectives. Neurosci. Res., 70, 339–348. - PMC - PubMed
    1. Burre J., Sharma M., Tsetsenis T., Buchman V., Etherton M.R., Sudhof T.C. (2010) Alpha-synuclein promotes SNARE-complex assembly in vivo and in vitro. Science, 329, 1663–1667. - PMC - PubMed
    1. Martin F.L., Williamson S.J., Paleologou K.E., Allsop D., El-Agnaf O.M. (2004) Alpha-synuclein and the pathogenesis of Parkinson's disease. Protein Pept. Lett., 11, 229–237. - PubMed
    1. Spillantini M.G., Schmidt M.L., Lee V.M., Trojanowski J.Q., Jakes R., Goedert M. (1997) Alpha-synuclein in Lewy bodies. Nature, 388, 839–840. - PubMed

Publication types

MeSH terms

Substances