

Proximity to Delivery Alters Insulin Sensitivity and Glucose Metabolism in Pregnant Mice
- PMID: 26740602
- PMCID: PMC4876930
- DOI: 10.2337/db15-1531
Proximity to Delivery Alters Insulin Sensitivity and Glucose Metabolism in Pregnant Mice
Abstract
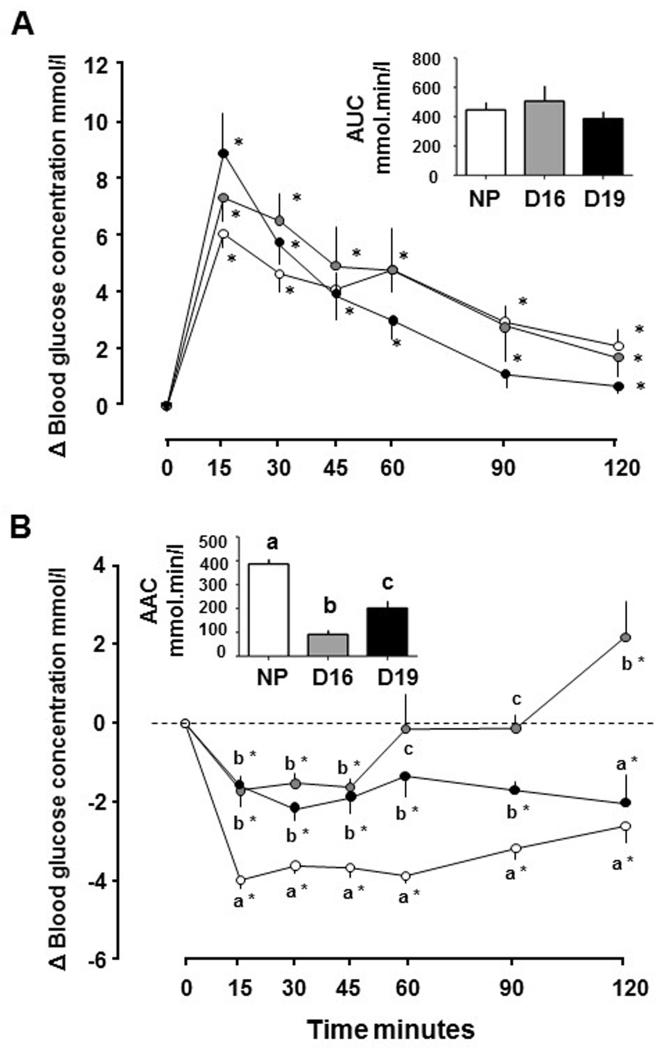
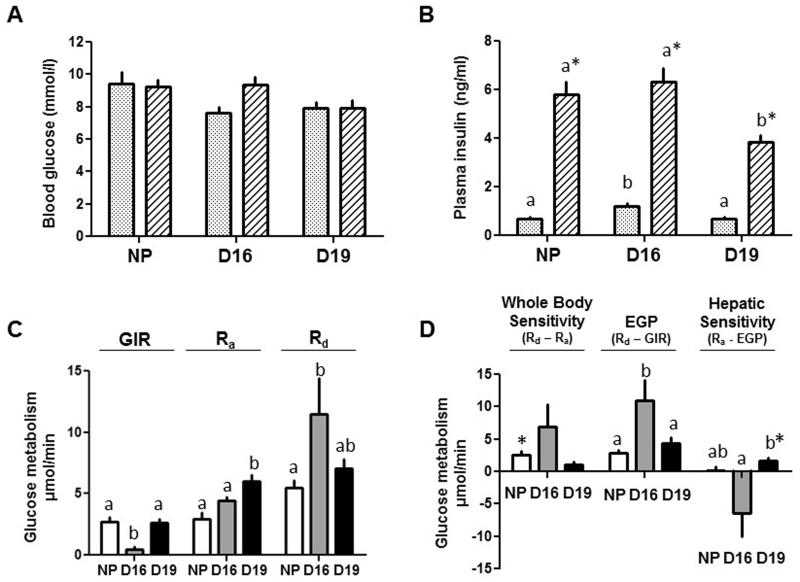
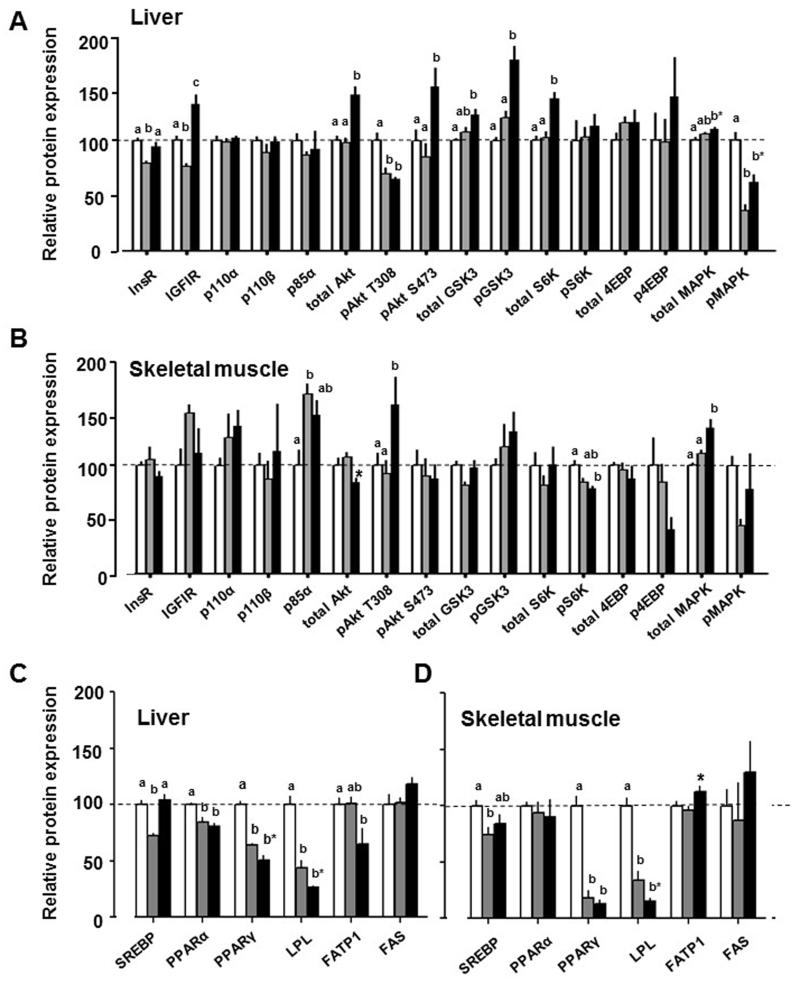
In late pregnancy, maternal insulin resistance occurs to support fetal growth, but little is known about insulin-glucose dynamics close to delivery. This study measured insulin sensitivity in mice in late pregnancy at day 16 (D16) and near term at D19. Nonpregnant (NP) and pregnant mice were assessed for metabolite and hormone concentrations, body composition by DEXA, tissue insulin signaling protein abundance by Western blotting, glucose tolerance and utilization, and insulin sensitivity using acute insulin administration and hyperinsulinemic-euglycemic clamps with [(3)H]glucose infusion. Whole-body insulin resistance occurred in D16 pregnant dams in association with basal hyperinsulinemia, insulin-resistant endogenous glucose production, and downregulation of several proteins in hepatic and skeletal muscle insulin signaling pathways relative to NP and D19 values. Insulin resistance was less pronounced at D19, with restoration of NP insulin concentrations, improved hepatic insulin sensitivity, and increased abundance of hepatic insulin signaling proteins. At D16, insulin resistance at whole-body, tissue, and molecular levels will favor fetal glucose acquisition, while improved D19 hepatic insulin sensitivity will conserve glucose for maternal use in anticipation of lactation. Tissue sensitivity to insulin, therefore, alters differentially with proximity to delivery in pregnant mice, with implications for human and other species.
© 2016 by the American Diabetes Association. Readers may use this article as long as the work is properly cited, the use is educational and not for profit, and the work is not altered.
Figures
References
-
- Di Cianni G, Micooli R, Volpe L, Lencioni C, Del Prato S. Intermediate metabolism in normal pregnancy and in gestational diabetes. Diabetes Metab Res Rev. 2003;19:259–270. - PubMed
-
- Ladyman SR, Augustine RA, Grattan DR. Hormone interactions regulating energy balance during pregnancy. J Neuroendocrinol. 2010;22:805–17. - PubMed
-
- Vejrazkova D, Vcelak J, Vankova M, Lukasova O, Halkova T, Kancheva R, Bendlova B. Steroids and insulin resistance in pregnancy. J Steroid Biochem Mol Biol. 2014;139:122–129. - PubMed
-
- López-Luna P, Muñoz T, Herrera E. Body fat in pregnant rats at mid- and late-gestation. Life Sci. 1986;39:1389–1393. - PubMed
Publication types
MeSH terms
Substances
Grants and funding
LinkOut - more resources
Full Text Sources
Other Literature Sources
Medical
Miscellaneous
