. 2016 Mar 4;291(10):5172-84.
doi: 10.1074/jbc.M115.706010. Epub 2016 Jan 6.

Use of Cysteine Trapping to Map Spatial Approximations between Residues Contributing to the Helix N-capping Motif of Secretin and Distinct Residues within Each of the Extracellular Loops of Its Receptor

Affiliations

Use of Cysteine Trapping to Map Spatial Approximations between Residues Contributing to the Helix N-capping Motif of Secretin and Distinct Residues within Each of the Extracellular Loops of Its Receptor

Maoqing Dong et al. J Biol Chem. .

Abstract

Amino-terminal regions of secretin-family peptides contain key determinants for biological activity and binding specificity, although the nature of interactions with receptors is unclear. A helix N-capping motif within this region has been postulated to directly contribute to agonist activity while also stabilizing formation of a helix extending toward the peptide carboxyl terminus and docking within the receptor amino terminus. We used cysteine trapping to systematically explore spatial approximations between cysteines replacing each residue in this motif of secretin (sec), Phe(6), Thr(7), and Leu(10), and cysteines incorporated into the extracellular face of the receptor. Each peptide was a full agonist for cAMP, but had a lower binding affinity than natural hormone. These bound to COS cells expressing 61 receptor constructs incorporating cysteines in every position along each extracellular loop (ECL) and adjacent parts of transmembrane (TM) segments. Patterns of covalent labeling were distinct for each probe, with Cys(6)-sec labeling multiple residues in the carboxyl-terminal half of ECL2 and throughout ECL3, Cys(7)-sec predominantly labeling only single residues in the carboxyl-terminal end of ECL2 and the amino-terminal end of ECL3, and Cys(10)-sec not efficiently labeling any of these residues. These spatial constraints were used to refine our model of secretin bound to its receptor, now bringing ECL3 above the amino terminus of the ligand and revealing possible charge-charge interactions between this part of secretin and receptor residues in TM5, TM6, ECL2, and ECL3, which can orient and stabilize the peptide-receptor complex. This was validated by testing predicted approximations by mutagenesis and residue-residue complementation studies.

Keywords: G protein-coupled receptor (GPCR); cell surface receptor; cyclic AMP (cAMP); gel electrophoresis; ligand-binding protein; membrane protein; molecular modeling; mutagenesis; peptides.


Figures

FIGURE 1.
FIGURE 1.
Primary structures of secretin analogues used in this study. Shown are the amino acid sequences of natural human secretin(1–27) and its analogues, each incorporating a cysteine in positions 6, 7, or 10. Natural residues are illustrated in gray, whereas modified residues are illustrated in black.
FIGURE 2.
FIGURE 2.
Functional characterization of cysteine-containing secretin analogues. Left, curves of increasing concentrations of secretin, Cys6-sec, Cys7-sec, and Cys10-sec to compete for binding of the secretin radioligand, 125I-[Tyr10]sec(1–27), to CHO-SecR cells. Values represent the percentages of saturable binding, expressed as the means ± S.E. of duplicate values from a minimum of three independent experiments. Right, concentration-dependent intracellular cAMP responses in CHO-SecR cells to each of these peptides. Data points represent the means ± S.E. of data from three independent experiments performed in duplicate normalized relative to the maximal responses to secretin in these cells.
FIGURE 3.
FIGURE 3.
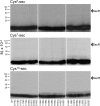
Cysteine trapping experiments with secretin receptor ECL1 cysteine mutants. Shown are typical autoradiographs of 10% SDS-PAGE gels used to separate the products of cysteine trapping of indicated ECL1 SecR mutants expressed in COS-1 cells by each of the noted cysteine-containing peptide probes. The position of electrophoretic migration of labeled SecR is identified. Because no significant receptor labeling was observed under non-reducing conditions, control autoradiographs of reducing gels that also did not show significant labeling are not shown. The signal observed at the bottom of the gel represents the radiolabeled probe that was bound to the membrane (nonspecific binding) and/or receptor (specific binding), surviving washing steps but not covalently bound to the receptor and, therefore, migrating with free probe. This signal has always been high in covalent labeling experiments with photolabile or cross-linkable radiolabeled secretin analogues, reflecting the tendency of such probes to adsorb to the membrane, yet the saturable nature of the receptor labeling has consistently been observed by competing with 0.1 μm secretin (data not shown).
FIGURE 4.
FIGURE 4.
Cysteine trapping experiments with secretin receptor ECL2 cysteine mutants. Shown are typical autoradiographs of 10% SDS-PAGE gels used to separate the products of cysteine trapping of indicated ECL2 SecR mutants expressed in COS-1 cells by each of the noted cysteine-containing peptide probes. Shown are autoradiographs of gels run in the absence (top) and presence (bottom) of the reducing agent, DTT. Shown as well is the densitometric analysis of data from three similar experiments with the Cys6-sec and Cys7-sec probes. Quantitation of covalent labeling by Cys10-sec is not shown because no significant labeling was observed with any of the mutants. The position of electrophoretic migration of probe-labeled SecR is identified, as in Fig. 3. The densitometrically determined intensities of labeling the receptor that are displayed represent the percentages of the signal for the maximal labeling of a residue within that particular loop by that probe.
FIGURE 5.
FIGURE 5.
Cysteine trapping experiments with secretin receptor ECL3 cysteine mutants. Shown are typical autoradiographs of 10% SDS-PAGE gels used to separate the products of cysteine trapping of the indicated ECL3 SecR mutants expressed in COS-1 cells by each of the noted cysteine-containing peptide probes. Shown are autoradiographs of gels run in the absence (top) and presence (bottom) of the reducing agent, DTT. Shown as well is the densitometric analysis of data from three similar experiments with the Cys6-sec and Cys7-sec probes. Quantitation of covalent labeling by Cys10-sec is not shown because no significant labeling was observed with any of the mutants. The position of electrophoretic migration of probe-labeled SecR is identified, as in Fig. 3. The densitometrically determined intensities of labeling the receptor that are displayed represent the percentages of the signal for the maximal labeling of a residue within that particular loop by that probe.
FIGURE 6.
FIGURE 6.
Illustration of receptor residues important for spatial approximation. Shown are schematic diagrams of three secretin receptor ECLs illustrating spatially approximated receptor residues for positions 7 (top row) and 6 (second row) of secretin identified in the current study and those for positions 5 (third row) and 2 (bottom row). Residues highlighted in black circles had overall labeling intensities of >50% of the maximal signal with that probe, whereas those highlighted in gray had labeling intensities of 25–50% (Table 1 and Ref. 5).
FIGURE 7.
FIGURE 7.
Predicted residue-residue spatial approximations within the secretin-occupied secretin receptor model. A, the most energetically favorable secretin-receptor model is shown. Receptor TM helices are colored red, and secretin is shown in green ribbon representation. Note the close interaction between the secretin amino terminus and ECL2, ECL3, TM5, and TM6. B, a surface representation of the secretin-receptor model is shown, and residues labeled by Cys6-sec and Cys7-sec are shaded red. C, His1 and Ser2 at the amino terminus of secretin (green CPK carbon spheres and sticks) are shown to have spatial approximation with Trp265 (ECL2), Phe337 (TM6), and Glu352 (ECL3). Trp275 was mutated as a negative control and is also highlighted. D, a salt bridge is formed between secretin Asp3 (green carbon CPK sphere and sticks) and receptor residue Arg278 (TM5). CPK, Corey-Pauling-Koltun.
FIGURE 8.
FIGURE 8.
Functional characterization of secretin receptor mutants. Left, curves for increasing concentrations of secretin to compete for binding of a constant amount of radioligand, 125I-[Tyr10]sec(1–27), in COS-1 cells transiently expressing wild type (WT) and the indicated alanine mutant secretin receptor constructs. Values represent the percentages of saturable binding, expressed as the means ± S.E. of duplicate values from a minimum of three independent experiments. Right, concentration-dependent intracellular cAMP responses in response to secretin in these cells. Data points represent the means ± S.E. of three independent experiments performed in duplicate, normalized relative to the maximal responses in these cells.
FIGURE 9.
FIGURE 9.
Complementary mutagenesis data. Left, curves for increasing concentrations of secretin (top), Cys1-sec (middle), and Cys3-sec (bottom) to compete for binding of a constant amount of radioligand, 125I-[Tyr10]sec(1–27), in COS-1 cells transiently expressing wild type (WT) and R278C mutant secretin receptor constructs. Values represent the percentages of saturable binding, expressed as the means ± S.E. of duplicate values from a minimum of three independent experiments. Right, concentration-dependent intracellular cAMP responses in response to secretin (top), Cys1-sec (middle) and Cys3-sec (bottom) in these cells. Data points represent the means ± S.E. of three independent experiments performed in duplicate, normalized relative to the maximal responses in these cells.

References

    1. Neumann J. M., Couvineau A., Murail S., Lacapère J. J., Jamin N., and Laburthe M. (2008) Class-B GPCR activation: is ligand helix-capping the key? Trends Biochem. Sci. 33, 314–319 - PubMed
    1. Miller L. J., Dong M., Harikumar K. G., and Gao F. (2007) Structural basis of natural ligand binding and activation of the Class II G-protein-coupled secretin receptor. Biochem. Soc. Trans. 35, 709–712 - PubMed
    1. Miller L. J., and Dong M. (2013) The orthosteric agonist-binding pocket in the prototypic class B G-protein-coupled secretin receptor. Biochem. Soc. Trans. 41, 154–158 - PubMed
    1. Ulrich C. D. 2nd, Holtmann M., and Miller L. J. (1998) Secretin and vasoactive intestinal peptide receptors: members of a unique family of G protein-coupled receptors. Gastroenterology 114, 382–397 - PubMed
    1. Dong M., Xu X., Ball A. M., Makhoul J. A., Lam P. C., Pinon D. I., Orry A., Sexton P. M., Abagyan R., and Miller L. J. (2012) Mapping spatial approximations between the amino terminus of secretin and each of the extracellular loops of its receptor using cysteine trapping. FASEB J. 26, 5092–5105 - PMC - PubMed

Publication types

MeSH terms