. 2016 Jan 6;36(1):65-79.
doi: 10.1523/JNEUROSCI.2126-15.2016.

Smoking-Relevant Nicotine Concentration Attenuates the Unfolded Protein Response in Dopaminergic Neurons

Affiliations

Smoking-Relevant Nicotine Concentration Attenuates the Unfolded Protein Response in Dopaminergic Neurons

Rahul Srinivasan et al. J Neurosci. .

Abstract

Retrospective epidemiological studies show an inverse correlation between susceptibility to Parkinson's disease and a person's history of tobacco use. Animal model studies suggest nicotine as a neuroprotective agent and nicotinic acetylcholine (ACh) receptors (nAChRs) as targets for neuroprotection, but the underlying neuroprotective mechanism(s) are unknown. We cultured mouse ventral midbrain neurons for 3 weeks. Ten to 20% of neurons were dopaminergic (DA), revealed by tyrosine hydroxylase (TH) immunoreactivity. We evoked mild endoplasmic reticulum (ER) stress with tunicamycin (Tu), producing modest increases in the level of nuclear ATF6, phosphorylated eukaryotic initiation factor 2α, nuclear XBP1, and the downstream proapoptotic effector nuclear C/EBP homologous protein. We incubated cultures for 2 weeks with 200 nm nicotine, the approximate steady-state concentration between cigarette smoking or vaping, or during nicotine patch use. Nicotine incubation suppressed Tu-induced ER stress and the unfolded protein response (UPR). Study of mice with fluorescent nAChR subunits showed that the cultured TH+ neurons displayed α4, α6, and β3 nAChR subunit expression and ACh-evoked currents. Gene expression profile in cultures from TH-eGFP mice showed that the TH+ neurons also express several other genes associated with DA release. Nicotine also upregulated ACh-induced currents in DA neurons by ∼2.5-fold. Thus, nicotine, at a concentration too low to activate an appreciable fraction of plasma membrane nAChRs, induces two sequelae of pharmacological chaperoning in the ER: UPR suppression and nAChR upregulation. Therefore, one mechanism of neuroprotection by nicotine is pharmacological chaperoning, leading to UPR suppression. Measuring this pathway may help in assessing neuroprotection.

Significance statement: Parkinson's disease (PD) cannot yet be cured or prevented. However, many retrospective epidemiological studies reveal that PD is diagnosed less frequently in tobacco users. Existing programs attempting to develop nicotinic drugs that might exert this apparent neuroprotective effect are asking whether agonists, antagonists, partial agonists, or channel blockers show the most promise. The underlying logic resembles the previous development of varenicline for smoking cessation. We studied whether, and how, nicotine produces neuroprotective effects in cultured dopaminergic neurons, an experimentally tractable, mechanistically revealing neuronal system. We show that nicotine, operating via nicotinic receptors, does protect these neurons against endoplasmic reticulum stress. However, the mechanism is probably "inside-out": pharmacological chaperoning in the endoplasmic reticulum. This cellular-level insight could help to guide neuroprotective strategies.

Keywords: CHOP; PERK; Parkinson's disease; XBP1; eif2alpha; neuroprotection.


Figures

Figure 1.
Figure 1.
Validation of antibodies. A, CHOP antibody staining in WT mouse ventral midbrain cultured cells that are also positive for TH (data not shown). Left, No drug. Right, Twenty hours in 3 μm Tu. The left and right graphs show the nuclear and cytoplasmic CHOP intensity, respectively. B, ATF6 antibody staining in slices from adult mouse substantia nigra. Double staining with anti-TH and anti-ATF6 shows that all DA neurons also stain for ATF6.
Figure 2.
Figure 2.
Cultured mouse DA neurons. A, Bright-field and TH-immunostained neurons from a 3-week-old WT mouse ventral midbrain culture. Left to right, Bright-field image of neurons (indicated by white arrows) growing on a glial cell monolayer, TH immunostaining of a subset of the neurons, the same image showing the extent of TH+ processes, and a merge of TH immunostaining with the bright-field image. B, At higher magnification, a flattened confocal stack of a TH-stained neuron. Left, Face on. Right, Side view. The processes are restricted to a plane near the coverslip and probably interdigitate with the glial cell monolayer.
Figure 3.
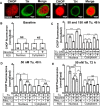
Figure 3.
Nicotine inhibits Tu-induced upregulation and nuclear translocation of CHOP in cultured DA neurons. A, Representative confocal images of DMSO-treated (three left panels) and 150 nm Tu-treated (three right panels) DA neurons. TH, CHOP staining, and a merged image are shown in each case. B, Normalized baseline CHOP fluorescence with and without nicotine treatment. C, Normalized CHOP fluorescence following treatment with 50 or 150 nm Tu with and without nicotine pretreatment. D, Normalized CHOP fluorescence following treatment with 50 nm Tu for 48 h with and without nicotine (Nic) and mecamylamine (Mec) pretreatment. E, Normalized CHOP fluorescence following treatment with 50 nm Tu for 72 h with and without nicotine and mecamylamine pretreatment. For all graphs, drugs applied and subcellular compartments (nucleus or cytoplasm) are shown on the x-axis. Nicotine (200 nm) and mecamylamine (5 μm) were applied from 7 to 21 d in culture; Tu was applied for 72 h. The number of neurons imaged is shown in each bar in the graphs. Error bars are ±SEM, and p values are based on Student's two-tailed t test with unequal variance. *p < 0.05; **p < 0.01; ***p < 0.001. NS, Not significant.
Figure 4.
Figure 4.
Nicotine inhibits Tu-induced upregulation and nuclear translocation of XBP1 and ATF6 in cultured DA neurons. A, Representative confocal images of DA neurons stained with either XBP1 or ATF6 plus either DMSO or Tu. The UPR marker is indicated for each row, and column labels indicate images with TH staining and merged images. B, Normalized baseline XBP1 fluorescence with and without nicotine treatment. C, Normalized XBP1 fluorescence following treatment with 50 nm Tu, with and without nicotine pretreatment. D, Normalized baseline ATF6 fluorescence with and without nicotine treatment. E, Normalized ATF6 fluorescence following treatment with 50 nm Tu for 48 h, with and without nicotine pretreatment. F, Normalized ATF6 fluorescence following treatment with 1 μm Tu for 24 h, with and without nicotine pretreatment. For all graphs, drugs applied and subcellular compartments (nucleus or cytoplasm) are shown on the x-axis. Nicotine (200 nm) was applied from 7 to 21 d in culture. The number of neurons imaged is shown in parentheses for each bar in the graphs. Error bars are ±SEM, and p values are based on Student's two-tailed t test with unequal variance. **p < 0.01; ***p < 0.001. NS, Not significant.
Figure 5.
Figure 5.
Nicotine inhibits Tu-induced phosphorylation of eIF2α in cultured DA neurons. A, Representative confocal images of DA neurons. Top two rows, Neurons treated with either DMSO or Tu and stained for phosphorylated eIF2α (peIF2α). Bottom, Neurons treated with DMSO and stained for total eIF2α (teIF2α). Column labels indicate images with TH staining and merged images. B, Normalized baseline total and phosphorylated eIF2α fluorescence with and without nicotine. C, Normalized phosphorylated eIF2α fluorescence following treatment with 50 nm Tu for 72 h, with and without nicotine pretreatment. D, Normalized total eIF2α fluorescence following treatment with 50 nm Tu for 72 h, with and without nicotine pretreatment. For all graphs, drugs applied and subcellular compartments (nucleus or cytoplasm) are shown on the x-axis. Nicotine (200 nm) was applied from 7 to 21 d in culture. The number of neurons imaged is shown in parentheses for each bar in the graphs. Error bars are ±SEM, and p values are based on Student's two-tailed t test with unequal variance. **p < 0.01; ***p < 0.001. NS, Not significant.
Figure 6.
Figure 6.
In Neuro-2a cells not expressing nAChRs, nicotine induced no significant changes in nuclear versus cytoplasmic localization of ATF6. A, Representative confocal images of Neuro-2a cells transfected alone with ATF6-eGFP were treated with no drug, nicotine (100 nm), Tu (100 nm), or nicotine with Tu. B, Normalized ATF6-eGFP nuclear translocation. These data were analyzed with a one-way ANOVA and Tukey comparisons. n.s., Not significant.
Figure 7.
Figure 7.
Cultured mouse DA neurons express endogenous nAChR proteins. A, Representative confocal images of neurons from an α4-mCherry knock-in mouse (two top panels) and WT mouse (two bottom panels) immunostained for TH (two left panels) and imaged for direct mCherry fluorescence (two right panels). B, Normalized direct mCherry fluorescence from an α4-mCherry knock-in mouse after 5, 10, or 20 d in culture compared to background fluorescence from a WT mouse. C, Representative confocal images of α4-mCherry knock-in mouse (two top panels) and WT mouse (two bottom panels) immunostained for TH and mCherry, showing the presence of α4-mCherry fluorescence in a subset of TH+ neurites. D, Graph comparing mCherry fluorescence in TH− and TH+ neurons from an α4-mCherry knock-in mouse after immunostaining with TH and mCherry antibodies. A WT mouse was also imaged to measure background mCherry staining. E, Representative confocal images of neurons from an α6-eGFP transgenic mouse (two top panels) and WT mouse (two bottom panels) immunostained for eGFP. The top left panel shows an eGFP+ neuron with α6-eGFP in the neurites, and the top right panel shows is a digital zoom of the eGFP+ cell body from the same neuron. Neurons from WT mice (bottom two panels) show nonspecific eGFP staining. F, Graph comparing eGFP fluorescence from α6-eGFP transgenic mice to background eGFP staining in WT mice. Scale bars are indicated for each image. The number of neurons imaged is shown in parentheses for each bar in the graphs. Error bars are ±SEM, and p values are based on Student's two-tailed t test with unequal variance. ***p < 0.001. G, Immunostaining showed that 94% of β3-GFP-positive neurons were TH positive (Fig. 6G). Nicotine (200 nm) was applied from days 7 to 21 in the nicotine-treated cultures. The number of DA neurons (TH+ and β3-GFP+) observed in culture did not significantly change after nicotine treatment.
Figure 8.
Figure 8.
Electrophysiological characterization of mouse DA neurons. A, Representative image of a 3-week-old cultured mouse ventral midbrain neuron patch clamped for whole-cell recordings. The patch and puffer pipettes are shown. B, Two left graphs show spontaneous APs in current-clamped putative dopaminergic and GABAergic neurons. Two right-hand graphs show the presence (putative dopaminergic) or absence (GABAergic) of Ih following successive −20 mV hyperpolarizing steps. C, Average APs of cultured putative dopaminergic and GABAergic neurons are superimposed for a comparison of the spike width. The putative dopaminergic neuron AP is ∼40% broader than the GABAergic AP.
Figure 9.
Figure 9.
Endogenously expressed nAChRs in cultured mouse putative DA neurons are functional and upregulate with chronic nicotine. A, Average waveforms of 300 μm ACh-evoked currents from single trials in each of nine cultured putative DA neurons belonging to either untreated or nicotine treated groups (all neurons with holding currents <250 pA are included in the average). ACh pulse, 200 ms. Black trace, Neurons without nicotine pretreatment; red trace, neurons treated with 200 nm nicotine from 7 to 21 d in culture. Average holding currents were −104 and −85 pA (saline- and nicotine-treated, respectively). The traces include a 5 mV hyperpolarizing test pulse, showing that the neurons have roughly equal average input resistance of 0.3 GΩ. B, Rare response from an untreated GABAergic neuron following a 200 ms puff of 300 μm ACh. C, Graph of average peak current amplitudes from all untreated WT and nicotine-treated WT putative DA neurons. D, E, Average waveforms of 300 μm ACh-evoked currents from single trials in putative DA neurons belonging to untreated (D) or nicotine-treated (E) groups before (black traces) and after (blue traces) application of 80 nm α-CTX MII. F, Percentage of control values from untreated and nicotine treated putative DA neurons following application of α-CTX MII. In C and F, the number of neurons measured is shown in parentheses for each bar. Error bars are ±SEM, and p values are based on Student's two-tailed t test with unequal variance. *p < 0.05.

Similar articles

Cited by

References

    1. Abramoff M, Magelhaes P, SJ R. Image processing with ImageJ. Biophotonics Int. 2004;11:36–42.
    1. Ahmadi FA, Grammatopoulos TN, Poczobutt AM, Jones SM, Snell LD, Das M, Zawada WM. Dopamine selectively sensitizes dopaminergic neurons to rotenone-induced apoptosis. Neurochem Res. 2008;33:886–901. doi: 10.1007/s11064-007-9532-5. - DOI - PubMed
    1. Belluardo N, Mudò G, Caniglia G, Cheng Q, Blum M, Fuxe K. The nicotinic acetylcholine receptor agonist ABT-594 increases FGF-2 expression in various rat brain regions. Neuroreport. 1999;10:3909–3913. doi: 10.1097/00001756-199912160-00034. - DOI - PubMed
    1. Bull VH, Thiede B. Proteome analysis of tunicamycin-induced ER stress. Electrophoresis. 2012;33:1814–1823. doi: 10.1002/elps.201100565. - DOI - PubMed
    1. Champtiaux N, Gotti C, Cordero-Erausquin M, David DJ, Przybylski C, Léna C, Clementi F, Moretti M, Rossi FM, Le Novère N, McIntosh JM, Gardier AM, Changeux JP. Subunit composition of functional nicotinic receptors in dopaminergic neurons investigated with knock-out mice. J Neurosci. 2003;23:7820–7829. - PMC - PubMed

Publication types

LinkOut - more resources