Comparative Study
. 2016 Jan 6;36(1):162-77.
doi: 10.1523/JNEUROSCI.2848-15.2016.

Hippocampal Respiration-Driven Rhythm Distinct from Theta Oscillations in Awake Mice

Affiliations
Comparative Study

Hippocampal Respiration-Driven Rhythm Distinct from Theta Oscillations in Awake Mice

Vivan Nguyen Chi et al. J Neurosci. .

Abstract

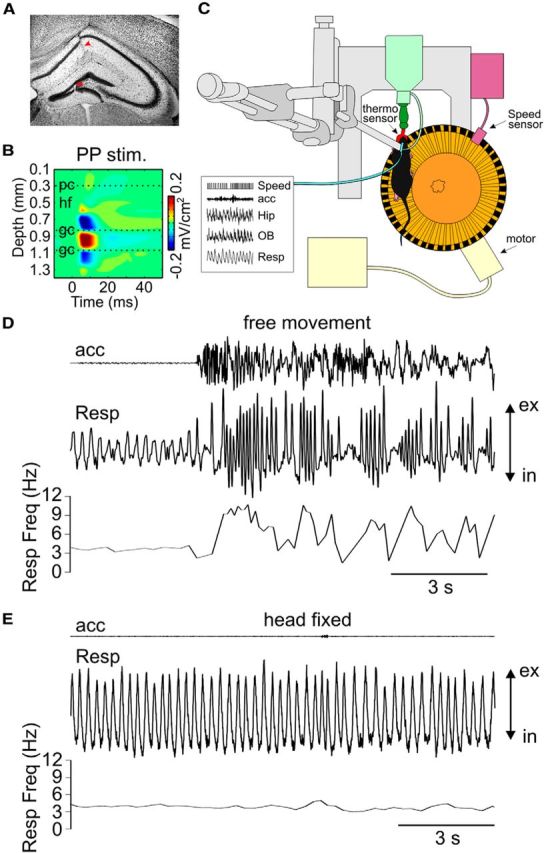
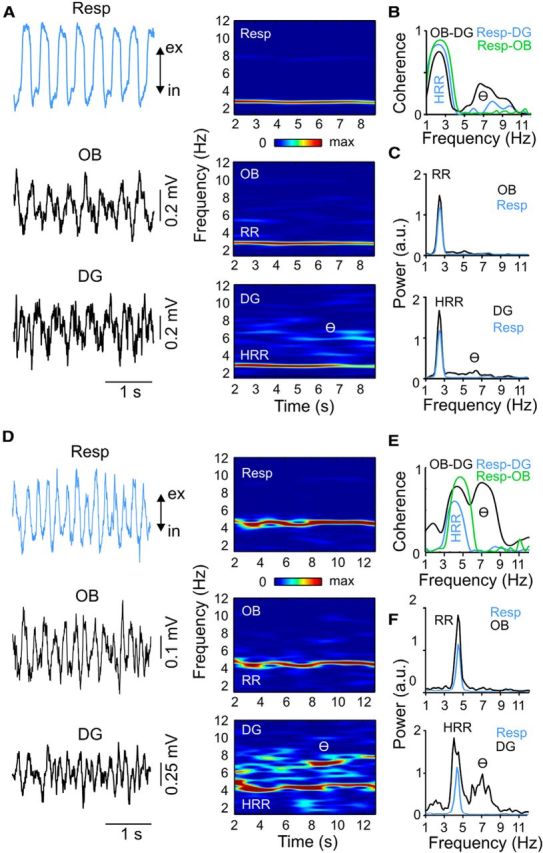
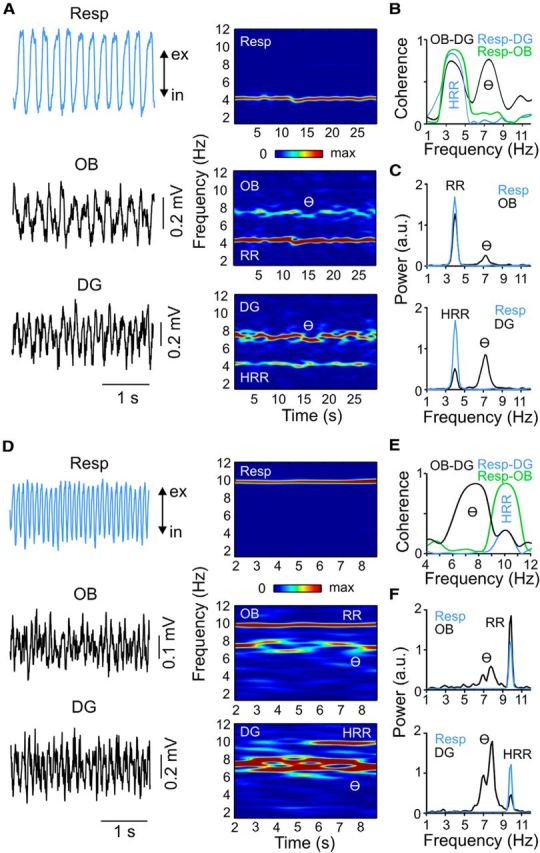
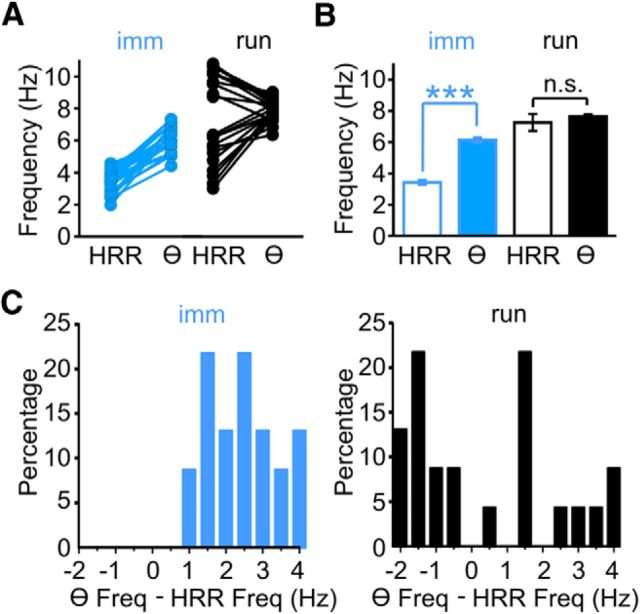
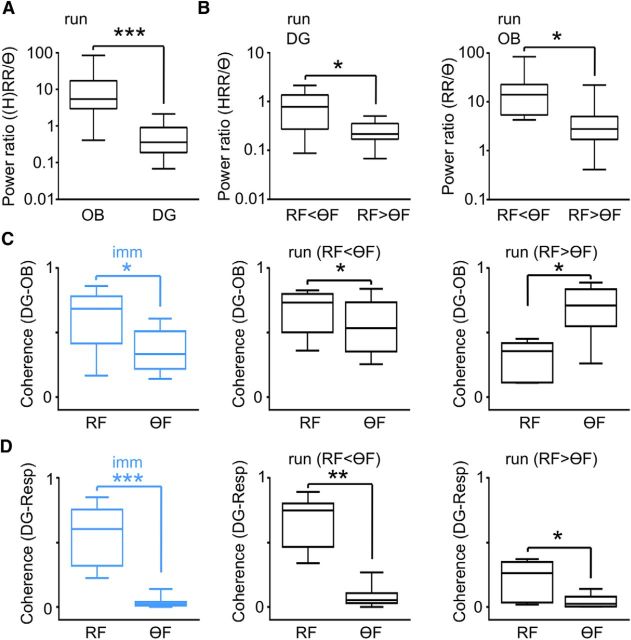
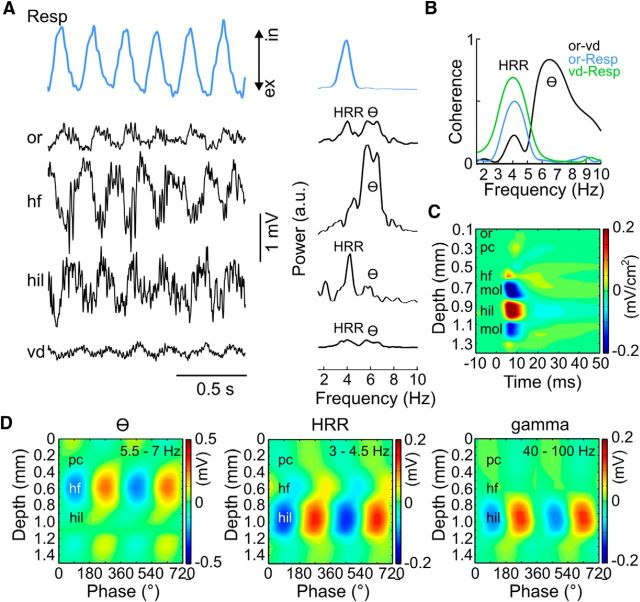
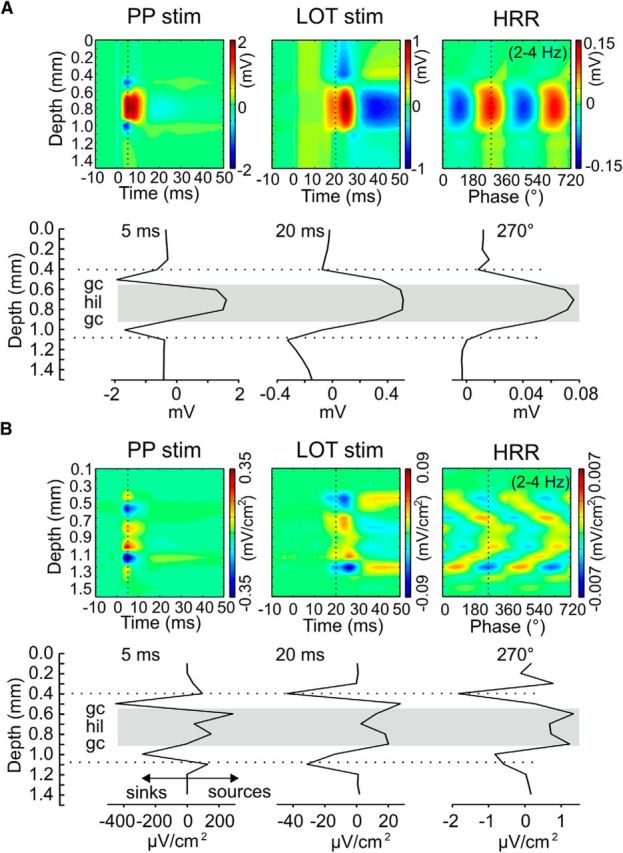
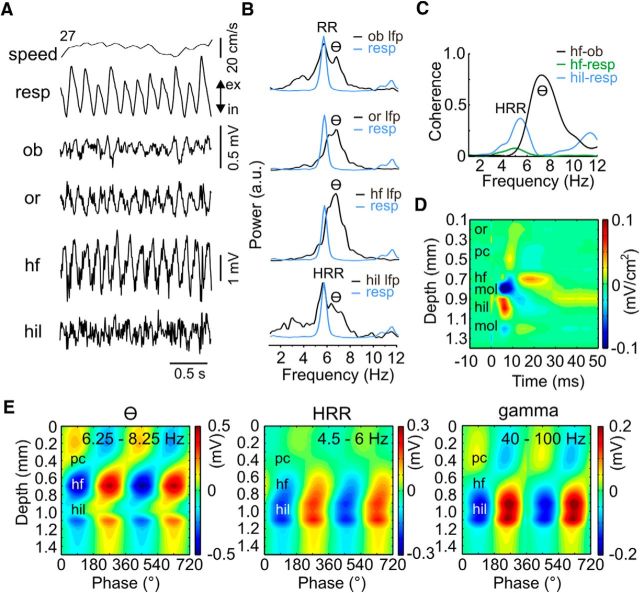
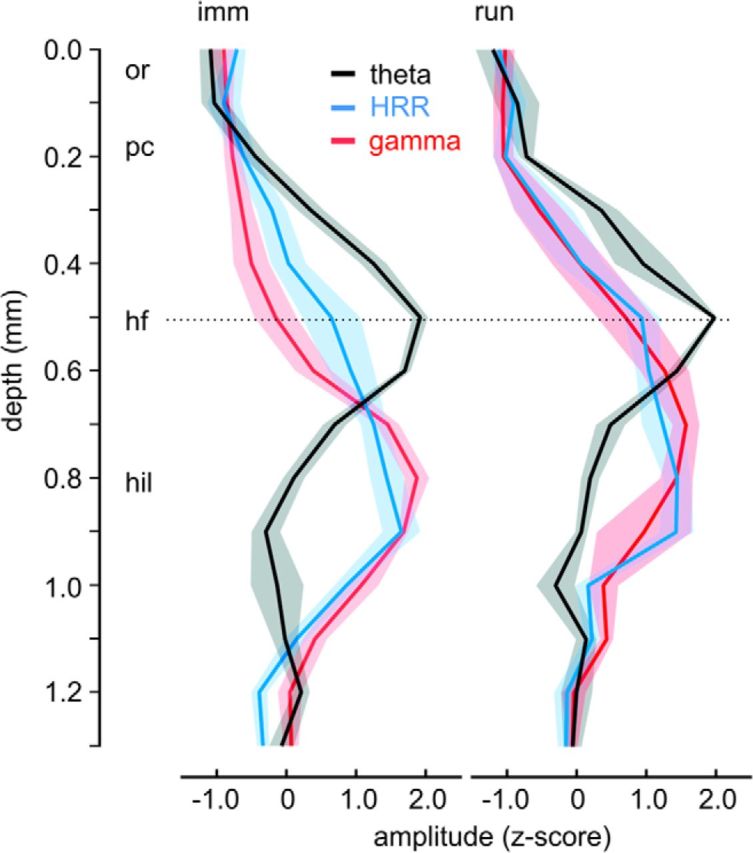
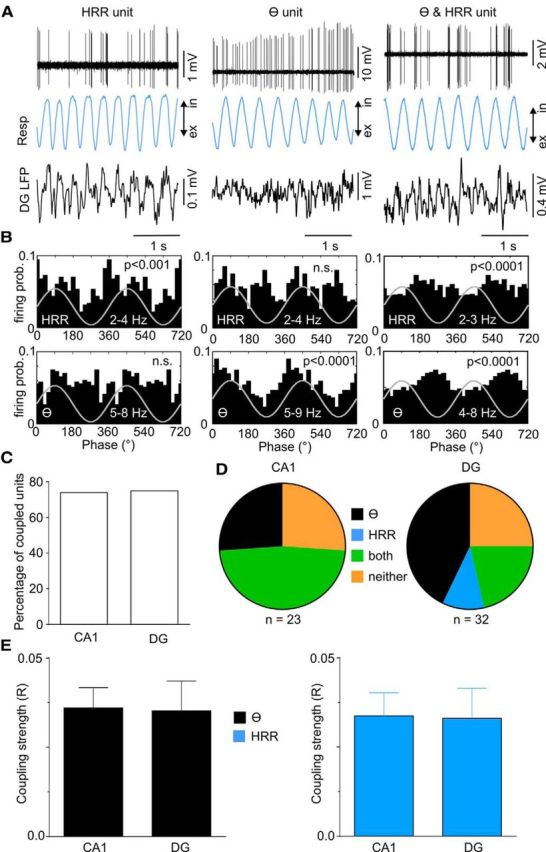
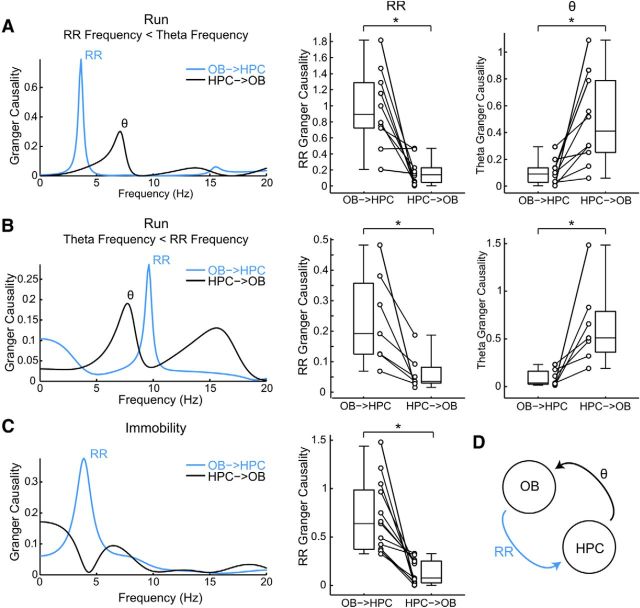
We have recently described a slow oscillation in the hippocampus of urethane-anesthetized mice, which couples to nasal respiration and is clearly distinct from co-occurring theta oscillations. Here we set out to investigate whether such type of patterned network activity, which we named "hippocampal respiration rhythm" (HRR), also occurs in awake mice. In freely moving mice, instantaneous respiration rate is extremely variable, and respiration is superimposed by bouts of sniffing. To reduce this variability, we clamped the behavior of the animal to either awake immobility or treadmill running by using a head-fixed setup while simultaneously recording respiration and field potentials from the olfactory bulb (OB) and hippocampus. Head-fixed animals often exhibited long periods of steady respiration rate during either immobility or running, which allowed for spectral and coherence analyses with a sufficient frequency resolution to sort apart respiration and theta activities. We could thus demonstrate the existence of HRR in awake animals, namely, a respiration-entrained slow rhythm with highest amplitude at the dentate gyrus. HRR was most prominent during immobility and running with respiration rates slower than theta oscillations. Nevertheless, HRR could also be faster than theta. Discharges of juxtacellularly recorded cells in CA1 and dentate gyrus were modulated by HRR and theta oscillations. Granger directionality analysis revealed that HRR is caused by the OB and that theta oscillations in OB are caused by the hippocampus. Our results suggest that respiration-coupled oscillations aid the exchange of information between olfactory and memory networks.

Significance statement: Olfaction is a major sense in rodents. In consequence, the olfactory bulb (OB) should be able to transmit information to downstream regions. Here we report potential mechanisms underlying such information transfer. We demonstrate the existence of a respiration-entrained rhythm in the hippocampus of awake mice. Frequencies of the hippocampal respiration rhythm (HRR) overlap with classical theta oscillations, but both rhythms are clearly distinct. HRR is most prominent in the dentate gyrus, especially when respiration is slower than theta frequency. Discharges of neurons in CA1 and dentate gyrus are modulated by both HRR and theta. Directionality analysis shows that HRR is caused by the OB. Our results suggest that respiration-coupled oscillations aid the exchange of information between olfactory and memory networks.

Keywords: hippocampus; mouse; olfactory bulb; oscillation; respiration; theta rhythm.


Figures

Figure 1.
Figure 1.
Simultaneous recording of motion, nasal respiration, and LFPs from the hippocampus and OB in awake mice. A, Localization of a multichannel probe inserted across the CA1-DG axis verified by histology (red arrowheads). B, Current source density analysis of LFPs in response to stimulation of perforant pathway (PP stim) used to identify anatomical landmarks. pc, Pyramidal cell layer; hf, hippocampal fissure; gc, granular cell layer. C, Setup for head-fixed experiments over a circular treadmill. An external thermocouple in front of the animal's nose records respiration. Speed is recorded during voluntary or forced running. Hip, Hippocampus; OB, olfactory bulb. D, Recordings of motion (acc: accelerometer), nasal respiration (Resp), and instantaneous frequency of respiration (Resp Freq) reveal high variability of respiration rate during free movement in the home cage. E, Stationary respiration rate during head-fixed experiments. ex, Expiration; in, inspiration.
Figure 2.
Figure 2.
Respiration-entrained rhythm in hippocampus and OB during immobility. A, D, Raw signals (left) and time-frequency power distributions (right) of respiration (Resp, blue line) and LFPs (black lines) in OB and DG during immobility with weak (A) and strong (D) theta oscillations (θ) in two representative animals. Notice, in both examples, prominent respiration-entrained rhythms in OB and DG LFPs, which are referred to as RR and HRR. ex, Expiration; in, inspiration. B, E, Coherence spectra between OB and DG LFPs (black), between Resp and DG LFP (blue), and between Resp and OB LFP (green). Notice high coherence at respiration frequency for all pairs. In addition, coherence between OB and DG also peaks at theta frequency. C, F, Power spectra for OB and DG LFPs (black) plotted along with respiration power (blue).
Figure 3.
Figure 3.
HRR can be slower or faster than theta (θ) during treadmill running depending on respiration rate. A–F, Same as in Figure 2, but for animals recorded during treadmill running. A–C, Example in which HRR is slower than theta. D–F, Example in which HRR is faster than theta. In both examples, DG and OB LFPs have coherence peaks at RR and theta frequencies, whereas coherence between respiration and either DG or OB LFP is restricted to RR frequency. ex, Expiration; in, inspiration.
Figure 4.
Figure 4.
Frequency of HRR differs between immobility and running. A, Peak frequency of HRR and theta (θ) oscillations recorded during immobility (imm, blue) and treadmill running (run, black). HRR peak frequency is less variable and lower than theta during immobility but more variable than theta during running where respiration rate may be lower, overlap, or exceed theta peak frequency. B, During immobility, average HRR peak frequency is significantly lower than average theta peak frequency (n = 23; ***p < 0.0001, paired t test). Average peak frequency of HRR and theta does not differ during running. n.s., Not significant. C, Distribution of frequency (Freq) differences between HRR and theta during immobility and running.
Figure 5.
Figure 5.
Power and coherence of HRR and theta oscillations depend on behavior. A, During running, the power ratio of RR to theta in OB is significantly larger than the ratio of HRR to theta in DG (n = 18; *p < 0.0001, Mann–Whitney test). B, The power ratios of HRR (DG LFP, left) and RR (OB LFP, right) to theta are significantly larger when respiration frequency (RF) is lower than theta frequency (θF) compared with when RF is higher than θF during running (n = 11 for RF < θF, n = 9 for RF > θF; *p < 0.05, Mann–Whitney test; for examples, see Fig. 3C,F). C, D, Coherence between DG and OB LFPs (C) and between DG LFP and respiration (D) is significantly larger at RF compared with θF during both immobility (n = 18, ***p < 0.0001, Wilcoxon signed rank test) and running when RF < θF (n = 10, **p < 0.001, Wilcoxon signed rank test). When RF > θF during running, coherence between DG and OB LFPs at θF is significantly larger than at RF (n = 7, *p < 0.05, Wilcoxon signed rank test).
Figure 6.
Figure 6.
Laminar profile of LFP oscillations across the CA1-DG axis during immobility. A, Raw signals (left) and power (right) of respiration (Resp, blue), and of LFPs from stratum oriens (or), hippocampal fissure (hf), hilus (hil), and the ventral blade of DG (vd). B, Coherence spectra between or LFP and Resp (blue), between vd LFP and Resp (green), and between or and vd LFPs (black). C, Current source density analysis of evoked LFPs to stimulation of perforant pathway indicates anatomical landmarks used for probe localization. D, Laminar voltage profiles of theta (θ, left), HRR (middle), and gamma (right). The amplitude maxima of theta and HRR occur in different layers, whereas HRR has a similar laminar profile as gamma oscillations. pc, Pyramidal cell layer; mol, molecular layer; ex, expiration; in, inspiration.
Figure 7.
Figure 7.
HRR has similar laminar profile to evoked responses after lateral olfactory tract (LOT) stimulation. A, Laminar distribution of voltage at 5 ms after perforant pathway (PP) stimulation (left), at 20 ms after LOT stimulation (middle) and at the peak (270°) of HRR (right). Polarity reversal of the responses evoked by PP stimulation correspond to the granular cell layers (gc) and identify the extent of the hilus (hil, gray area). All three laminar profiles show maximum voltage in the hilus. B, Laminar distribution of current source density. Note the precise correspondence between current sinks of HRR and induced by LOT stimulation in the outer molecular layer of the DG (dotted line).
Figure 8.
Figure 8.
Laminar profile of LFP oscillations across the CA1-DG axis during running. A, B, Raw signals (A) and power (B) of respiration (Resp, blue), and of LFPs from OB (ob), stratum oriens (or), hippocampal fissure (hf), and hilus (hil). Running speed is shown in A (top; initial speed: with 27 cm/s). C, Coherence spectra between hil LFP and Resp (blue), between hf LFP and Resp (green), and between hf and ob LFPs (black). D, Current source density analysis of evoked LFPs to stimulation of perforant pathway indicates anatomical landmarks used for probe localization. E, Laminar voltage profiles of theta (θ, left), HRR (middle), and gamma (right). Notice similar laminar profiles as found during immobility (Fig. 6), despite some mutual contamination of HRR-and theta-filtered LFPs due to the frequency overlap of HRR and theta in this example (see power spectra in B). pc, Pyramidal cell layer; mol, molecular layer; ex, expiration; in, inspiration.
Figure 9.
Figure 9.
Laminar profiles of HRR, theta and gamma (group results). Depth-voltage values were z-scored to account for 1/f and allow comparing different frequencies. Thick lines indicate the mean. Shaded areas represent SEM. For each frequency, the group averages are not significantly different (multiple t tests using the Holm–Sidak method, p > 0.05) between immobility (imm, n = 6) and running (run, n = 5). Whereas theta has the maximum at the hippocampal fissure (hf), both gamma and HRR are maximal in the hilus (hil). or, Stratum oriens; pc, pyramidal cell layer.
Figure 10.
Figure 10.
HRR modulates spiking activity in awake animals. A, Examples of juxtacellularly recorded discharges (top), respiration (Resp, blue) and DG LFP (black) for units coupled only to HRR (left), only to theta (θ, middle), or to both rhythms (right). B, Spike distribution over the phases of HRR (top) and of theta (bottom) for the same cells as in A. n.s., Not significant. C, D, Percentage of cells significantly coupled to either theta or HRR in CA1 and DG (C), and distribution of coupling selectivity (D). E, Average coupling strength to theta (black) and HRR (blue) for units recorded in CA1 and DG.
Figure 11.
Figure 11.
Directionality analysis reveals that the OB causes the RR in the hippocampus, whereas the hippocampus causes theta (θ) in OB. A, B, Left, Examples of Granger causality spectra for LFPs recorded in OB and hippocampus (HPC) during treadmill running in which RR was slower (A) or faster (B) than theta (A: n = 10, *p < 0.005 for either comparison; B: n = 7, *p < 0.05 for either comparison; Wilcoxon signed rank test). Notice in both cases a peak in OB → HPC causality at RR frequency and a peak in HPC → OB causality at theta frequency. Boxplots on right represent group results. C, Same as above but for LFP recordings during head-fixed immobility (n = 13, *p < 0.0005; Wilcoxon signed rank test; theta causality was not analyzed because not all animals exhibited theta during immobility). D, Schematic depiction of RR and theta causal influences between OB and HPC.

References

    1. Adrian ED. Olfactory reactions in the brain of the hedgehog. J Physiol. 1942;100:459–473. doi: 10.1113/jphysiol.1942.sp003955. - DOI - PMC - PubMed
    1. Agster KL, Burwell RD. Cortical efferents of the perirhinal, postrhinal, and entorhinal cortices of the rat. Hippocampus. 2009;19:1159–1186. doi: 10.1002/hipo.20578. - DOI - PMC - PubMed
    1. Amaral DG, Witter MP. The three-dimensional organization of the hippocampal formation: a review of anatomical data. Neuroscience. 1989;31:571–591. doi: 10.1016/0306-4522(89)90424-7. - DOI - PubMed
    1. Barnett L, Seth AK. The MVGC multivariate Granger causality toolbox: a new approach to Granger-causal inference. J Neurosci Methods. 2014;223:50–68. doi: 10.1016/j.jneumeth.2013.10.018. - DOI - PubMed
    1. Battaglia FP, Benchenane K, Sirota A, Pennartz CM, Wiener SI. The hippocampus: hub of brain network communication for memory. Trends Cogn Sci. 2011;15:310–318. doi: 10.1016/j.tics.2011.05.008. - DOI - PubMed

Publication types

LinkOut - more resources