. 2014 Nov 1:45:179-201.
doi: 10.1146/annurev-ecolsys-120213-091846.

The Utility of Fisher's Geometric Model in Evolutionary Genetics

Affiliations

The Utility of Fisher's Geometric Model in Evolutionary Genetics

O Tenaillon. Annu Rev Ecol Evol Syst. .

Abstract

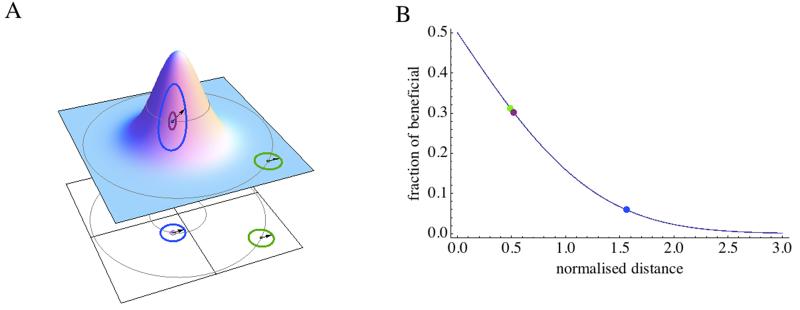
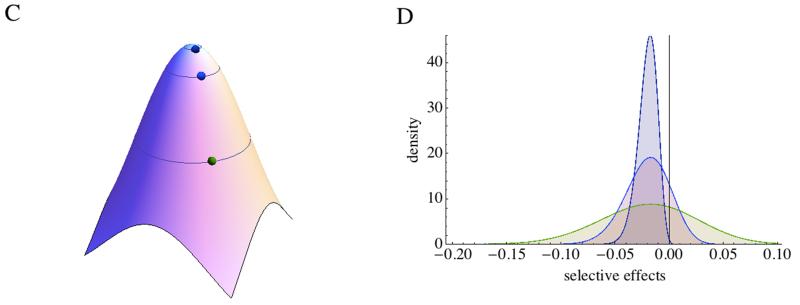
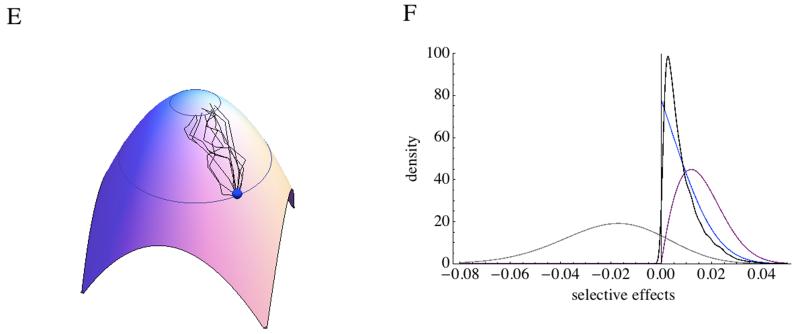
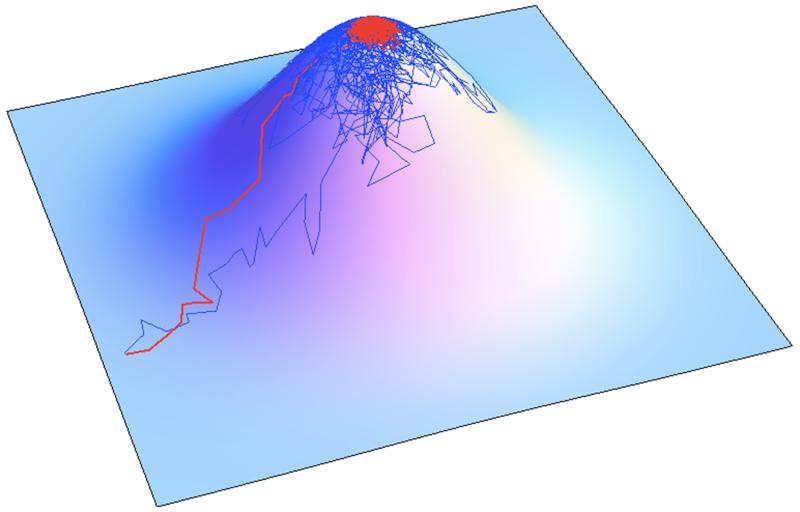
The accumulation of data on the genomic bases of adaptation has triggered renewed interest in theoretical models of adaptation. Among these models, Fisher Geometric Model (FGM) has received a lot of attention over the last two decades. FGM is based on a continuous multidimensional phenotypic landscape, but it is for the emerging properties of individual mutation effects that it is mostly used. Despite an apparent simplicity and a limited number of parameters, FGM integrates a full model of mutation and epistatic interactions that allows the study of both beneficial and deleterious mutations, and subsequently the fate of evolving populations. In this review, I present the different properties of FGM and the qualitative and quantitative support they have received from experimental evolution data. I later discuss how to estimate the different parameters of the model and outline some future directions to connect FGM and the molecular determinants of adaptation.

Keywords: Fisher’s Geometric model; adaptive landscape; distribution of fitness effects; drift load; epistasis; phenotypic complexity; pleiotropy; robustness.


Figures

Figure 1
Figure 1
A) FGM fitness landscape, with fitness on the vertical axes and below the projection on a 2D plot. Fitness decays as the phenotype moves away from the optimal phenotype. Mutation of phenotypic size r moves the phenotype on a hyper-sphere. The same mutation (arrow) may have different effects depending on the initial phenotype. B) Fraction of beneficial mutations as a function of the scaled effect of mutation x=rn2d. The points represent the situations illustrated in A, assuming a 100 dimensions. A large r (blue) is less likely to be beneficial than a small r from the same phenotype (purple) or a mutation of similar r affecting a less optimal phenotype (green). C) The distribution of mutation effects on fitness depends on the initial position of the phenotype. D) The distribution is presented for the points presented in C assuming n = 20, s=0.01 and initial log-fitness of −0.01 (purple), −0.1 (blue) and −0.5 (green). E) Ten adaptive walks moving log-fitness from −0.1 to −0.01 are presented. F) Different distribution of mutation effects produced from a phenotype of log-fitness −0.1 are presented (other parameters as in D): total mutations (Gray), beneficial mutations (Blue), beneficial mutations surviving drift (Purple), mutations fixed during adaptive walks starting from that phenotype (Black).
Figure 1
Figure 1
A) FGM fitness landscape, with fitness on the vertical axes and below the projection on a 2D plot. Fitness decays as the phenotype moves away from the optimal phenotype. Mutation of phenotypic size r moves the phenotype on a hyper-sphere. The same mutation (arrow) may have different effects depending on the initial phenotype. B) Fraction of beneficial mutations as a function of the scaled effect of mutation x=rn2d. The points represent the situations illustrated in A, assuming a 100 dimensions. A large r (blue) is less likely to be beneficial than a small r from the same phenotype (purple) or a mutation of similar r affecting a less optimal phenotype (green). C) The distribution of mutation effects on fitness depends on the initial position of the phenotype. D) The distribution is presented for the points presented in C assuming n = 20, s=0.01 and initial log-fitness of −0.01 (purple), −0.1 (blue) and −0.5 (green). E) Ten adaptive walks moving log-fitness from −0.1 to −0.01 are presented. F) Different distribution of mutation effects produced from a phenotype of log-fitness −0.1 are presented (other parameters as in D): total mutations (Gray), beneficial mutations (Blue), beneficial mutations surviving drift (Purple), mutations fixed during adaptive walks starting from that phenotype (Black).
Figure 2
Figure 2
Populations evolve toward some mutation-selection-drift-equilibrium depending on their population size. Here the adaptive walks are presented starting from a non-optimal phenotypes, one with a population size of 5 (Blue) and another one of 100 (Red).

References

    1. Acevedo A, Brodsky L, Andino R. Mutational and fitness landscapes of an rna virus revealed through population sequencing. Nature. 2014;505(7485):686–90. - PMC - PubMed
    1. Achaz G, Rodriguez-Verdugo A, Gaut BS, Tenaillon O. The reproducibility of adaptation in the light of experimental evolution with whole genome sequencing. In: Landry CR, Aubin-Horth N, editors. Ecological Genomics. Springer; Netherlands: 2014. pp. 211–31. - PubMed
    1. Atwood KC, Schneider LK, Ryan FJ. Periodic selection in escherichia coli. Proc Natl Acad Sci U A. 1951;37(3):146–55. - PMC - PubMed
    1. Barrick JE, Kauth MR, Strelioff CC, Lenski RE. Escherichia coli rpob mutants have increased evolvability in proportion to their fitness defects. Mol Biol Evol. 2010;27(6):1338–47. - PMC - PubMed
    1. Barrick JE, Lenski RE. Genome dynamics during experimental evolution. Nat. Rev. Genet. 2013;14(12):827–39. - PMC - PubMed

LinkOut - more resources