

Polygenic analysis and targeted improvement of the complex trait of high acetic acid tolerance in the yeast Saccharomyces cerevisiae
- PMID: 26740819
- PMCID: PMC4702306
- DOI: 10.1186/s13068-015-0421-x
Polygenic analysis and targeted improvement of the complex trait of high acetic acid tolerance in the yeast Saccharomyces cerevisiae
Abstract
Background: Acetic acid is one of the major inhibitors in lignocellulose hydrolysates used for the production of second-generation bioethanol. Although several genes have been identified in laboratory yeast strains that are required for tolerance to acetic acid, the genetic basis of the high acetic acid tolerance naturally present in some Saccharomyces cerevisiae strains is unknown. Identification of its polygenic basis may allow improvement of acetic acid tolerance in yeast strains used for second-generation bioethanol production by precise genome editing, minimizing the risk of negatively affecting other industrially important properties of the yeast.
Results: Haploid segregants of a strain with unusually high acetic acid tolerance and a reference industrial strain were used as superior and inferior parent strain, respectively. After crossing of the parent strains, QTL mapping using the SNP variant frequency determined by pooled-segregant whole-genome sequence analysis revealed two major QTLs. All F1 segregants were then submitted to multiple rounds of random inbreeding and the superior F7 segregants were submitted to the same analysis, further refined by sequencing of individual segregants and bioinformatics analysis taking into account the relative acetic acid tolerance of the segregants. This resulted in disappearance in the QTL mapping with the F7 segregants of a major F1 QTL, in which we identified HAA1, a known regulator of high acetic acid tolerance, as a true causative allele. Novel genes determining high acetic acid tolerance, GLO1, DOT5, CUP2, and a previously identified component, VMA7, were identified as causative alleles in the second major F1 QTL and in three newly appearing F7 QTLs, respectively. The superior HAA1 allele contained a unique single point mutation that significantly improved acetic acid tolerance under industrially relevant conditions when inserted into an industrial yeast strain for second-generation bioethanol production.
Conclusions: This work reveals the polygenic basis of high acetic acid tolerance in S. cerevisiae in unprecedented detail. It also shows for the first time that a single strain can harbor different sets of causative genes able to establish the same polygenic trait. The superior alleles identified can be used successfully for improvement of acetic acid tolerance in industrial yeast strains.
Keywords: Acetic acid tolerance; Bioethanol production; Inbreeding; Polygenic analysis; Pooled-segregant whole-genome sequence analysis; QTL mapping; Saccharomyces cerevisiae.
Figures

 ), 0.4 % (v/v) (
 ), 0.5 % (v/v) (
 ), 0.6 % (v/v) (
 ), 0.7 % (v/v) (
 ), 0.8 % (v/v) (
 ), 0.9 % (v/v) (
 ), 1.0 % (v/v) (
 ). Data points are the average of duplicate measurements; error bars represent the maximum deviation of the average
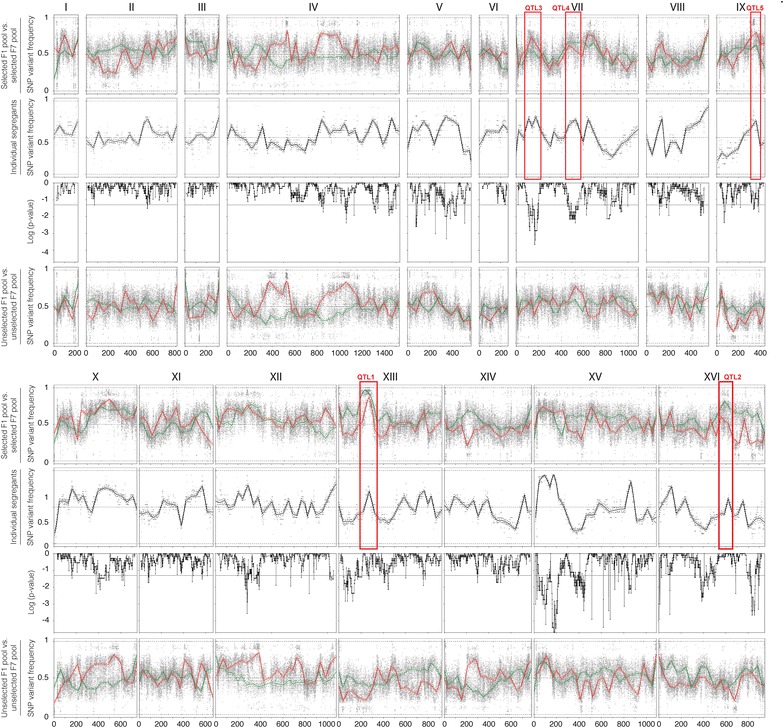
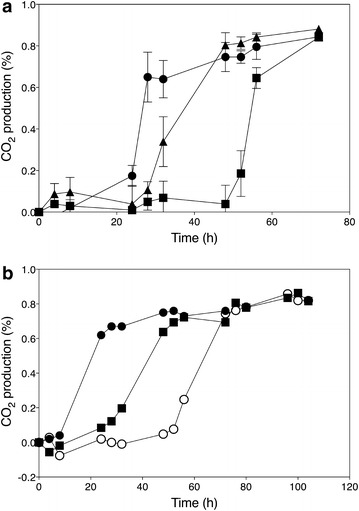 ); ER18 × 16D haa1Δ (); ER18 × 16D (). Data points are the average of duplicate measurements. Error bars represent the maximum deviation of the average. b. Fermentation profiles of the strains 16D (), ER18 (), and ER18-HAA1 () (ER18 in which the complete HAA1 gene with promoter, ORF and terminator, was replaced by the HAA1 allele from 16D) in YPD medium with 2 % glucose and supplemented with 0.6 % (v/v) acetic acid at pH 4.0
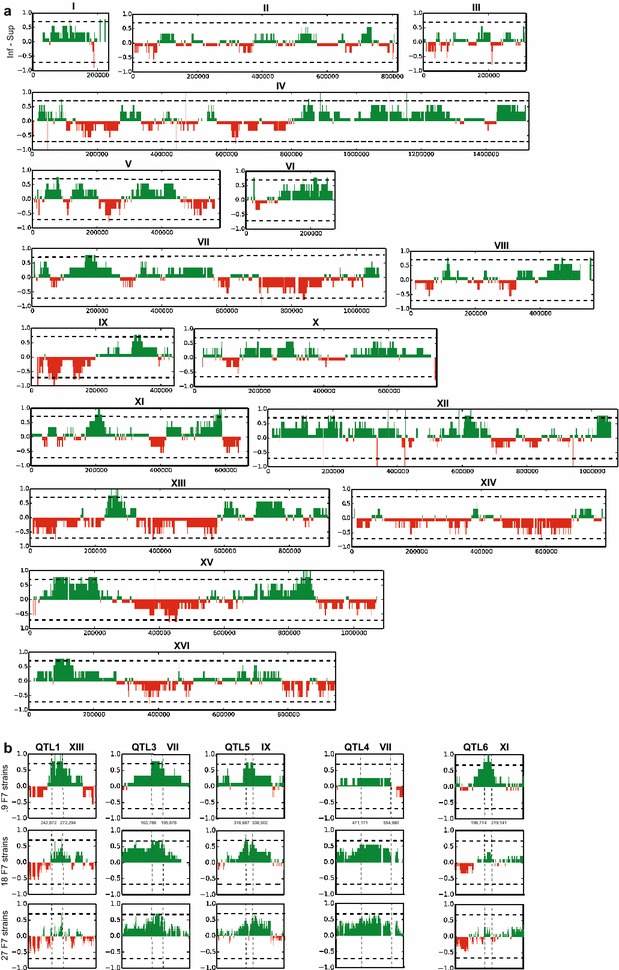
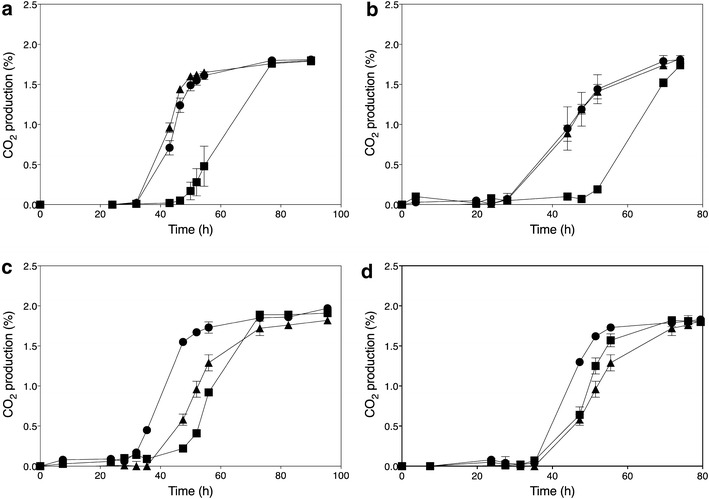 ); ER18 × 16Dgene∆ (); ER18 × 16D (). Data points are the average of duplicate measurements. Error bars represent the maximum deviation of the average
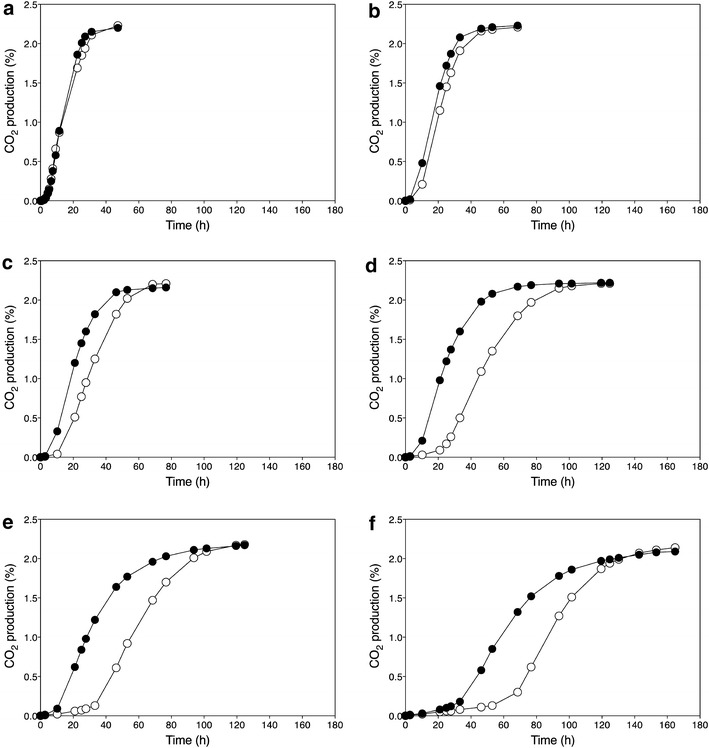 ) and GSE16-T18-HAA1* (). a No acetic acid; b 1.0 % acetic acid; c 1.2 % acetic acid; d 1.4 % acetic acid; e 1.6 % acetic acid; f 2.0 % acetic acid
Similar articles
-
Polygenic analysis of very high acetic acid tolerance in the yeast Saccharomyces cerevisiae reveals a complex genetic background and several new causative alleles.Biotechnol Biofuels. 2020 Jul 16;13:126. doi: 10.1186/s13068-020-01761-5. eCollection 2020. Biotechnol Biofuels. 2020. PMID: 32695222 Free PMC article.
-
Polygenic Analysis of Tolerance to Carbon Dioxide Inhibition of Isoamyl Acetate "Banana" Flavor Production in Yeast Reveals MDS3 as Major Causative Gene.Appl Environ Microbiol. 2022 Sep 22;88(18):e0081422. doi: 10.1128/aem.00814-22. Epub 2022 Sep 8. Appl Environ Microbiol. 2022. PMID: 36073947 Free PMC article.
-
Identification of novel causative genes determining the complex trait of high ethanol tolerance in yeast using pooled-segregant whole-genome sequence analysis.Genome Res. 2012 May;22(5):975-84. doi: 10.1101/gr.131698.111. Epub 2012 Mar 7. Genome Res. 2012. PMID: 22399573 Free PMC article.
-
Omics analysis of acetic acid tolerance in Saccharomyces cerevisiae.World J Microbiol Biotechnol. 2017 May;33(5):94. doi: 10.1007/s11274-017-2259-9. Epub 2017 Apr 12. World J Microbiol Biotechnol. 2017. PMID: 28405910 Review.
-
[Advances in functional genomics studies underlying acetic acid tolerance of Saccharomyces cerevisiae].Sheng Wu Gong Cheng Xue Bao. 2014 Mar;30(3):368-80. Sheng Wu Gong Cheng Xue Bao. 2014. PMID: 25007573 Review. Chinese.
Cited by
-
EXPLoRA-web: linkage analysis of quantitative trait loci using bulk segregant analysis.Nucleic Acids Res. 2016 Jul 8;44(W1):W142-6. doi: 10.1093/nar/gkw298. Epub 2016 Apr 21. Nucleic Acids Res. 2016. PMID: 27105844 Free PMC article.
-
The Dark Side of the pollen: BSA-seq identified genomic regions linked to male sterility in globe artichoke.BMC Plant Biol. 2024 May 17;24(1):415. doi: 10.1186/s12870-024-05119-z. BMC Plant Biol. 2024. PMID: 38760683 Free PMC article.
-
Acetic acid stress in budding yeast: From molecular mechanisms to applications.Yeast. 2021 Jul;38(7):391-400. doi: 10.1002/yea.3651. Epub 2021 May 27. Yeast. 2021. PMID: 34000094 Free PMC article. Review.
-
The Zygosaccharomyces bailii transcription factor Haa1 is required for acetic acid and copper stress responses suggesting subfunctionalization of the ancestral bifunctional protein Haa1/Cup2.BMC Genomics. 2017 Jan 13;18(1):75. doi: 10.1186/s12864-016-3443-2. BMC Genomics. 2017. PMID: 28086780 Free PMC article.
-
Mechanisms underlying lactic acid tolerance and its influence on lactic acid production in Saccharomyces cerevisiae.Microb Cell. 2021 Apr 14;8(6):111-130. doi: 10.15698/mic2021.06.751. Microb Cell. 2021. PMID: 34055965 Free PMC article. Review.
References
-
- Taherzadeh MJ, Niklasson C, Lidén G. Acetic acid—friend of foe in anaerobic batch conversion of glucose to ethanol by Saccharomyces cerevisiae. Chem Eng Sci. 1997;52:2653–2659. doi: 10.1016/S0009-2509(97)00080-8. - DOI
-
- Almeida JRM, Modig T, Petersson A, Hahn-Hagerdal B, Lidén G, Gorwa-Grausland MF. Increased tolerance and conversion of inhibitors in lignocellulosic hydrolysates by Saccharomyces cerevisiae. J Chem Technol Biotechnol. 2007;82:340–349. doi: 10.1002/jctb.1676. - DOI
LinkOut - more resources
Full Text Sources
Other Literature Sources
Molecular Biology Databases
Research Materials
Miscellaneous
