

Abnormal white matter properties in adolescent girls with anorexia nervosa
- PMID: 26740918
- PMCID: PMC4644248
- DOI: 10.1016/j.nicl.2015.10.008
Abnormal white matter properties in adolescent girls with anorexia nervosa
Abstract
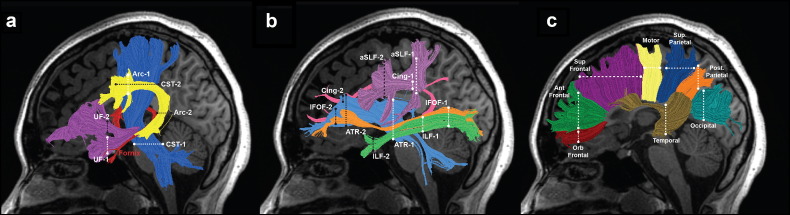
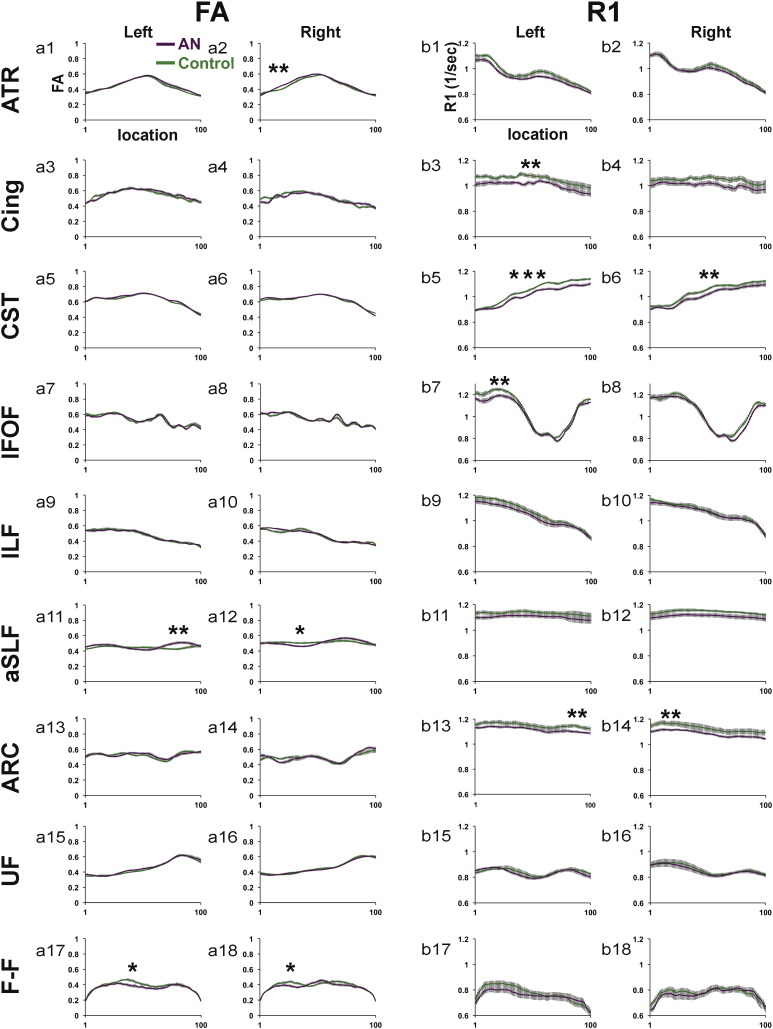
Anorexia nervosa (AN) is a serious eating disorder that typically emerges during adolescence and occurs most frequently in females. To date, very few studies have investigated the possible impact of AN on white matter tissue properties during adolescence, when white matter is still developing. The present study evaluated white matter tissue properties in adolescent girls with AN using diffusion MRI with tractography and T1 relaxometry to measure R1 (1/T1), an index of myelin content. Fifteen adolescent girls with AN (mean age = 16.6 years ± 1.4) were compared to fifteen age-matched girls with normal weight and eating behaviors (mean age = 17.1 years ± 1.3). We identified and segmented 9 bilateral cerebral tracts (18) and 8 callosal fiber tracts in each participant's brain (26 total). Tract profiles were generated by computing measures for fractional anisotropy (FA) and R1 along the trajectory of each tract. Compared to controls, FA in the AN group was significantly decreased in 4 of 26 white matter tracts and significantly increased in 2 of 26 white matter tracts. R1 was significantly decreased in the AN group compared to controls in 11 of 26 white matter tracts. Reduced FA in combination with reduced R1 suggests that the observed white matter differences in AN are likely due to reductions in myelin content. For the majority of tracts, group differences in FA and R1 did not occur within the same tract. The present findings have important implications for understanding the neurobiological factors underlying white matter changes associated with AN and invite further investigations examining associations between white matter properties and specific physiological, cognitive, social, or emotional functions affected in AN.
Keywords: Adolescents; Anorexia-nervosa; Diffusion; Quantitative MRI; White matter.
Figures

Similar articles
-
Greater Insula White Matter Fiber Connectivity in Women Recovered from Anorexia Nervosa.Neuropsychopharmacology. 2016 Jan;41(2):498-507. doi: 10.1038/npp.2015.172. Epub 2015 Jun 16. Neuropsychopharmacology. 2016. PMID: 26076832 Free PMC article.
-
Disruption of brain white matter microstructure in women with anorexia nervosa.J Psychiatry Neurosci. 2014 Nov;39(6):367-75. doi: 10.1503/jpn.130135. J Psychiatry Neurosci. 2014. PMID: 24913136 Free PMC article.
-
White matter abnormalities in treatment-naive adolescents at the earliest stages of Anorexia Nervosa: A diffusion tensor imaging study.Psychiatry Res Neuroimaging. 2017 Aug 30;266:138-145. doi: 10.1016/j.pscychresns.2017.06.011. Epub 2017 Jun 20. Psychiatry Res Neuroimaging. 2017. PMID: 28666248
-
White matter alterations in anorexia nervosa: Evidence from a voxel-based meta-analysis.Neurosci Biobehav Rev. 2019 May;100:285-295. doi: 10.1016/j.neubiorev.2019.03.002. Epub 2019 Mar 6. Neurosci Biobehav Rev. 2019. PMID: 30851283 Review.
-
Altered thalamo–cortical and occipital–parietal– temporal–frontal white matter connections in patients with anorexia and bulimia nervosa: a systematic review of diffusion tensor imaging studies.J Psychiatry Neurosci. 2019 Sep 1;44(5):324-339. doi: 10.1503/jpn.180121. J Psychiatry Neurosci. 2019. PMID: 30994310 Free PMC article.
Cited by
-
Track-weighted imaging methods: extracting information from a streamlines tractogram.MAGMA. 2017 Aug;30(4):317-335. doi: 10.1007/s10334-017-0608-1. Epub 2017 Feb 8. MAGMA. 2017. PMID: 28181027 Review.
-
Left and Right Arcuate Fasciculi Are Uniquely Related to Word Reading Skills in Chinese-English Bilingual Children.Neurobiol Lang (Camb). 2022 Feb 10;3(1):109-131. doi: 10.1162/nol_a_00051. eCollection 2022. Neurobiol Lang (Camb). 2022. PMID: 37215330 Free PMC article.
-
White matter microstructural changes in adolescent anorexia nervosa including an exploratory longitudinal study.Neuroimage Clin. 2016 Apr 12;11:614-621. doi: 10.1016/j.nicl.2016.04.002. eCollection 2016. Neuroimage Clin. 2016. PMID: 27182488 Free PMC article.
-
Extend, Pathomechanism and Clinical Consequences of Brain Volume Changes in Anorexia Nervosa.Curr Neuropharmacol. 2018;16(8):1164-1173. doi: 10.2174/1570159X15666171109145651. Curr Neuropharmacol. 2018. PMID: 29119931 Free PMC article. Review.
-
Comparison of manual and automated fiber quantification tractography in patients with temporal lobe epilepsy.Neuroimage Clin. 2019;24:102024. doi: 10.1016/j.nicl.2019.102024. Epub 2019 Oct 17. Neuroimage Clin. 2019. PMID: 31670154 Free PMC article.
References
-
- Aboitiz F., Scheibel A.B., Fisher R.S., Zaidel E. Fiber composition of the human corpus callosum. Brain Res. 1992;598:143–153. - PubMed
-
- American Psychiatric Association . APA; Washington, D.C.: 2000. Diagnostic and Statistical Manual of Mental Disorders: DSM-IV.
-
- American Psychiatric Association . 5th ed. American Psychiatric Association; Arlington: 2013. Diagnostic and Statistical Manual of Mental Disorders: DSM-5.
-
- Arcelus J., Mitchell A.J., Wales J., Nielsen S. Mortality rates in patients with anorexia nervosa and other eating disorders. A meta-analysis of 36 studies. Arch. Gen. Psychiatry. 2011;68(7):724–731. - PubMed
-
- Avants B., Gee J.C. Geodesic estimation for large deformation anatomical shape averaging and interpolation. Neuroimage. 2004;23(Suppl. 1):S139–S150. - PubMed
Publication types
MeSH terms
Grants and funding
LinkOut - more resources
Full Text Sources
Other Literature Sources
