. 2015 Sep 1;1(5):550-569.
doi: 10.1016/j.jcmgh.2015.06.007.

Spontaneous Pancreatitis Caused by Tissue-Specific Gene Ablation of Hhex in Mice

Affiliations

Spontaneous Pancreatitis Caused by Tissue-Specific Gene Ablation of Hhex in Mice

Mark J Ferreira et al. Cell Mol Gastroenterol Hepatol. .

Abstract

Background & aims: Perturbations in pancreatic ductal bicarbonate secretion cause chronic pancreatitis. The physiologic mechanism of ductal secretion is known, but its transcriptional control is not. We determine the role of the transcription factor hematopoietically expressed homeobox protein (Hhex) in ductal secretion and pancreatitis.

Methods: We derived mice with pancreas-specific, Cremediated Hhex gene ablation to determine the requirement of Hhex in the pancreatic duct in early life and in adult stages. Histologic and immunostaining analyses were used to detect the presence of pathology. Pancreatic primary ductal cells were isolated to discover differentially expressed transcripts upon acute Hhex ablation on a cell autonomous level.

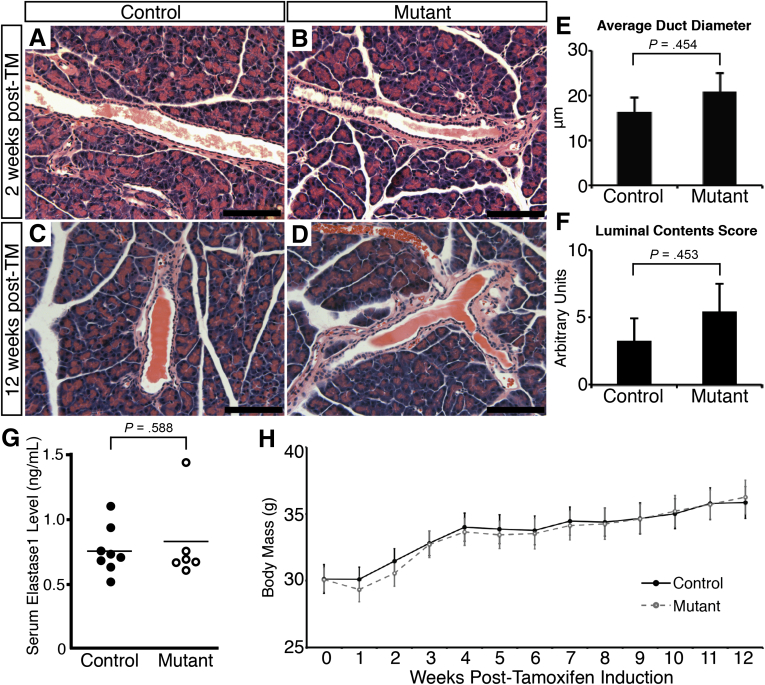
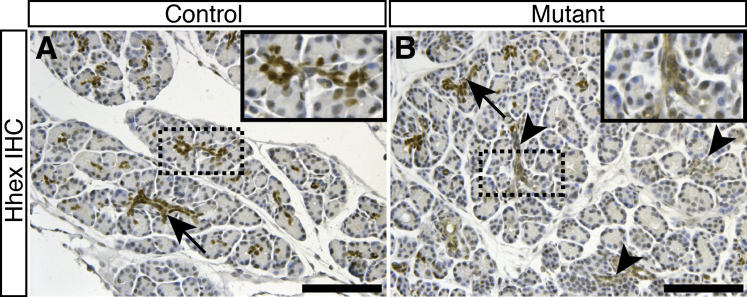
Results: Hhex protein was detected throughout the embryonic and adult ductal trees. Ablation of Hhex in pancreatic progenitors resulted in postnatal ductal ectasia associated with acinar-to-ductal metaplasia, a progressive phenotype that ultimately resulted in chronic pancreatitis. Hhex ablation in adult mice, however, did not cause any detectable pathology. Ductal ectasia in young mice did not result from perturbation of expression of Hnf6, Hnf1β, or the primary cilia genes. RNA-seq analysis of Hhex-ablated pancreatic primary ductal cells showed mRNA levels of the G-protein coupled receptor natriuretic peptide receptor 3 (Npr3), implicated in paracrine signaling, up-regulated by 4.70-fold.

Conclusions: Although Hhex is dispensable for ductal cell function in the adult, ablation of Hhex in pancreatic progenitors results in pancreatitis. Our data highlight the critical role of Hhex in maintaining ductal homeostasis in early life and support ductal hypersecretion as a novel etiology of pediatric chronic pancreatitis.

Keywords: Npr3; Pancreatic Ducts; Primary Cilia.


Figures

Figure 1
Figure 1
Hhex is expressed throughout embryonic and mature ducts. (AD) Hhex (A, D, red) is expressed in the Sox9+ (C, D, blue) pancreatic epithelium at E13.5, yet excluded from Ngn3+ endocrine progenitors (B, D, green). Several Ngn3+ cells are outlined (AC). (EG) Immunohistochemical staining for Hhex expression (brown) in the adult pancreas: (E) intercalated duct, (F) intralobular duct, (G) interlobar/main duct. Scale bars: 50 μm.
Figure 2
Figure 2
Ablation of Hhex in pancreatic progenitors results in chronic pancreatitis. (A, B) Representative H&E images of 18-week-old control (HhexloxP/loxP) and mutant (HhexloxP/loxP;Pdx1-CreEarly) pancreata (n = 3). (A) Ducts of control pancreata (arrows) are of typical caliber and consist of simple cuboidal epithelium (inset). (B) Mutant ducts display tortuous, ectatic ducts (arrowheads and inset) with parenchymal fibrosis (red asterisks). (C) Average numbers of lymphocytes and neutrophils were quantified from 20 random 40× fields (per animal) of control (HhexloxP/loxP, n = 3) and mutant (HhexloxP/loxP;Pdx1-CreEarly, n = 3) pancreata based on cell morphology. Mutant pancreata averaged 11.9 lymphocytes and 2.1 neutrophils per field, compared with 1.0 and 0.15, respectively, in controls. (D, E) Trichrome staining highlights periductal and interstitial fibrosis in mutant pancreata (red asterisks). (F) Measurement of plasma elastase-1 levels by enzyme-linked immunosorbent assay indicate an approximate 4.2-fold elevation in 8-week-old mutants (n = 4, mean 2.8 ng/mL) compared with age-matched controls (n = 3, mean 0.65 ng/mL). Mean of each group is indicated. Scale bars: 400 μm; *P < .05, **P < .01, ***P < .001, Student t test. Insets: magnification, 400×.
Figure 3
Figure 3
Efficient Hhex ablation in HhexloxP/loxP;Sox9-CreERT2mice. (A) Schematic of tamoxifen induction in 9- to 12-week-old mice. (BD) Representative Hhex immunohistochemistry at 2 weeks after induction. (B) Littermate controls (HhexloxP/loxP, n = 4) exhibit ducts with nuclear Hhex expression (black arrow). (C, D) In mutant mice (HhexloxP/loxP;Sox9-CreERT2, n = 6), rare escape cells were detected (black arrow); 95.7% ± 0.8% of duct cells do not express Hhex (black arrowheads) whereas Hhex expression was retained within δ-cells (red arrowheads). Scale bars: 50 μm.
Figure 4
Figure 4
Hhex is not required for maintenance of exocrine compartment homeostasis in the mature pancreas. (AD) Representative H&E images from littermate control (HhexloxP/loxP, n ≥ 4 animals for each time point) and mutant pancreata (HhexloxP/loxP;Sox9-CreERT2, n ≥ 6 animals for each time point) display indistinguishable histology at 2 weeks (A, B) and 12 weeks (C, D) after induction. Scale bars: 100 μm. (E) Control (n = 4, mean 16.4 ± 3.1 μm) and mutant (n = 6, mean 20.9 ± 4.1 μm) pancreata exhibit similar ductal diameter 2 weeks after induction (P = .454, Student t test). Data are presented as the mean of the average diameter of each animal for each genotype ± standard error of the mean. (F) Grading of luminal contents (0–10) indicated no statistically significant difference between control (n = 4, mean 3.25 ± 1.70) and mutant (n = 6, mean 5.5 ± 2.01) pancreata 2 weeks after induction (P = .453, Student t test). (G) Similar levels of elastase-1 were detected by enzyme-linked immunosorbent assay in serum of control (n = 8, mean 0.74 ng/mL) and mutant (n = 6, mean 0.83 ng/mL) male mice 10 weeks after induction (P = .588, Student t test). The mean of each group is indicated. (H) Control (n = 8) and mutant (n = 6) male mice were weighed for 12 weeks after induction, with no statistically significant differences in body mass observed at any time point (P > .05, Student t test).
Figure 5
Figure 5
Perinatal ductal ectasia and acinar-to-ductal metaplasia (ADM) in HhexloxP/loxP;Pdx1-CreEarlymice. (AJ) Representative H&E images at several developmental time points. Insets: High-magnification view of an acinus from control pancreas at specific age. (A, B) At embryonic development day 18.5 (E18.5), control (HhexloxP/loxP, n ≥ 3 animals) and mutant (HhexloxP/loxP;Pdx1-CreEarly, n ≥ 3 animals) pancreata displayed similar histology. (C, D) Soon after birth at postnatal day 3 (P3), however, mutants (D, n ≥ 3 animals) showed ectatic ducts (black asterisk) with associated periductal fibrosis (red asterisk). Moreover, these regions were associated with ADM (arrowheads, D, G, I, J), a finding only observed in mutants. (EG) The histologic features of periductal fibrosis, ductal ectasia, and ADM in mutants became more prominent at P10. (HJ) At P21, severely affected mutant mice exhibited an exacerbated phenotype with concomitant interstitial fibrosis. (K) Fibrotic area was measured by Sirius Red staining in P21 mutant (HhexloxP/loxP;Pdx1-CreEarly, n = 5) and control (HhexloxP/loxP, n = 3) pancreata, and each animal is plotted as a percentage of the total area of the pancreatic footprint. Sirius Red positivity averaged 1.82% in controls and 3.79% in mutants. *P < .05. Scale bars: 100 μm; insets: magnification, 400×; is, islet.
Figure 6
Figure 6
Mosaic Hhex expression in HhexloxP/loxP;Pdx1-CreEarlymice at P10. (A) Representative Hhex immunohistochemical staining in control pancreata (HhexloxP/loxP, n ≥ 3 animals) highlights nuclear Hhex expression in ductal cells (black arrows). (B) Hhex expression in mutant pancreata (HhexloxP/loxP;Pdx1-CreEarly, n ≥ 3 animals) was predominantly a pattern of regional mosaicism in that specific ducts either expressed (black arrow) or did not express (black arrowheads) Hhex. Similar patterns of mosaicism were observed at postnatal days P3 and P21; 82.8% ± 3.4% of duct cells at P21 (n = 4 mice) lacked Hhex expression. Scale bars: 100 μm. Insets: magnification, 400×.
Figure 7
Figure 7
Hhex is not required for expression of primary cilia. (AC) Immunofluorescence staining for acetylated-tubulin, a marker of primary cilia, in the ductal epithelium. (A, B) Acetylated-tubulin (red) is visualized within the ductal lumina of both control (HhexloxP/loxP) and mutant (HhexloxP/loxP;Pdx1-CreEarly) pancreata at embryonic developmental day 18.5 (E18.5) and postnatal day P10 (n ≥ 3 animals for each genotype at each time point). Mucin-1 (green) was stained to mark the luminal surface of acinar and ductal cells. (C) A similar expression pattern of acetylated-tubulin (green) was observed between adult control (HhexloxP/loxP) and mutant (HhexloxP/loxP;Sox9-CreERT2) pancreata 2 weeks after induction (n ≥ 3 animals for each genotype). Mucin-1 (red) highlights ductal lumina. (D, E′) Acetylated-tubulin immunofluorescence in P21 control (HhexloxP/loxP;R26-YFP, n = 3) and mutant (HhexloxP/loxP;Pdx1-CreEarly;R26-YFP, n = 4) pancreata indicate the presence of primary cilia intraluminally. Primary cilia were detected on the surface of YFP+ ductal cells (E′, white arrows) within affected parenchyma, evident on the lower power image of this region (E, DAPI only). Scale bars: 25 μm unless noted otherwise.
Figure 8
Figure 8
Expression analysis of genes necessary for primary cilia function. Quantitative reverse-transcription polymerase chain reaction gene expression analysis of dorsal pancreata at embryonic developmental day 18.5 (E18.5) (A) and postnatal day P10 (B) show similar levels between littermate control mice (HhexloxP/loxP, n ≥ 3 animals, black bars) and mutant mice (HhexloxP/loxP;Pdx1-CreEarly, n ≥ 3 animals, white bars) for an array of genes previously implicated in primary cilia formation and function. Somatostatin (Sst) was used as a positive control for down-regulation of an established Hhex target gene in the pancreas. Tbp levels were used to quantify relative gene expression, and the mean of the control group for each gene was normalized to a value of 1. Data are presented as mean ± standard error of the mean. **P < .01, ***P < .001, Student t test.
Figure 9
Figure 9
Hhex is not required for expression of Hnf6 or Hnf1β. (A) Representative immunohistochemical analysis for Hnf6 (AB) and Hnf1β (C, D) indicates similar levels of protein between controls (HhexloxP/loxP, n = 3 animals) and mutants (HhexloxP/loxP;Sox9-CreERT2, n = 3 animals) 2 weeks after induction in the ductal epithelium. Scale bars: 50 μm. (EL) Similar levels of Hnf6 were expressed in ductal cells of control (HhexloxP/loxP;R26-YFP, n = 3) and mutant (HhexloxP/loxP;Pdx1-CreEarly;R26-YFP, n = 3) pancreata at postnatal day P21. Hnf6 was detected in YFP+ cells (F, H, L, white arrows). Scale bars: 25 μm.
Figure 10
Figure 10
Activated pancreatic stellate cells (PSCs) are present in pancreata of HhexloxP/loxP;Pdx1-CreEarlymice. (AC) Immunostaining for smooth muscle actin (SMA) was used as a marker for activated PSCs. (A) In postnatal day P21 control mice (HhexloxP/loxP, n = 3), SMA expression was evident exclusively in the vasculature of the pancreas (arrowheads). Black asterisks: ducts. (B, C) P21 mutant pancreata (HhexloxP/loxP;Pdx1-CreEarly, n = 3), however, exhibited significant smooth muscle actin (SMA) expression (black arrows) within the parenchyma surrounding ectatic ducts (red asterisks) and histologically normal acini. Inset: Fibroblastic-type SMA+ cell abutting an acinus. (D) The number of SMA+ cells was quantified in 20 random magnification 20× fields of mutant (HhexloxP/loxP;Pdx1-CreEarly, n = 3) and control (HhexloxP/loxP, n = 3) pancreata, and the average number of SMA+ cells per magnification 20× field is plotted for each animal. Mutant pancreata demonstrated a significantly increased average number of SMA+ cells (mutant genotype average 7.55) relative to littermate controls (control genotype average 0.65). ***P < .001, Student t test; bars indicate mean of genotype. (EH) Immunostaining for phosphorylated p38 (p-p38) stress kinase in P21 pancreata. (E, F) p-p38 parenchymal reactivity was not observed within control tissue (n = 2). Inset: Immune cells within an intrapancreatic lymph node were used as an internal positive control. (G, H) p-p38 immunoreactivity within mutant pancreata (n = 2) demonstrated a similar pattern as that for SMA in that p-p38+ fibroblastic-type cells (black arrows) were observed surrounding ectatic ducts and adjacent acini. Scale bars: 100 μm.
Figure 11
Figure 11
Hhex regulates Npr3 expression cell-autonomously in pancreatic ductal cells. (A) Schematic of approach to identify cell autonomous targets of Hhex. Dolichos biflorus agglutinin positive ductal cells were isolated from pancreata of 9-week-old control mice (HhexloxP/loxP, two animals) or mutant mice (HhexloxP/loxP;Sox9-CreERT2, two animals) to establish primary ductal cell (PDC) lines. Treatment with 4-hydroxytamoxifen was used to induce recombination in vitro. (B) Gene expression analysis for Hhex transcript levels 4 days after 4-hydroxytamoxifen treatment. (C) Partial list of the 216 transcripts identified to be differentially regulated in Hhex-ablated PDCs by RNA-seq (false discovery rate <0.10). Genes were selected based on their potential to regulate ductal secretion via receptor signaling, ion transport, or signal transduction capability. The fold change is presented as mutant/control. The reads per kilobase per million mapped reads values of the two control lines were averaged to give an indication of relative expression level. (D) An independent experiment was performed to validate gene expression changes identified by transcriptome analysis. RNA was collected 48 hours after 4-hydroxytamoxifen treatment. Hhex and Npr3 expression levels are both presented relative to Tbp. (E, F) Immunofluorescence staining for Npr3 shows higher levels specifically within the ductal epithelium of mutants. (E) Postnatal day P21 mutant mice (HhexloxP/loxP;Pdx1-CreEarly, two animals) versus control mice (HhexloxP/loxP, two animals). DAPI was used to visualize nuclei. Ductal epithelium is outlined. Scale bars: 25 μm. (F) Adult mutant mice (HhexloxP/loxP;Sox9-CreERT2, n = 2) versus control mice (HhexloxP/loxP, n = 2) 2 weeks after induction with tamoxifen. DAPI was used to visualize nuclei. Ductal epithelium is outlined. Scale bars: 25 μm. (G) Schematic of HHEX overexpression approach. Two primary ductal cell lines were transduced with a lentivirus containing a HHEX-IRES-GFP construct. GFP+ cells were sorted by fluorescence-activated cell sorting 72 hours after transduction to establish HHEX-overexpressing PDC lines. (H) Gene expression analysis of control (n = 2) and HHEX-overexpressing (n = 2) PDC lines for HHEX, Hhex, and Npr3 is presented relative to Tbp.
Figure 12
Figure 12
Model of Hhex molecular function in the pancreatic ductal epithelium. (A) In control pancreata, Hhex functions to repress expression from the Npr3 locus. Signaling pathways in the ductal cell contribute to physiologically appropriate secretion that maintains homeostasis of the exocrine pancreas. (B) When Hhex is ablated in pancreatic progenitors, however, Npr3 protein levels are increased specifically in ductal cells. Upon postnatal activation of the exocrine pancreas, the effective concentration of natriuretic peptide ligand at the ductal cell surface is raised, resulting in hypersecretion. Consistent with primary ductal hypertension, ectatic ducts with periductal fibrosis are evident, and disruption of exocrine homeostasis results in acinar-to-ductal metaplasia. Ultimately, destruction and remodeling of parenchyma will manifest as chronic pancreatitis.

Similar articles

Cited by

References

    1. Matthews E.K., Petersen O.H., Williams J.A. Pancreatic acinar cells: acetylcholine-induced membrane depolarization, calcium efflux and amylase release. J Physiol. 1973;234:689–701. - PMC - PubMed
    1. Petersen O.H., Ueda N. Pancreatic acinar cells: effect of acetylcholine, pancreozymin, gastrin and secretin on membrane potential and resistance in vivo and in vitro. J Physiol. 1975;247:461–471. - PMC - PubMed
    1. Reichert M., Rustgi A.K. Pancreatic ductal cells in development, regeneration, and neoplasia. J Clin Invest. 2011;121:4572–4578. - PMC - PubMed
    1. Whitcomb D.C., Ermentrout G.B. A mathematical model of the pancreatic duct cell generating high bicarbonate concentrations in pancreatic juice. Pancreas. 2004;29:e30–e40. - PubMed
    1. Folsch U.R., Fischer H., Soling H.D. Effects of gastrointestinal hormones and carbamylcholine on cAMP accumulation in isolated pancreatic duct fragments from the rat. Digestion. 1980;20:277–292. - PubMed