. 2016 Jan 7;12(1):e1005349.
doi: 10.1371/journal.ppat.1005349. eCollection 2016 Jan.

TIGIT Marks Exhausted T Cells, Correlates with Disease Progression, and Serves as a Target for Immune Restoration in HIV and SIV Infection

Affiliations

TIGIT Marks Exhausted T Cells, Correlates with Disease Progression, and Serves as a Target for Immune Restoration in HIV and SIV Infection

Glen M Chew et al. PLoS Pathog. .

Abstract

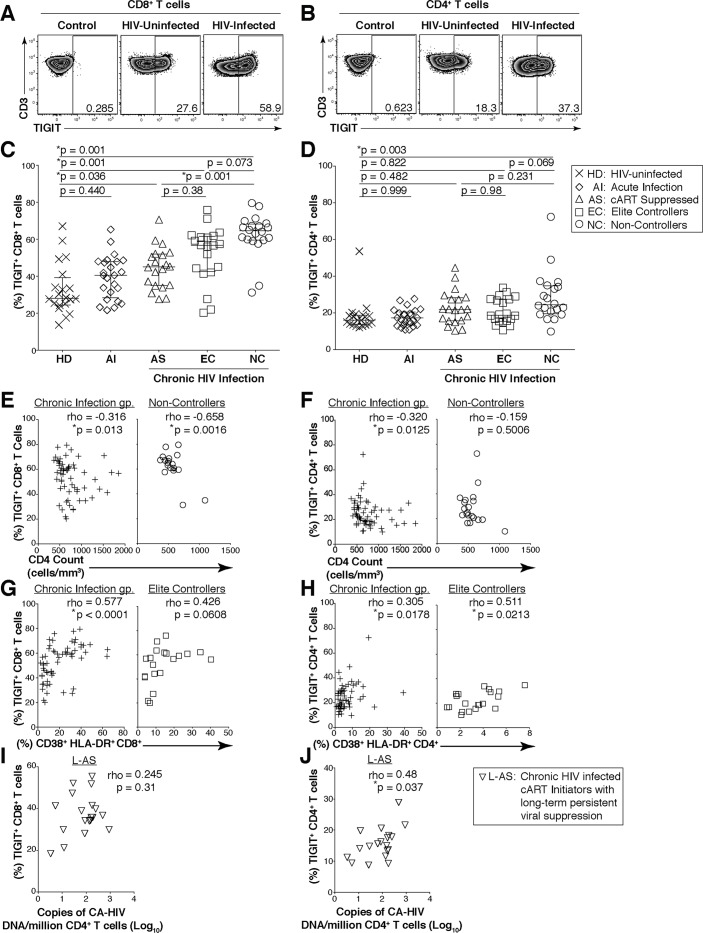
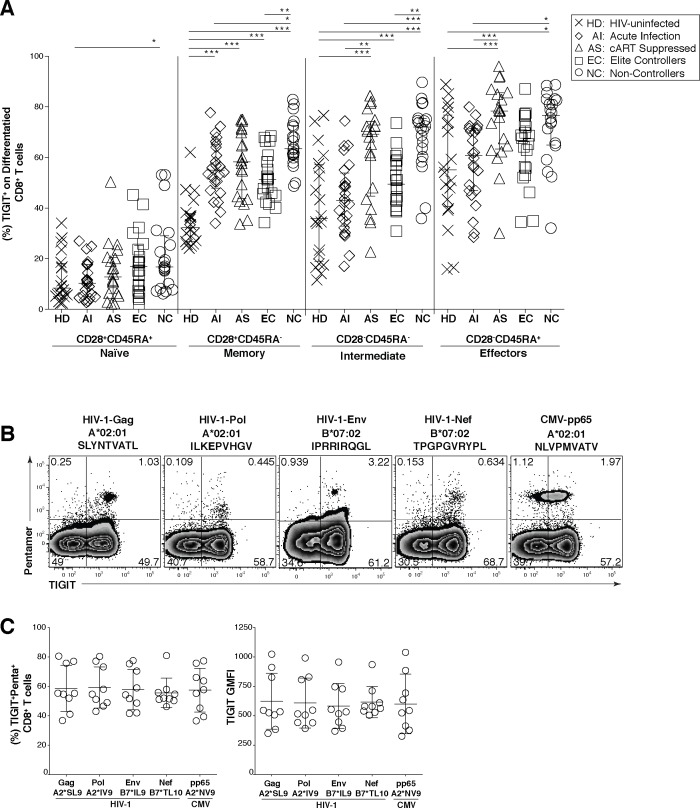
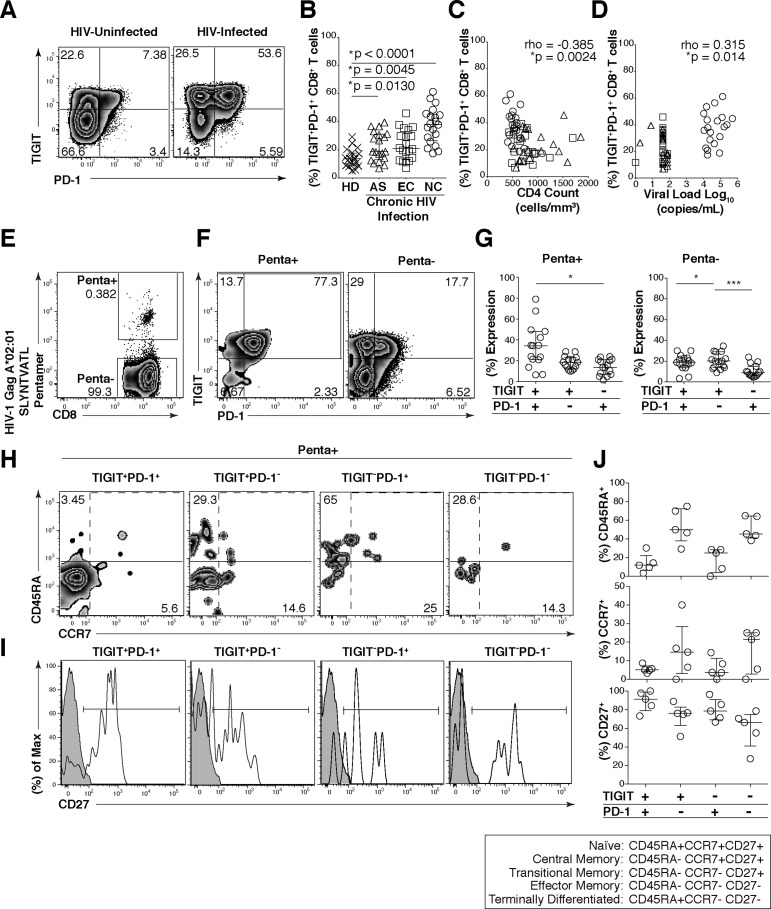
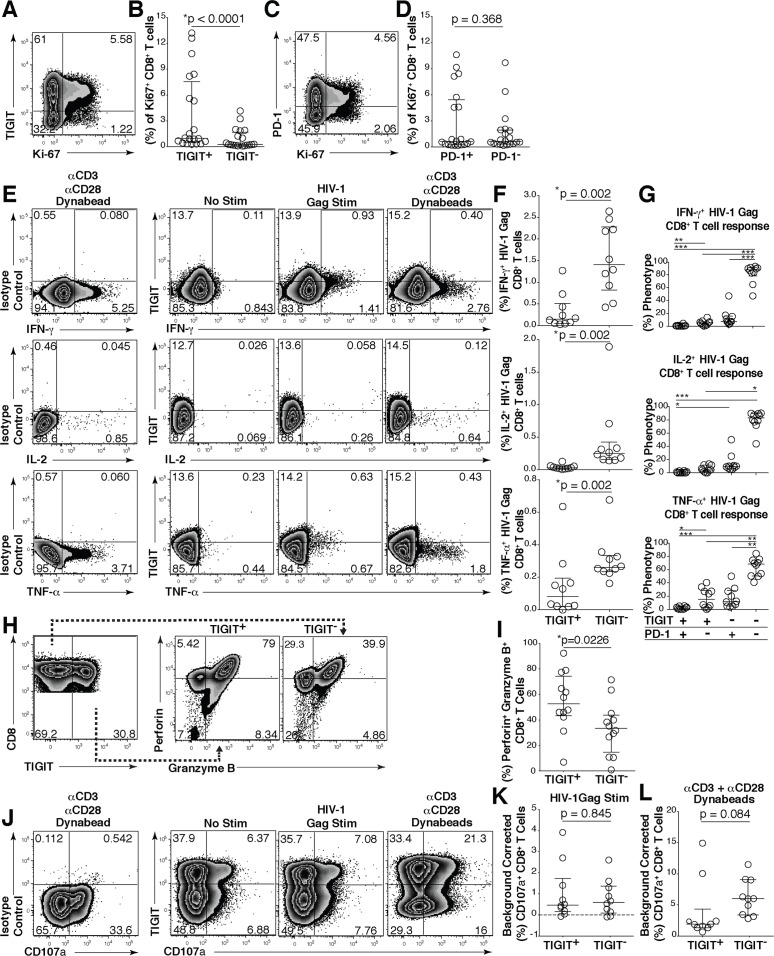
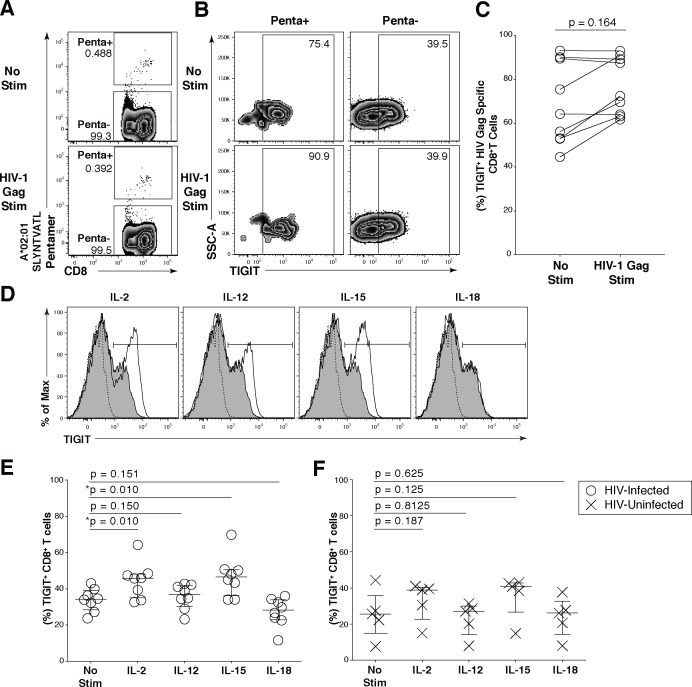
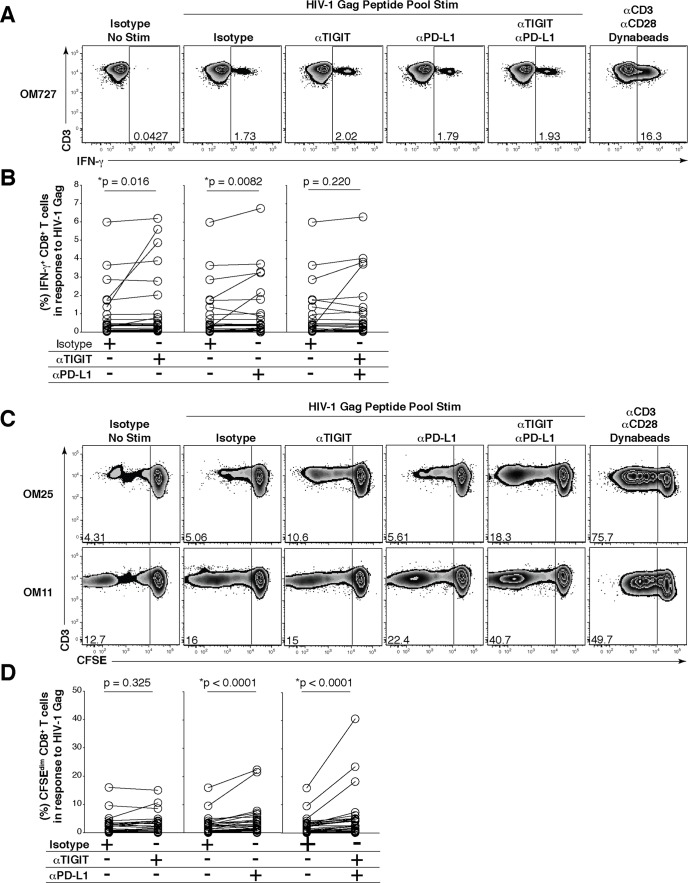
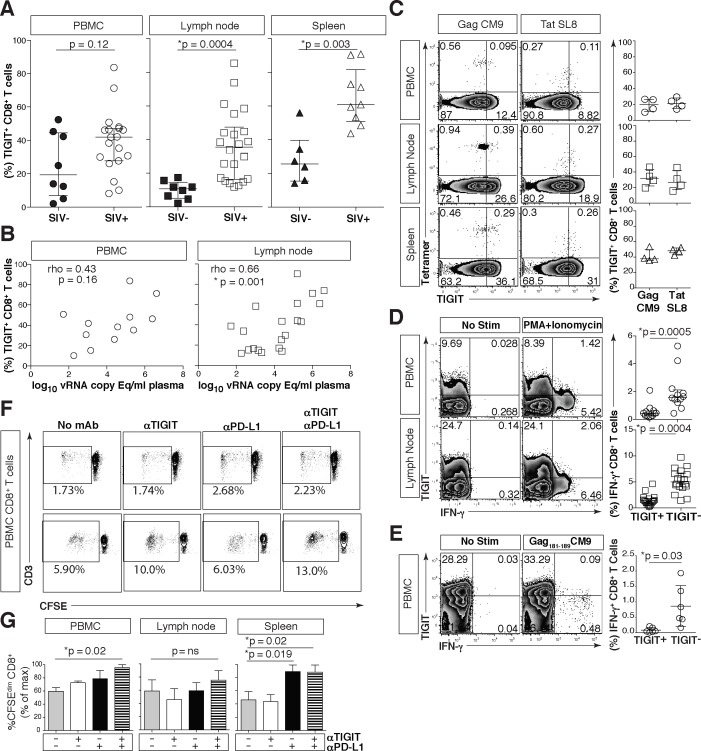
HIV infection induces phenotypic and functional changes to CD8+ T cells defined by the coordinated upregulation of a series of negative checkpoint receptors that eventually result in T cell exhaustion and failure to control viral replication. We report that effector CD8+ T cells during HIV infection in blood and SIV infection in lymphoid tissue exhibit higher levels of the negative checkpoint receptor TIGIT. Increased frequencies of TIGIT+ and TIGIT+ PD-1+ CD8+ T cells correlated with parameters of HIV and SIV disease progression. TIGIT remained elevated despite viral suppression in those with either pharmacological antiretroviral control or immunologically in elite controllers. HIV and SIV-specific CD8+ T cells were dysfunctional and expressed high levels of TIGIT and PD-1. Ex-vivo single or combinational antibody blockade of TIGIT and/or PD-L1 restored viral-specific CD8+ T cell effector responses. The frequency of TIGIT+ CD4+ T cells correlated with the CD4+ T cell total HIV DNA. These findings identify TIGIT as a novel marker of dysfunctional HIV-specific T cells and suggest TIGIT along with other checkpoint receptors may be novel curative HIV targets to reverse T cell exhaustion.


Conflict of interest statement

I hereby declare that MM (Scientist, Immuno-Oncology) and AJK (Vice president, Immuno-Oncology) are employed by Bristol-Myers Squibb, and have no significant competing financial, professional or personal interests that might have influenced the performance or presentation of the work described in this manuscript. This does not alter our adherence to all PLOS Pathogens policies on sharing data and materials.

Figures

Fig 1
Fig 1. Expression of TIGIT on T cells during HIV infection.
Cryopreserved PBMCs were thawed and surface phenotyped for TIGIT expression. Representative flow cytometry flow plots showing TIGIT expression on (A) CD8+ or (B) CD4+ T cells compared to fluorescence minus one (FMO) control. Graphs show compiled data of TIGIT expression on (C) CD8+ and (D) CD4+ T cells stratified by disease: HIV-uninfected healthy donors (HD, X; n = 20), acute HIV-infection (AI, open diamond; n = 24), aviremic cART suppressed (AS, open triangles; n = 20), aviremic elite controllers (EC, open squares; n = 20), and chronic HIV viremic non-controllers (NC, open circles; n = 20). P values were calculated using one-way ANOVA, followed by Tukey’s multiple comparisons test. Graphs show correlation of total chronic infected (+: AS, EC, and NC; left panel, n = 60) and non-controllers (right panel, n = 20) frequency (%) of (E) TIGIT+ CD8+ and (F) TIGIT+ CD4+ T cells against clinical CD4 Count (cells/mm3). Graphs show correlation of total chronic infected (+: AS, EC, and NC; left panel, n = 60) and elite controllers (right panel, n = 20) frequency (%) of (G) TIGIT+ CD8+ and (H) TIGIT+ CD4+ T cells against frequency (%) of T cell activation (CD38+HLA-DR+). Graphs show correlation of frequency (%) of (I) TIGIT+ CD8+ and (J) TIGIT+ CD4+ T cell among aviremic HIV infected “ART initiators” with known duration of long-term viral suppression from the SCOPE cohort (L-AS, n = 19, open inverted triangles) versus copies of CD4+ T cell associated HIV DNA per million CD4+ T cells (log10). Spearman’s rho tests were performed for correlations.
Fig 2
Fig 2. TIGIT expression on CD8+ terminal effector T cells and HIV-specific CD8+ T cells.
Cryopreserved PBMCs were thawed and surface phenotyped for TIGIT expression on CD8+ T cell compartments. (A) Graph shows compiled frequency (%) of TIGIT+ CD8+ T cell expression in differentiated compartments stratified by disease status. HIV-uninfected healthy donors (HD, X; n = 20), acute infected (AI, open diamond; n = 24), cART suppressed (AS, open triangle; n = 20), elite controller (EC, open square; n = 20), non-controllers (NC, open circle; n = 20). P values were calculated using one-way ANOVA, followed by Tukey’s multiple comparisons test (*p < 0.05; **p < 0.01; ***p < 0.001). PBMCs from HLA-A*02:01 or HLA-B*07:02 HIV chronically infected individuals were stained with matched HLA pentamers presenting HIV-1 and CMV epitopes and anti-TIGIT. (B) Representative flow cytometry plots of pentamer-specific CD8+ T cells using HLA-A*02:01 HIV-1 Gag SLYNTVATL (A2*SL9), HLA-A*02:01 HIV-1 Pol ILKEPVHGV (A2*IV9), HLA-B*07:02 HIV-1 Env IPRRIRQGL (B7*IL9), HLA-B*07:02 HIV-1 Nef TPGPGVRYPL (B7*TL10), and HLA-A*02:01 CMV pp65 NLVPMVATV (A2*NV9) (C) Compiled data of TIGIT expression frequency (%) on pentamer specific CD8+ T cells which was recalculated to 100% (left panel, n = 9) compiled data of TIGIT geometric mean fluorescence intensity (GMFI) on pentamer specific CD8+ T cells (right panel, n = 9).
Fig 3
Fig 3. HIV-Gag specific CD8+ T cells co-express TIGIT and PD-1 and exhibit a transitional memory phenotype.
Cryopreserved PBMCs were thawed and surface phenotyped for TIGIT and PD-1 expression on CD8+ T cells. (A) Representative flow cytometry plots showing TIGIT and PD-1 expression on CD8+ T cells from one HIV-uninfected individual (left panel) and one HIV-infected individual (right panel). (B) Graph shows compiled frequency (%) of co-expressing TIGIT+PD-1+ CD8+ T cells from HIV-uninfected (HD, n = 20), chronic HIV-infected (AS, n = 20; EC, n = 20; NC, n = 20). P values were calculated using one-way ANOVA, followed by Tukey’s multiple comparisons test. (C) Graph shows correlation of TIGIT+PD-1+ CD8+ T cells frequency (%) from chronic HIV-infected individuals against CD4 count (cells/mm3) or (D) viral load (copies/ml). Spearman’s rho tests were performed for correlations. TIGIT and PD-1 expression on HIV-1 Gag specific CD8+ T cells were evaluated. (E) Representative flow cytometry plot of HIV-specific CD8+ T cells using HLA-A*02:01 HIV-1 Gag SLYNTVATL. (F) Representative flow cytometry plots of TIGIT and PD-1 expression on HIV-1 Gag specific CD8+ T cells (Penta+, left panel; Penta-, right panel). (G) Graphs show compiled frequency (%) of TIGIT and PD-1 on Penta+ (left panel) and Penta- (right panel) (sample group contains; AS n = 11, EC n = 2, NC n = 2). P values were calculated using repeated-measures one-way ANOVA, followed by Tukey’s multiple comparisons test (*p < 0.05; **p < 0.01; ***p < 0.001). Representative flow cytometry of (H) CD45RA and CCR7 or (I) histogram of CD27 (shaded isotype control) on Penta+ CD8+ T cells expressing TIGIT+PD1+, TIGIT+PD-1-, TIGIT-PD-1+, or TIGIT-PD-1-. (J) Graphs show compiled frequency (%) of CD45RA (top panel), CCR7 (mid panel), and CD27 (bottom panel) (n = 5).
Fig 4
Fig 4. TIGIT expressing CD8+ T cells have impaired cytokine responses.
Representative flow cytometry plots gated on CD8+ T cells showing (A) TIGIT or (C) PD-1 expression against Ki-67 from a chronically HIV-infected individual. Compiled data of Ki-67+ CD8+ T cell frequency (%) separated into (B) TIGIT+ and TIGIT- or (D) PD-1+ and PD-1- (n = 20). P values were calculated by Wilcoxon matched-pairs signed ranked test. Ex vivo PBMCs from chronically HIV-infected individuals were stimulated with HIV Gag peptide pool and assessed for cytokine production. (E) Representative flow cytometry plots gated on CD8+ T cells showing TIGIT expression and either IFN-γ, IL-2, or TNF-α content after no stimulation, stimulation with an HIV-1 Gag peptide pool, or a positive control stimulation with anti-CD3 + anti-CD28 Dynabeads. (F) Compiled data of IFN-γ, IL-2, or TNF-α CD8+ T cell frequency (%) from TIGIT+ or TIGIT- CD8+ T cell compartments after HIV-1 Gag peptide pool stimulation (sample group includes; AS n = 4, EC n = 3, NC n = 3). P values were calculated by Wilcoxon matched-pairs signed ranked test. (G) Compiled data of TIGIT and PD-1 expression on HIV-1 Gag responding cells (sample group includes; AS n = 4, EC n = 3, NC n = 3). P values were calculated with repeated-measures one-way ANOVA, followed by Tukey’s multiple comparisons test (*p < 0.05; **p < 0.01; ***p < 0.001). (H) Representative flow cytometry plots of intracellular perforin and granzyme B from CD8+ T cells expressing or not expressing TIGIT. (I) Compiled frequency (%) of intracellular perforin+granzyme B+ content from TIGIT+ or TIGIT- CD8+ T cell compartments (AS; n = 12). P values were calculated by Wilcoxon matched-pairs signed ranked test. (J) Representative flow cytometry plots gated on CD8+ T cells showing TIGIT and CD107a expression from TIGIT isotype control, no stimulation, HIV-1 Gag peptide pool, positive control stimulation with anti-CD3 + anti-CD28 Dynabeads. Compiled data of background corrected CD107a after (K) HIV-1 Gag peptide pool (L) anti-CD3 + anti-CD28 Dynabead stimulation in TIGIT+ or TIGIT- CD8+ T cell compartments (AS; n = 10). P values were calculated by Wilcoxon matched-pairs signed ranked test.
Fig 5
Fig 5. Common γ-chain cytokines regulate TIGIT expression on CD8+ T cells.
Ex vivo PBMCs from chronically HIV-1 infected individuals were stimulated with HIV-1 Gag peptide pool for 12 hours. (A) Representative flow cytometry plot gated on CD8+ T cells showing HIV-1 Gag pentamer with no stimulation (top panel) or HIV-1 Gag stimulation (bottom panel). (B) Representative flow cytometry plot of TIGIT expression on Penta+ and Penta- cells with no stimulation or HIV-1 Gag stimulation. (C) Graph shows compiled frequency (%) of TIGIT on Penta+ cells with no stimulation and HIV-1 Gag stimulation (n = 9). P values calculated with Wilcoxon matched-pairs signed-rank test. (D) Representative flow cytometry histograms gated on CD8+ T cells overlaid with TIGIT expression frequency before and after cytokine stimulation. Dashed line indicates TIGIT isotype control, shaded histogram indicates TIGIT expression with no stimulation, and the solid line indicates TIGIT expression with cytokine stimulation after six days. Compiled data of TIGIT frequency (%) on CD8+ T cells (E) HIV-Infected participant (open circle; n = 8) (F) HIV-Uninfected participant (X; n = 5). P values were calculated with repeated-measures one-way ANOVA, followed by Tukey’s multiple comparisons test.
Fig 6
Fig 6. Effect of in vitro blockade with anti-TIGIT/anti-PD-L1 mAbs on HIV-specific CD8+ T cell responses.
Ex vivo PBMCs from chronically HIV-infected individuals were stimulated with HIV Gag peptide pool in the presence of mAb blocking antibodies. (A) Representative flow cytometry plots gated on CD8+ T cells, showing IFN-γ responses from an HIV-infected individual. No HIV-1 Gag stimulation with an isotype control, HIV-1 Gag stimulation with an isotype control, HIV-1 Gag stimulation with anti-TIGIT, HIV-1 Gag stimulation with anti-PD-L1, HIV-1 Gag stimulation with dual blockade (anti-TIGIT + anti-PD-L1) and a positive control (anti-CD3 + anti-CD28 Dynabeads). (B) Compiled data showing variation in the frequency (%) of IFN-γ in responses to HIV-1 Gag peptide pool with isotype control or mAb blockade; TIGIT blockade (left panel), PD-L1 blockade (middle panel), and dual blockade (right panel) (n = 25). P values were calculated by Wilcoxon matched-pairs signed ranked test. (C) Representative flow cytometry plots gated on CD8+ T cells from HIV-infected individuals, showing intermediate and high CFSE dilution in response to HIV-1 Gag peptide pool stimulation in the presence of either an isotype control, anti-TIGIT mAb, anti-PD-L1 mAb, a combination of both anti-TIGIT and anti-PD-L1 mAbs or anti-CD3 + anti-CD28 Dynabeads as a positive control. (D) Graphs show compiled data showing variation in the frequency (%) of CFSEdim in responses to HIV-1 Gag peptide pool with either an isotype control or mAb blockade; TIGIT blockade (left panel), PD-L1 blockade (middle panel), and dual blockade (right panel) (n = 24). P values were calculated by Wilcoxon matched-pairs signed ranked test.
Fig 7
Fig 7. Phenotypic and functional assessment of rhTIGIT expression on CD8+ T cells.
Cryopreserved rhesus macaque PBMCs were thawed, phenotyped and assessed for function. (A) Graphs show frequency (%) of rhTIGIT+CD8+ T cells from PBMCs (circle), LNs (square), and spleen (triangle) in SIV-uninfected (filled) and SIV-infected (open) animals (SIV-uninfected PBMCs, n = 8; SIV-infected PBMCs, n = 19; SIV-uninfected LNs, n = 8; SIV-infected LNs, n = 22; SIV-uninfected spleen, n = 6; SIV infected spleen, n = 9). P values were calculated with Mann-Whitney U tests. (B) Graphs show correlation of frequency (%) of rhTIGIT+ CD8+ T cells in PBMCs (circle) and lymph nodes (square) from SIV-infected animal against plasma SIV viral load log10 vRNA copy Eq/ml (PBMCs, n = 12; LNs, n = 20). vRNA copy Eq, viral RNA copy equivalents. Spearman’s rho tests were performed for correlations. (C) Representative flow cytometry plots of tetramer stains for Mamu-A*01 restricted SIV-Gag CM9 and SIV-Tat SL8 specific CD8+ T cells from PBMC, LNs, and spleen, in a representative Mamu-A*01 animal with full cART suppression. Compiled data of rhTIGIT expression frequency (%) on tetramer specific CD8+ T cells (n = 4) from PBMCs (circle), LNs (square), and spleen (triangle) from Mamu-A*01+ macaques with full cART suppression. (D) Representative flow cytometry plots of PBMCs (n = 12) or lymph nodes (n = 18) stimulated without or with PMA + Ionomycin. Graphs show frequency (%) of IFN-γ from CD8+ T cells expressing TIGIT or not expressing TIGIT. P values were calculated by Wilcoxon matched-pairs signed ranked test. (E) Representative flow cytometry plots of PBMCs from a Mamu-A*01+ macaque stimulated without or with SIV-Gag181-189 CM9 peptide. Graph shows frequency (%) of IFN-γ from SIV-Gag181-189 CM9-specific CD8+ T cells expressing TIGIT or not expressing TIGIT from Mamu-A*01+ macaques (n = 6). P values were calculated by Wilcoxon matched-pairs signed ranked test. (F) Representative flow cytometry plots of CD8+ T cells from two separate SIV-infected macaques showing CD8+ T cell CFSE dilution in response to AT2-inactivated SIV with either no antibody, anti-TIGIT, anti-PD-L1 or dual blockade (anti-TIGIT + anti-PD-L1). (G) Graphs show compiled data of CD8+ T cell CFSE dilution from PBMC (left panel), Lymph node (middle panel), or Spleen (right panel) as percent of max (n = 4). P values were calculated by Wilcoxon matched-pairs signed ranked test.

References

    1. Wherry EJ (2011) T cell exhaustion. Nat Immunol 12: 492–499. - PubMed
    1. Day CL, Kaufmann DE, Kiepiela P, Brown JA, Moodley ES, et al. (2006) PD-1 expression on HIV-specific T cells is associated with T-cell exhaustion and disease progression. Nature 443: 350–354. - PubMed
    1. Dyavar Shetty R, Velu V, Titanji K, Bosinger SE, Freeman GJ, et al. (2012) PD-1 blockade during chronic SIV infection reduces hyperimmune activation and microbial translocation in rhesus macaques. J Clin Invest 122: 1712–1716. 10.1172/JCI60612 - DOI - PMC - PubMed
    1. Petrovas C, Price DA, Mattapallil J, Ambrozak DR, Geldmacher C, et al. (2007) SIV-specific CD8+ T cells express high levels of PD1 and cytokines but have impaired proliferative capacity in acute and chronic SIVmac251 infection. Blood 110: 928–936. - PMC - PubMed
    1. Porichis F, Kaufmann DE (2012) Role of PD-1 in HIV pathogenesis and as target for therapy. Curr HIV/AIDS Rep 9: 81–90. 10.1007/s11904-011-0106-4 - DOI - PMC - PubMed

Publication types