. 2016 Jun;23(6):1049-59.
doi: 10.1038/cdd.2015.159. Epub 2016 Jan 8.

PUMA promotes apoptosis of hematopoietic progenitors driving leukemic progression in a mouse model of myelodysplasia

Affiliations

PUMA promotes apoptosis of hematopoietic progenitors driving leukemic progression in a mouse model of myelodysplasia

A A Guirguis et al. Cell Death Differ. 2016 Jun.

Abstract

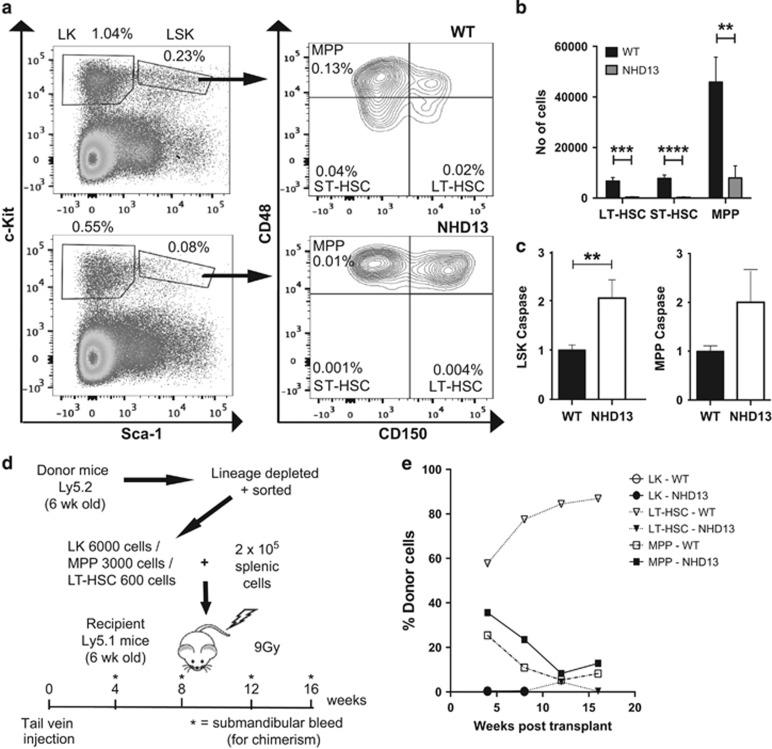
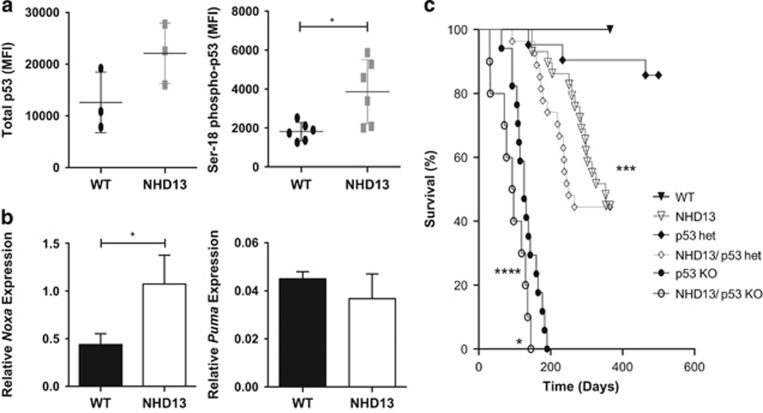
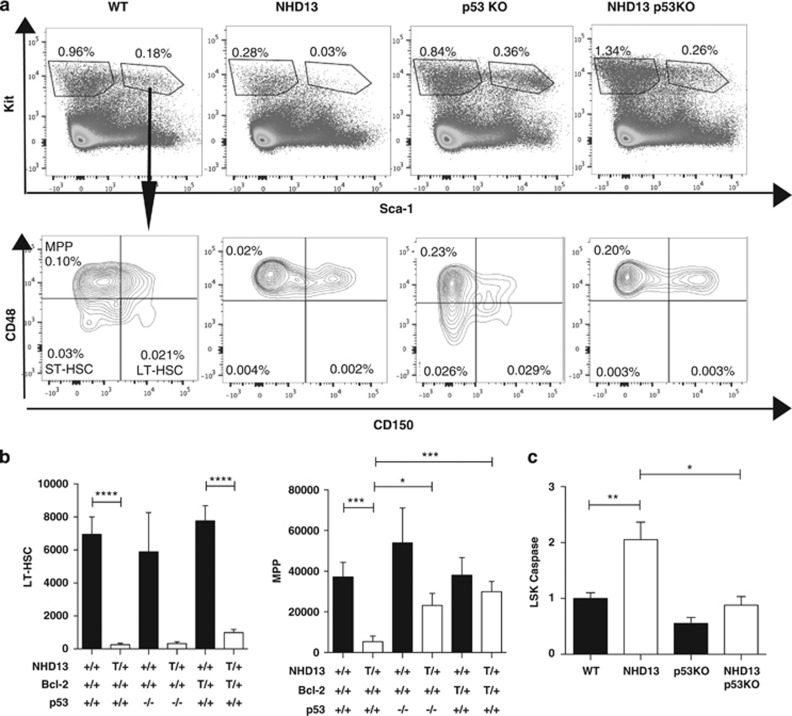
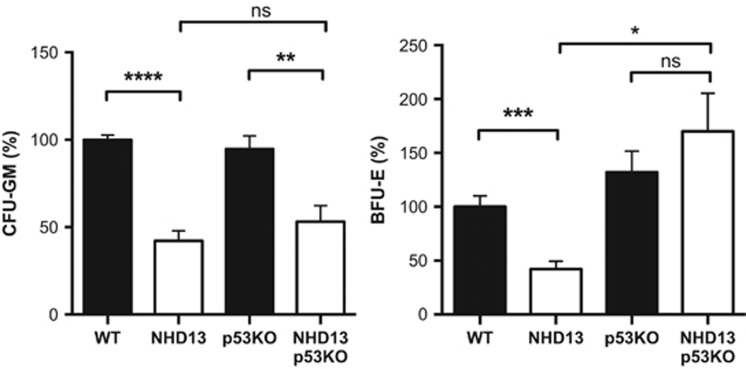
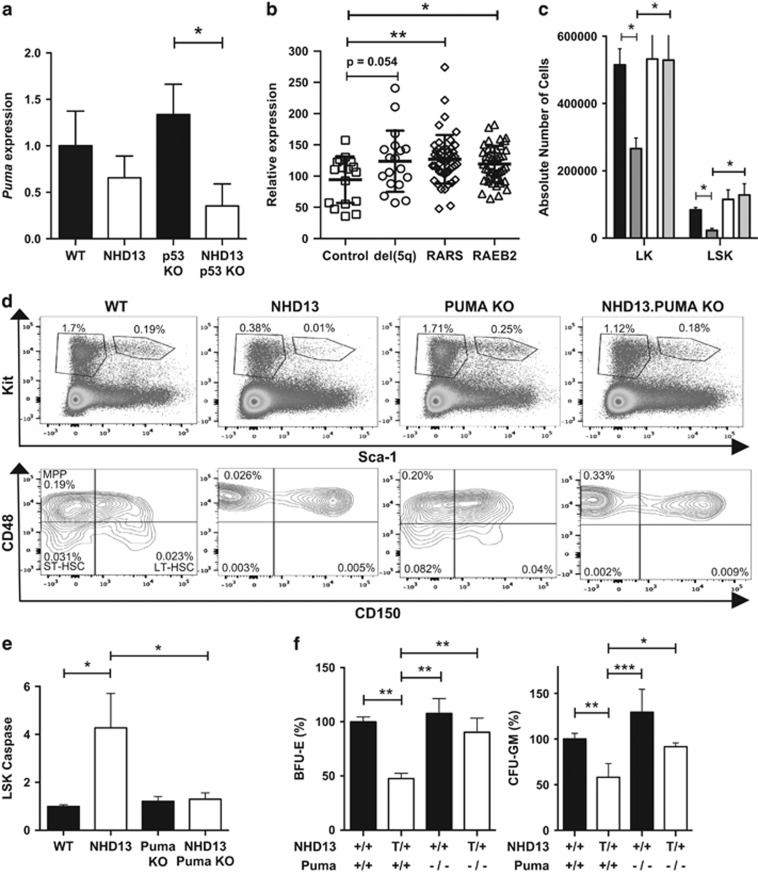
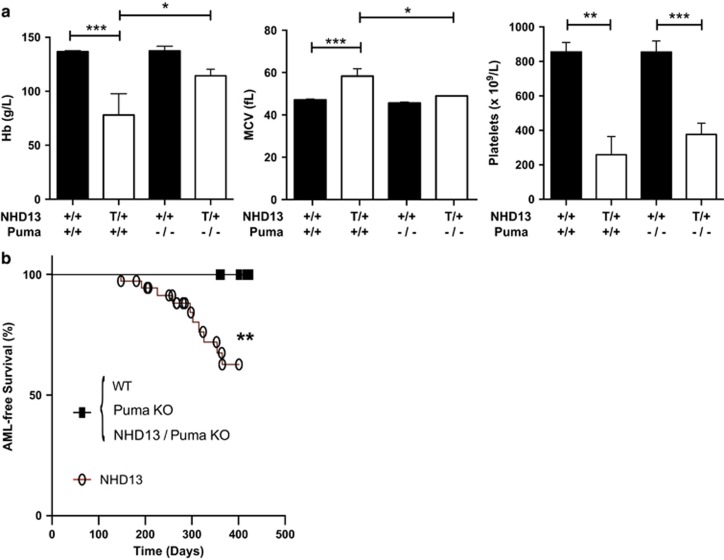
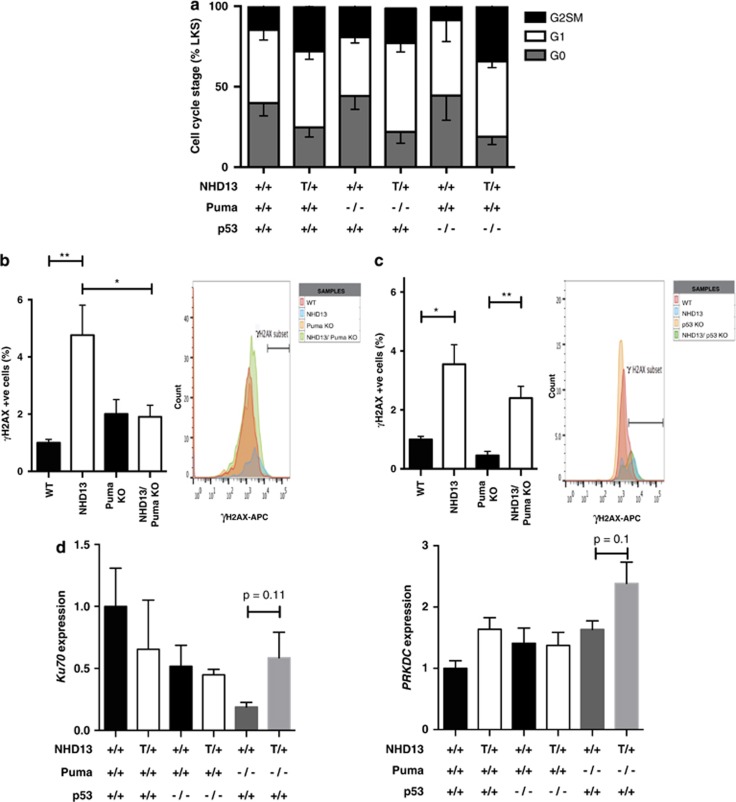
Myelodysplastic syndrome (MDS) is characterized by ineffective hematopoiesis with resultant cytopenias. Increased apoptosis and aberrantly functioning progenitors are thought to contribute to this phenotype. As is the case for other malignancies, overcoming apoptosis is believed to be important in progression toward acute myeloid leukemia (AML). Using the NUP98-HOXD13 (NHD13) transgenic mouse model of MDS, we previously reported that overexpression of the anti-apoptotic protein BCL2, blocked apoptosis and improved cytopenias, paradoxically, delaying leukemic progression. To further understand this surprising result, we examined the role of p53 and its pro-apoptotic effectors, PUMA and NOXA in NHD13 mice. The absence of p53 or PUMA but not NOXA reduced apoptosis and expanded the numbers of MDS-repopulating cells. Despite a similar effect on apoptosis and cell numbers, the absence of p53 and PUMA had diametrically opposed effects on progression to AML: absence of p53 accelerated leukemic progression, while absence of PUMA significantly delayed progression. This may be explained in part by differences in cellular responses to DNA damage. The absence of p53 led to higher levels of γ-H2AX (indicative of persistent DNA lesions) while PUMA-deficient NHD13 progenitors resolved DNA lesions in a manner comparable to wild-type cells. These results suggest that targeting PUMA may improve the cytopenias of MDS without a detrimental effect on leukemic progression thus warranting further investigation.


Figures

Figure 1
Figure 1
Stem/progenitor cell characterization in NHD13 mice. (a) Flow-cytometric analysis of LK and LSK cell populations gated on lineage-negative cells; and SLAM populations as a subset of LSK cells. Cell populations examined include LT-HSCs (CD150+CD48), ST-HSCs (CD150CD48) and MPPs (CD150CD48+). Numbers depict percentages of total nucleated cells. Plots shown are representative of three individual experiments. (b) Absolute quantification of individual SLAM cell populations (per femur and tibia of each mouse) (n=9 mice per genotype). (c) Apoptosis analysis of LSK and MPP cell populations from WT (n=14) and NHD13 (n=15) mice. Results were normalized to caspase-3/7 activation levels in WT cells. (d) Schema for chimeric transplant experiment. Four recipient mice were used for each population of cells. Total number of recipient mice=24. (e) Chimerism results for transplanted mice. Results are derived from analyses of monthly bleeds for 4 months in total (except for LK cell transplants) and represent percentage of peripheral blood cells that were donor-derived. **P<0.01; ***P<0.001; ****P<0.0001
Figure 2
Figure 2
Expression of p53 and its transcriptional targets; and impact of loss of p53 on NHD13 mouse lifespan. (a) Total p53 and phosphorylated (i.e., activated) Ser18-p53 levels as determined by flow-cytometric analysis in WT and NHD13 MPP cells. Results are expressed as mean fluorescent intensity (MFI); (n=3 per genotype for total p53; and n=6 for phospho-p53). (b) Quantification of Noxa and Puma mRNA levels relative to actin and HPRT (n=3 mice per genotype); error bars represent standard deviation. (c) Kaplan–Meier analysis of animal survival for WT (n=16); NHD13 (n=29); p53−/− (n=17); NHD13/p53+/− (n=27) and NHD13/p53−/− (n=10) mice; *P<0.05; ***P<0.001; ****P<0.0001
Figure 3
Figure 3
Phenotype of NHD13 mice deficient for p53. (a) Flow-cytometric analysis of LSK and SLAM populations. Numbers represent percentages of total nucleated cells. Plots represent one replicate of four individual experiments. (b) Absolute numbers of LT-HSCs and MPPs in bone marrow per mouse leg (femur plus tibia)—quantified using flow cytometry for WT (n=14); NHD13 (n=16); p53−/− (n=4) and NHD13;p53−/− (n=4) mice. Results are compared with data from NHD13;Bcl-2 transgenic mice (n=5 for BCL2 and NHD13;BCL2 transgenic mice). (c) Graph of flow-cytometric analysis of activated Caspase-3/7 positivity in LSK cells of WT (n=14); NHD13 (n=15); p53−/− (n=6) and NHD13;p53−/− (n=7) from four individual experiments. Results are normalized to the levels observed in WT cells; +/+, wild-type; T/+, transgenic; −/−, knockout; *P<0.05; **P<0.01; ***P<0.001; ****P<0.0001
Figure 4
Figure 4
Differential impact of loss of p53 on erythroid versus myeloid progenitors. Progenitor assays enumerating colony-forming units granulocyte-macrophage (CFU-GM) and burst-forming units-erythroid (BFU-E) for WT (n=10); NHD13 (n=10); p53−/− (n=11) and NHD13;p53−/− (n=14) mice. Each sample was processed in triplicate. Number of colonies was normalized to those seen in wild-type mice; *P<0.05; **P<0.01; ***P<0.001; ****P<0.0001
Figure 5
Figure 5
Puma expression in human MDS and phenotype of NHD13;Puma−/− mice. (a) Puma mRNA expression levels for WT, NHD13, p53 KO and NHD13; p53 KO mice (n=3). Results are expressed relative to actin and HPRT. (b) Puma gene expression in human MDS—data have been extracted from Pellagatti et al. and separate MDS into low-risk del(5q) and RARS and higher risk RAEB2. (c) Absolute quantification of LK and LSK subsets per mouse leg based on flow-cytometric analysis (n=9 per genotype). (d) Results from flow-cytometric analysis showing relative quantification of LK, LSK and SLAM subsets. Results are expressed as percentages of total nucleated cells. Plots shown are a single representation of three individual experiments. (e) Apoptosis of LSK stem cells as measured by staining for activated caspase-3/7, with data expressed relative to levels seen in WT mice (n=11 per genotype; 4 independent experiments). (f) In vitro colony assays—BFU-E (n=5 per genotype) and GMP (n=4 per genotype). Data have been normalized to wild-type numbers; *P<0.05; **P<0.01; ***P<0.001
Figure 6
Figure 6
Impact of loss of PUMA on peripheral blood counts and survival of NHD13 mice. (a) Peripheral blood analysis of Hb, MCV and platelet count in 8-month-old mice (n>6 per genotype). (b) Kaplan–Meier curve analysis for AML-free survival; +/+, wild-type; T/+, transgenic; −/−, knockout; *P<0.05; **P<0.01; ***P<0.001
Figure 7
Figure 7
The differing roles of p53 and PUMA in progression of MDS to AML. (a) Cell-cycle analysis of LSK cells based on DAPI and Ki67 staining. Data show percentage of total cells in various stages of cell cycle. (b) DNA damage analysis with data normalized to the levels seen in wild-type cells for Puma-deficient mice. γH2AX staining is expressed as a percentage of activated caspase-3/7 negative, G0 (non-cycling) cells (n=9 per genotype); Histogram to the right shows a single graphical representation of the data. (c) DNA damage analysis with data normalized to the levels seen in wild-type cells for WT (n=9), NHD13 (n=8), p53 KO (n=4) and NHD13;p53 KO (n=5) mice; Histogram to the right shows a single representation of the data. (d) mRNA expression of genes involved in the NHEJ DNA damage response. Results have been normalized to HPRT and actin levels (n=3 per genotype); T/+, transgenic; *P<0.05; **P<0.01

References

    1. Bravo GM, Lee E, Merchan B, Kantarjian HM, Garcia-Manero G. Integrating genetics and epigenetics in myelodysplastic syndromes: advances in pathogenesis and disease evolution. Br J Haematol 2014; 166: 646–659. - PMC - PubMed
    1. Pang WW, Pluvinage JV, Price EA, Sridhar K, Arber DA, Greenberg PL et al. Hematopoietic stem cell and progenitor cell mechanisms in myelodysplastic syndromes. Proc Natl Acad Sci USA 2013; 110: 3011–3016. - PMC - PubMed
    1. Woll PS, Kjällquist U, Chowdhury O, Doolittle H, Wedge DC, Thongjuea S et al. Myelodysplastic syndromes are propagated by rare and distinct human cancer stem cells in vivo. Cancer Cell 2014; 25: 794–808. - PubMed
    1. Raza A, Galili N. The genetic basis of phenotypic heterogeneity in myelodysplastic syndromes. Nat Rev Cancer 2012; 12: 849–859. - PubMed
    1. Kerbauy D, Deeg H. Apoptosis and antiapoptotic mechanisms in the progression of myelodysplastic syndrome. Exp Hematol 2007; 35: 1739–1746. - PMC - PubMed

Publication types

MeSH terms

Substances