. 2016 Mar 4;291(10):5247-58.
doi: 10.1074/jbc.M115.705160. Epub 2016 Jan 7.

Heterogeneity of Collagen VI Microfibrils: STRUCTURAL ANALYSIS OF NON-COLLAGENOUS REGIONS

Affiliations

Heterogeneity of Collagen VI Microfibrils: STRUCTURAL ANALYSIS OF NON-COLLAGENOUS REGIONS

Tobias Maaß et al. J Biol Chem. .

Abstract

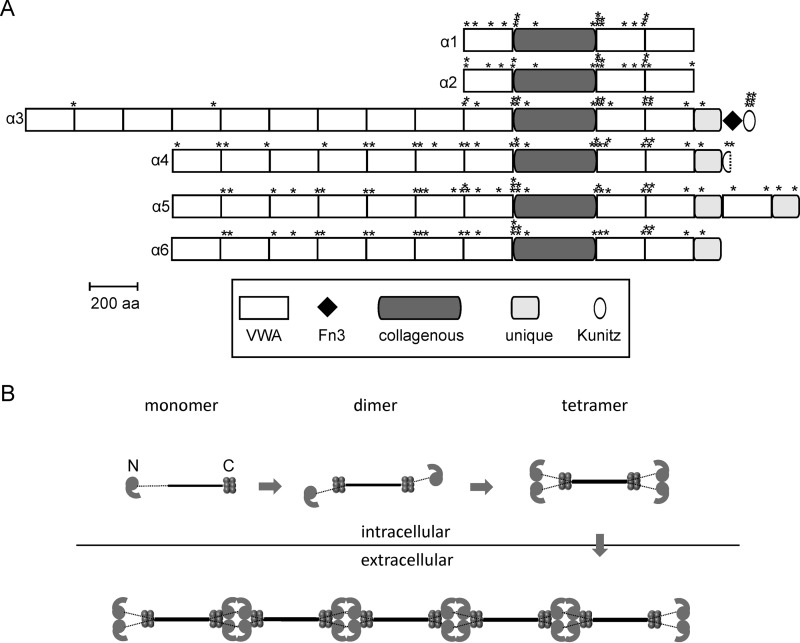
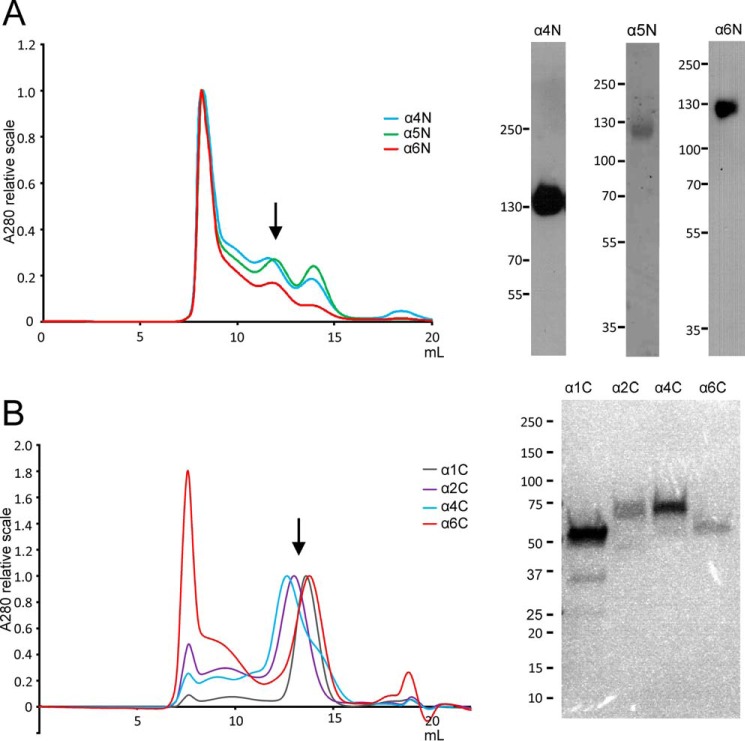
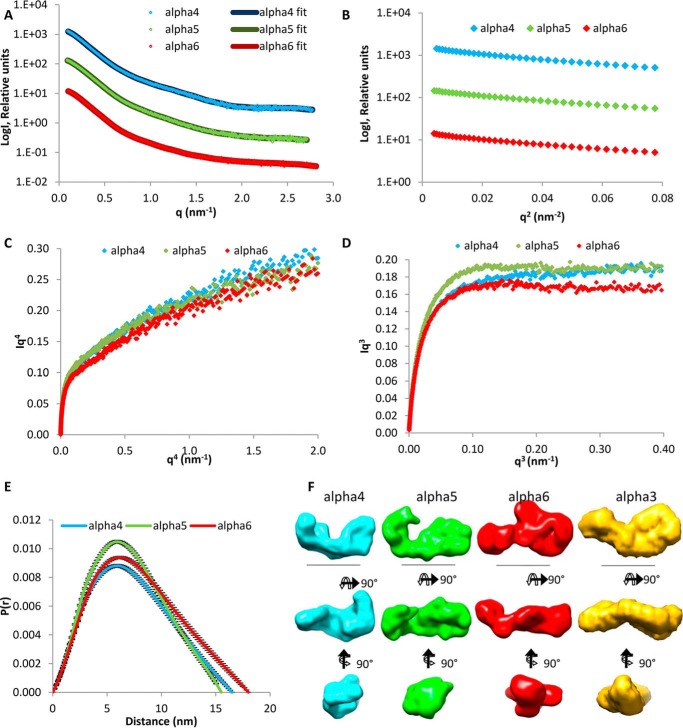
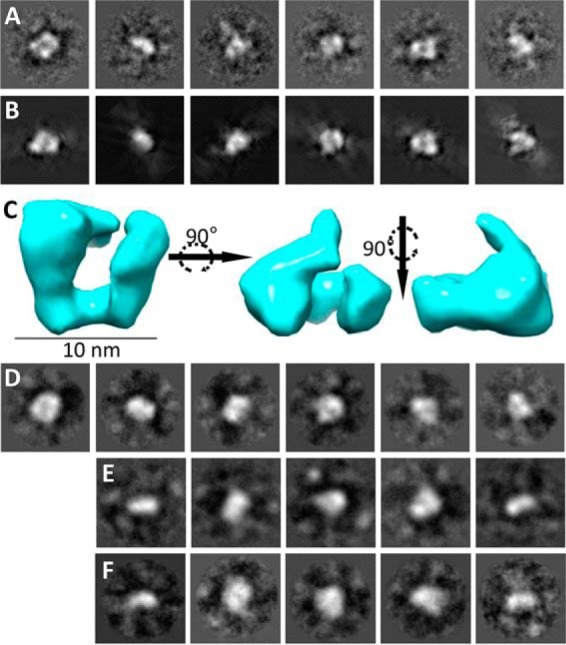
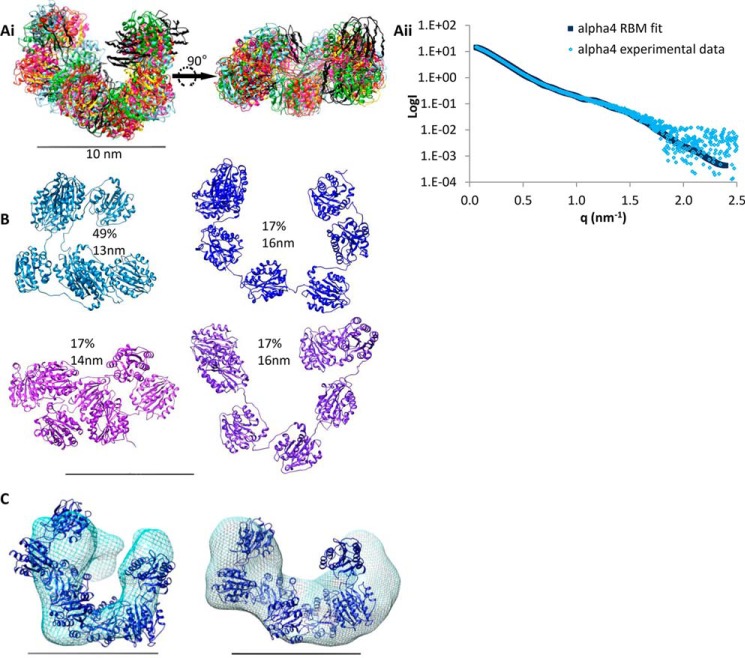
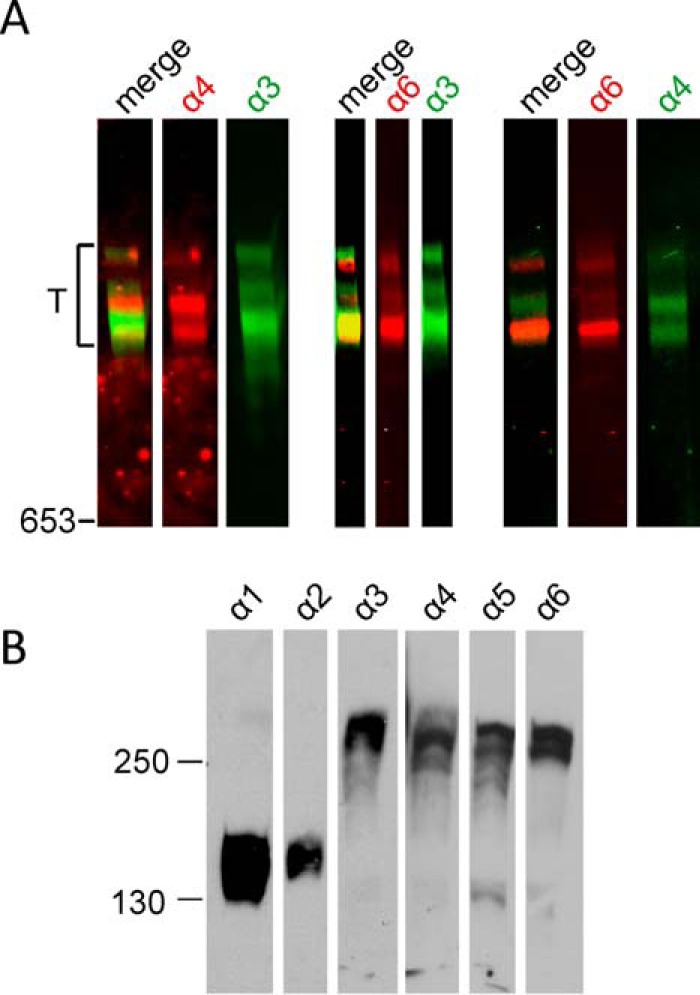
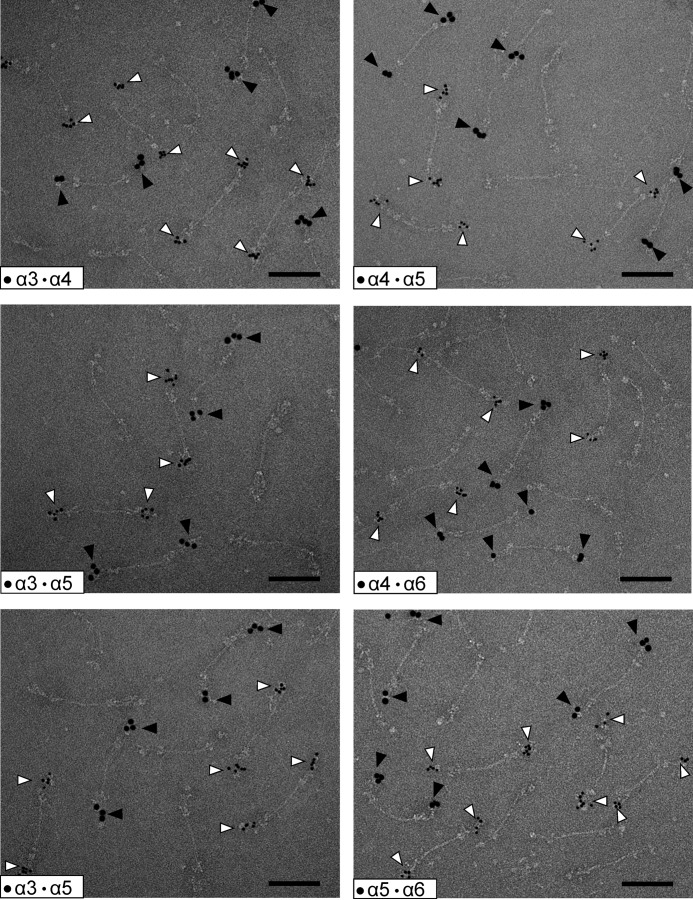
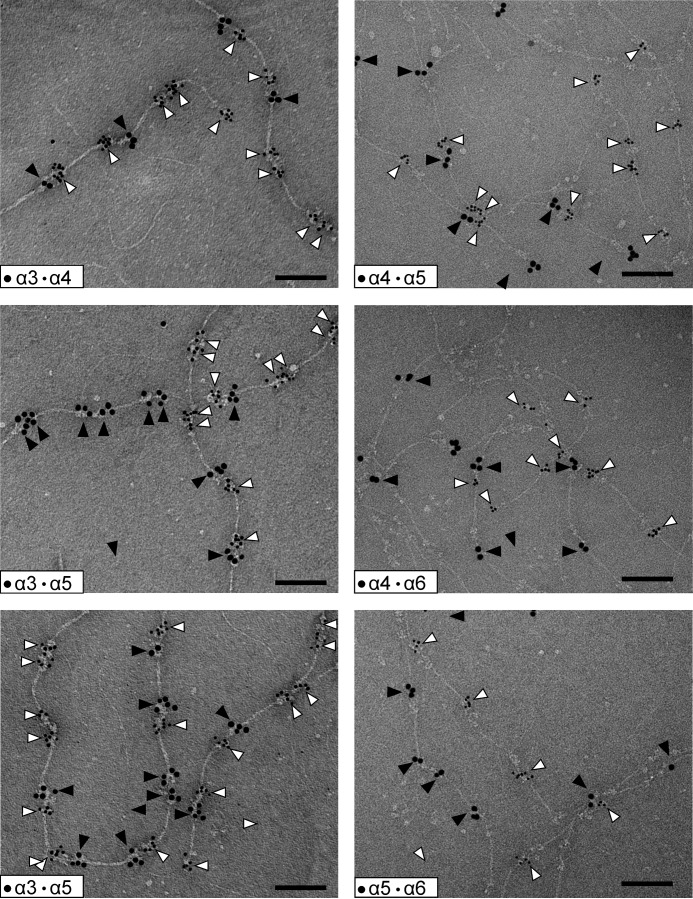
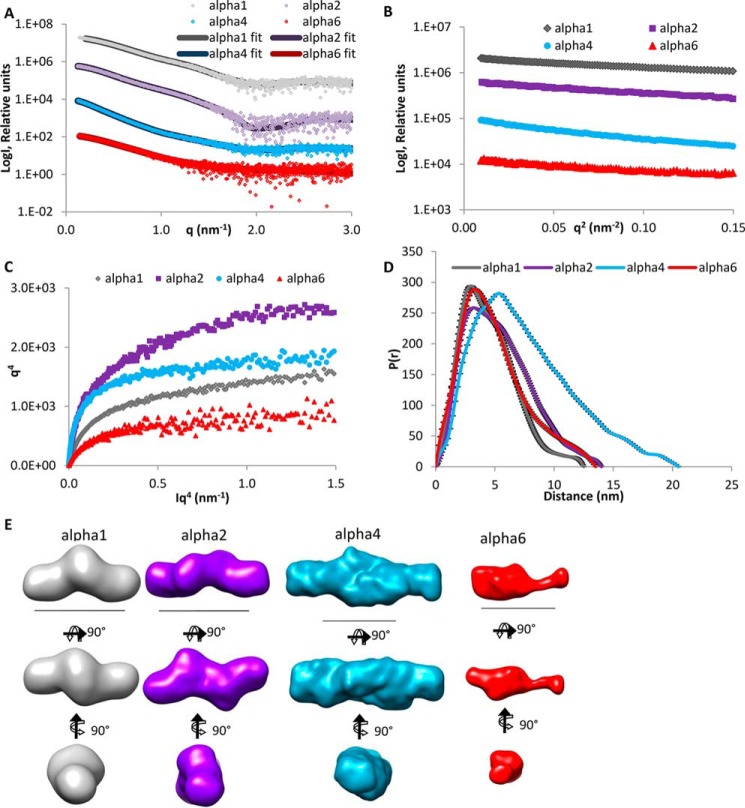
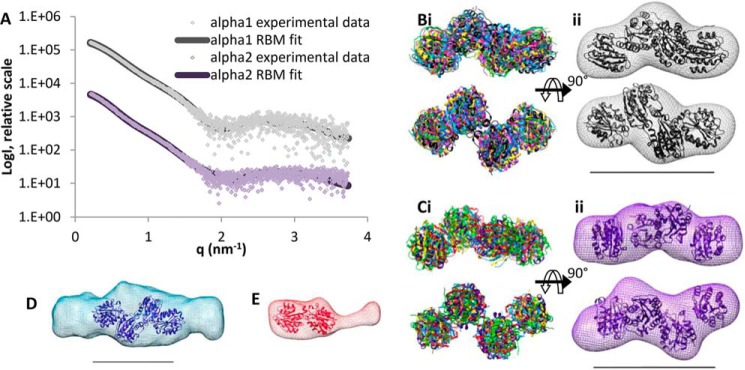
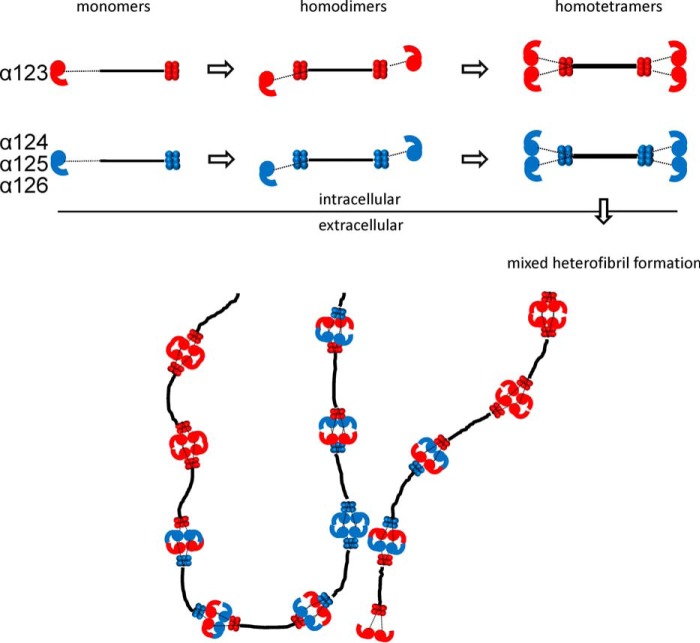
Collagen VI, a collagen with uncharacteristically large N- and C-terminal non-collagenous regions, forms a distinct microfibrillar network in most connective tissues. It was long considered to consist of three genetically distinct α chains (α1, α2, and α3). Intracellularly, heterotrimeric molecules associate to form dimers and tetramers, which are then secreted and assembled to microfibrils. The identification of three novel long collagen VI α chains, α4, α5, and α6, led to the question if and how these may substitute for the long α3 chain in collagen VI assembly. Here, we studied structural features of the novel long chains and analyzed the assembly of these into tetramers and microfibrils. N- and C-terminal globular regions of collagen VI were recombinantly expressed and studied by small angle x-ray scattering (SAXS). Ab initio models of the N-terminal globular regions of the α4, α5, and α6 chains showed a C-shaped structure similar to that found for the α3 chain. Single particle EM nanostructure of the N-terminal globular region of the α4 chain confirmed the C-shaped structure revealed by SAXS. Immuno-EM of collagen VI extracted from tissue revealed that like the α3 chain the novel long chains assemble to homotetramers that are incorporated into mixed microfibrils. Moreover, SAXS models of the C-terminal globular regions of the α1, α2, α4, and α6 chains were generated. Interestingly, the α1, α2, and α4 C-terminal globular regions dimerize. These self-interactions may play a role in tetramer formation.

Keywords: VWA domain; collagen; electron microscopy (EM); extracellular matrix; microfibrils; single particle analysis; small-angle x-ray scattering (SAXS).


Figures

FIGURE 1.
FIGURE 1.
Domain structure (A) and assembly (B) of collagen VI chains. A, positions of the cysteine residues are marked by asterisks above each chain. The domain structure is as shown in Ref. . VWA, von Willebrand factor type A domain, Fn3, Fibronectin type 3 domain. B, intracellularly the heterotrimeric monomers assemble to tetramers that are secreted and form microfibrils in the extracellular space. Adapted from Ref. .
FIGURE 2.
FIGURE 2.
Purification of recombinant N-terminal (A) and C-terminal (B) regions of collagen VI α1, α2, α4, α5, and α6 chains. Left side, size-exclusion chromatography (example runs are shown) was performed to further purify the protein samples that were obtained after affinity purification and to remove higher aggregates. Absorption was normalized for the main peaks of the different chromatograms. Collected fractions are indicated by arrows. Right side, purity of the fractions was evaluated by SDS-PAGE and subsequent Ponceau staining (α5 chain) (A) or Western blotting (α4 and α6 chain) using chain-specific antibodies (A) or Coomassie staining (B).
FIGURE 3.
FIGURE 3.
SAXS data collected for the N-terminal regions of the collagen VI α4, α5, and α6 chains. A, SAXS profile showing the log of x-ray scattering intensity (LogI) as a function of the scattering vector q for the experimental scattering data with the DAMMIN fit with lowest χ value superimposed. B, Guinier plot (logI versus q2) of the low q region of the x-ray scattering data where the radius of gyration (Rg) can be measured from the gradient of the slope (−Rg2/3). C, q4 plot does not show a plateau, whereas the q3 plot (D) has a linear plateau that indicates some flexibility in the N-terminal regions. E, P(r) distribution plot shows the probability of different distances found within the protein. The longest distance is indicated by the Dmax. F, ab initio models generated from the SAXS data shown in three orthogonal orientations. Scale bar, 10 nm. For all panels, the α4, α5, and α6 chains are shown in blue, green, and red, respectively. The ab initio model of the α3 N9 to N1 region from Ref. is shown in yellow for comparison.
FIGURE 4.
FIGURE 4.
Nanostructure of the N-terminal region of the collagen VI α4 chain and comparison with the N-terminal regions of the α3, α5, and α6 chains. A, representative class averages of the α4 chain generated by reference-free classification using the IMAGIC-5 image processing and analysis software (Image Science, Germany). These class averages were used to generate the three-dimensional reconstruction. B, back-projections of the three-dimensional reconstruction, showing similarity to corresponding class averages. C, three-dimensional reconstruction of the N-terminal region of the α4 chain generated by single particle analysis shown in three orthogonal views. Scale bar, 10 nm. Representative class averages generated by reference-free classification using the IMAGIC-5 software for the α3 (D), α5 (E), and α6 chains (F). All boxes have a size of 35.8 × 35.8 nm.
FIGURE 5.
FIGURE 5.
Rigid body modeling of the N-terminal region of the collagen VI α4 chain and comparison with SAXS ab initio and EM data. A, panel i, six superimposed RBM simulations for the N-terminal region of the α4 chain shown in two orientations and the theoretical scattering of the rigid body modeling with lowest χ value compared with the experimental scattering data (A, panel ii). B, ensemble of models produced using EOM from the x-ray scattering data and their relative proportions and maximum dimension (Dmax). C, EM map (left) and ab initio model (right) for the N-terminal region of the α4 chain both with a representative model superimposed. For all panels the scale bar is 10 nm.
FIGURE 6.
FIGURE 6.
Immunoblot analysis of collagen VI. A, collagen VI purified from whole newborn mouse carcasses was separated in agarose/polyacrylamide composite gels under non-reducing conditions and was detected with affinity-purified chain-specific long chain antibodies from rabbit (α4 and α6, red) and guinea pig (α3 and α4, green) and secondary antibodies labeled with spectrally distinct infrared fluorescent dyes. The relative mobility of tetramers is indicated (T). B, collagen VI purified from whole newborn mouse carcasses was separated in normal SDS-polyacrylamide gels under reducing conditions and detected with polyclonal antibodies specific for the collagen VI α1–α6 chains.
FIGURE 7.
FIGURE 7.
Composition of collagen VI tetramers as detected by electron microscopy after negative staining. Representative collagen VI tetramers from E14.5 mouse lung containing different long α chains are shown. Only homotetramers were detected. The N-terminal regions of the long chains were doubly labeled using specific gold-labeled antibodies against the different α chains. Small gold particles (open arrowheads) always stain the α chain with the lower number, whereas the large gold particles (filled arrowheads) stain that with the higher number. Scale bar, 100 nm.
FIGURE 8.
FIGURE 8.
Structure of collagen VI microfibrils as detected by electron microscopy after negative staining. Representative collagen VI microfibrils from E14.5 mouse lung composed of tetramers containing different long chains are shown. Only homotetramers were detected. The N-terminal regions of the long chains were double labeled using specific gold-labeled antibodies against the different α chains. Small gold particles (open arrowheads) always stain the α chain with the lower number, whereas the large gold particles (filled arrowheads) stain that with the higher number. Note that as the tetramers overlap the “outer” globules belong to the same tetramer, and the “inner” globules belong to the neighboring tetramers. This is indicated in Fig. 11 in a schematic drawing of the mixed α3/α6 microfibril. Scale bar, 100 nm.
FIGURE 9.
FIGURE 9.
SAXS data collected for the C-terminal regions of the collagen VI α1, α2, α4, and α6 chains. A, SAXS profile showing the log of x-ray scattering intensity (LogI) as a function of the scattering vector q for the experimental scattering data with the DAMMIN fit with lowest χ value superimposed. B, Guinier plot (logI versus q2) of the low q region of the x-ray scattering data where the radius of gyration (Rg) can be measured from the gradient of the slope (−Rg2/3). C, q4 plot has a linear plateau that indicates that these regions are not flexible. D, P(r) distribution plot shows the probability of different distances found within the protein. The longest distance is indicated by the Dmax. E, ab initio models generated from the SAXS data shown in three orthogonal orientations. Scale bar, 10 nm. For all panels, the α1, α2, α4, and α6 chains are shown in gray, purple, blue, and red, respectively.
FIGURE 10.
FIGURE 10.
Rigid body modeling of collagen VI C-terminal regions and comparison with SAXS ab initio models. A, theoretical scattering of representative RBMs was compared with the experimental scattering data of the C-terminal regions of the α1 and α2 chains. B, panel i, six superimposed RBM simulations for the C-terminal region of the α1 chain, and panel ii, ab initio model for the C-terminal region of the α1 chain with a representative RBM superimposed, both shown in two orientations. C, similar to the C-terminal region of the α2 chain. D, two VWA domain pairs superimposed into the α4 chain ab initio model indicating that the C-terminal region of the α4 chain is dimeric with four VWA domains accommodated in the central density and two symmetric protrusions. E, however, the C-terminal region of the α6 chain is monomeric and can only accommodate one VWA domain pair and the additional domain is seen as an elongated protrusion. For all panels the scale bar is 10 nm.
FIGURE 11.
FIGURE 11.
Assembly of heterogeneous collagen VI microfibrils. Schematic drawing of the assembly of the heterogeneous microfibrils. The composition of the schematically drawn microfibrils below reflects the composition of the mixed microfibrils containing the α3 and the α6 chain shown in Fig. 8. Collagenous domain, black; non-collagenous regions of the α3 chain, red; non-collagenous regions of the α4, α5, and α6 chains, blue.

References

    1. Cescon M., Gattazzo F., Chen P., and Bonaldo P. (2015) Collagen VI at a glance. J. Cell Sci. 128, 3525–3531 - PubMed
    1. Keene D. R., Engvall E., and Glanville R. W. (1988) Ultrastructure of type VI collagen in human skin and cartilage suggests an anchoring function for this filamentous network. J. Cell Biol. 107, 1995–2006 - PMC - PubMed
    1. Bidanset D. J., Guidry C., Rosenberg L. C., Choi H. U., Timpl R., and Hook M. (1992) Binding of the proteoglycan decorin to collagen type VI. J. Biol. Chem. 267, 5250–5256 - PubMed
    1. Burg M. A., Tillet E., Timpl R., and Stallcup W. B. (1996) Binding of the NG2 proteoglycan to type VI collagen and other extracellular matrix molecules. J. Biol. Chem. 271, 26110–26116 - PubMed
    1. Finnis M. L., and Gibson M. A. (1997) Microfibril-associated glycoprotein-1 (MAGP-1) binds to the pepsin-resistant domain of the α3(VI) chain of type VI collagen. J. Biol. Chem. 272, 22817–22823 - PubMed

Publication types

Substances

LinkOut - more resources