. 2016 Jan 8:7:10241.
doi: 10.1038/ncomms10241.

Protein-targeted corona phase molecular recognition

Affiliations

Protein-targeted corona phase molecular recognition

Gili Bisker et al. Nat Commun. .

Abstract

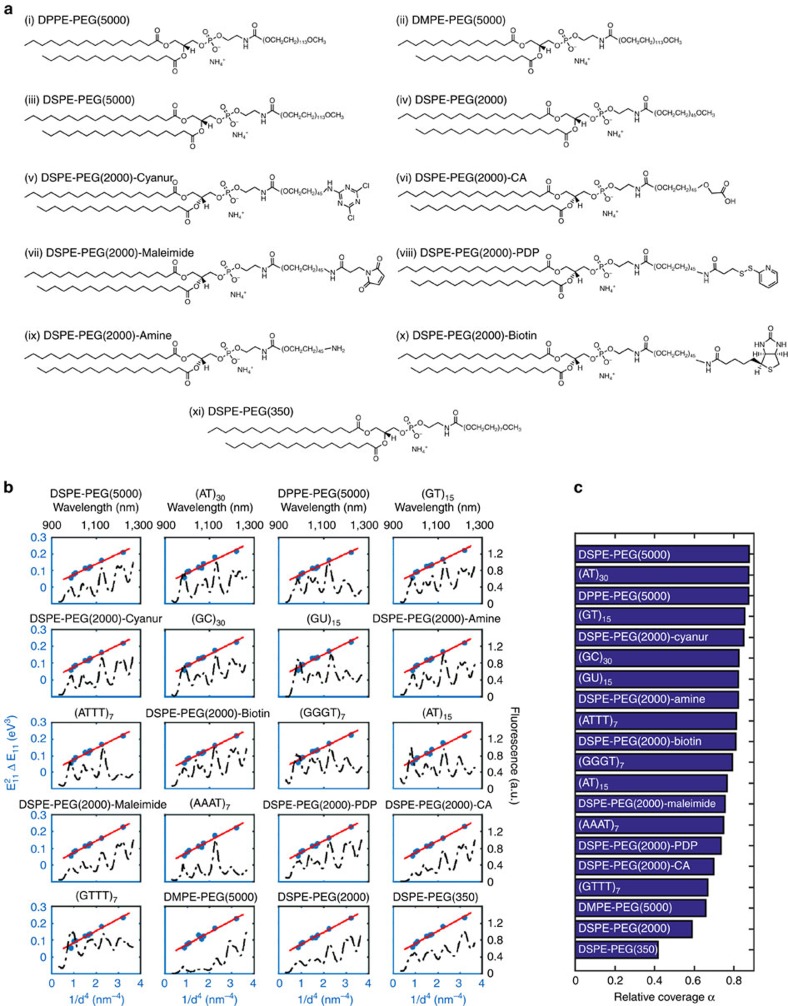
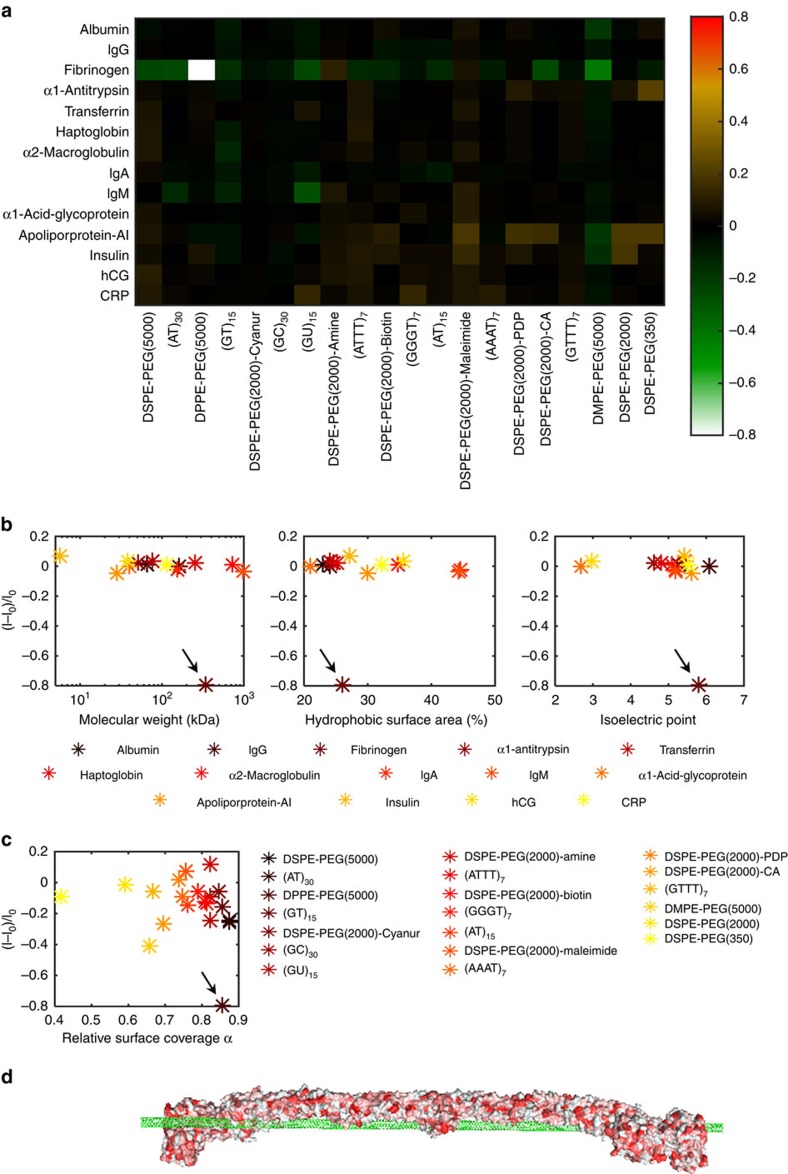
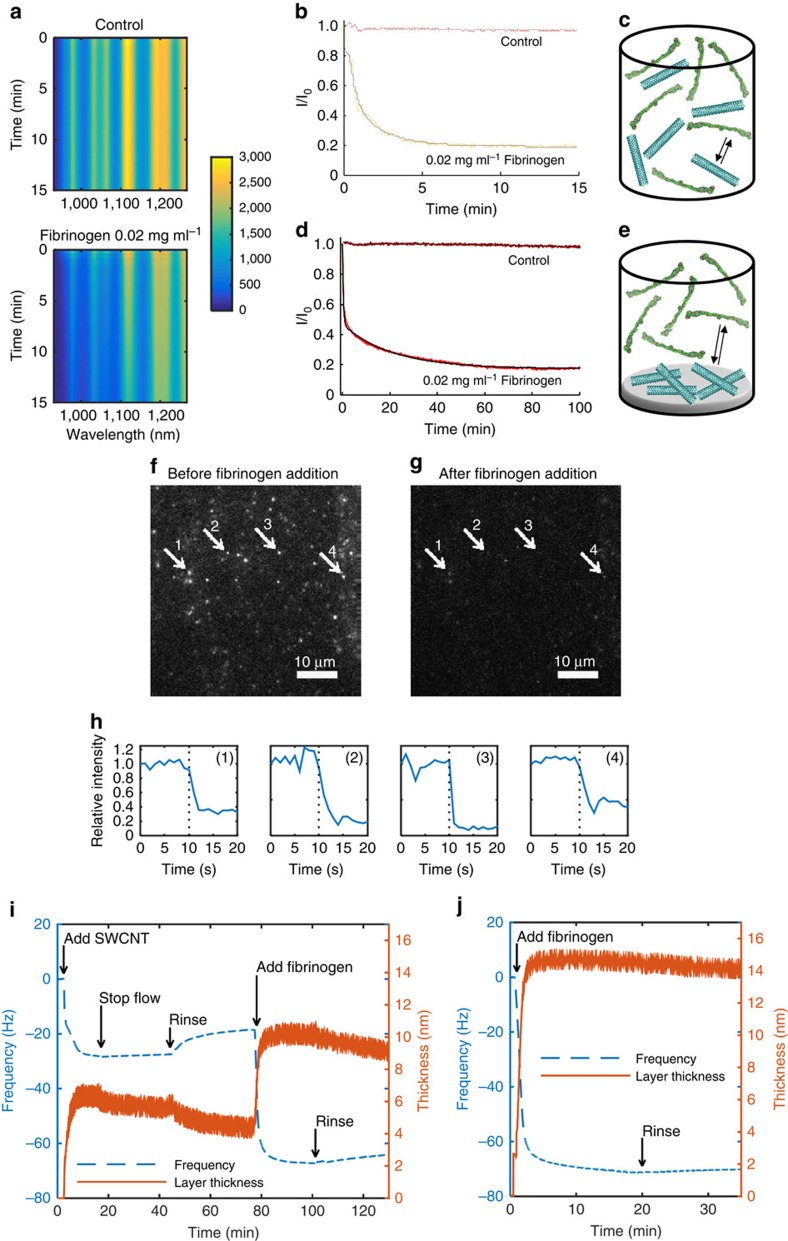
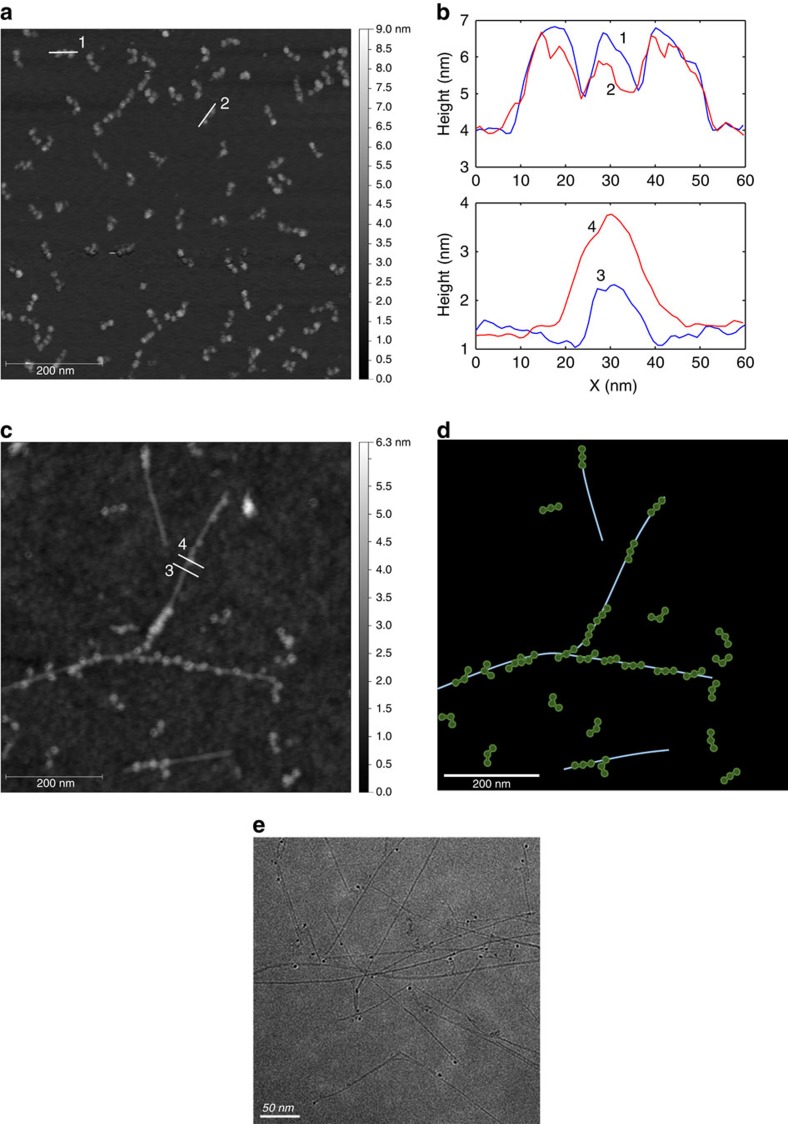
Corona phase molecular recognition (CoPhMoRe) uses a heteropolymer adsorbed onto and templated by a nanoparticle surface to recognize a specific target analyte. This method has not yet been extended to macromolecular analytes, including proteins. Herein we develop a variant of a CoPhMoRe screening procedure of single-walled carbon nanotubes (SWCNT) and use it against a panel of human blood proteins, revealing a specific corona phase that recognizes fibrinogen with high selectivity. In response to fibrinogen binding, SWCNT fluorescence decreases by >80% at saturation. Sequential binding of the three fibrinogen nodules is suggested by selective fluorescence quenching by isolated sub-domains and validated by the quenching kinetics. The fibrinogen recognition also occurs in serum environment, at the clinically relevant fibrinogen concentrations in the human blood. These results open new avenues for synthetic, non-biological antibody analogues that recognize biological macromolecules, and hold great promise for medical and clinical applications.


Figures

Figure 1
Figure 1. SWCNT suspension library.
(a) The structure of the phospholipid-PEG constructs used in this study to suspend the SWCNT. (i) DPPE-PEG(5000), (ii) DMPE-PEG(5000), (iii) DSPE-PEG(5000), (iv) DSPE-PEG(2000), (v) DSPE-PEG(2000)-Cyanur, (vi) DSPE-PEG(2000)-carboxylic acid (CA), (vii) DSPE-PEG(2000)-Maleimide, (viii) DSPE-PEG(2000)-[3-(2-Pyridyldithio)-propionyl] (PDP), (ix) DSPE-PEG(2000)-Amine, (x) DSPE-PEG(2000)-Biotin, (xi) DSPE-PEG(350). The number in parentheses is the molecular weight of the PEG chain in Daltons. (b) The solvatochromic shift as a function of the SWCNT diameter to the power of negative 4 (d−4, blue dots) and its linear fit (solid red curve), and the fluorescent emission intensity for each wrapping (dashed black curve). (c) The relative surface coverage of the polymer wrappings ranked in descending order.
Figure 2
Figure 2. Protein CoPhMoRe screen.
(a) Heat-map of the normalized response of the joint peak of the (9,4) and (7,6) SWCNT chiralities to the various proteins. The SWCNT and proteins concentrations were 1 mg l−1 and 20 μg ml−1, respectively. (b) The normalized emission intensity response (II0)/I0, where I and I0 are the final and initial fluorescent intensities, respectively, of DPPE-PEG(5000)-SWCNT versus the protein parameters: molecular weight, relative hydrophobic surface area and isoelectric point. The black arrows point to the fibrinogen data points. (c) The normalized emission intensity response of the various SWCNT suspensions to fibrinogen versus the relative surface coverage. The black arrow points to the DPPE-PEG(5000) data point. Each value represents the average of three replicates. (d) Illustration of the possible fibrinogen—SWCNT interaction. The fibrinogen surface is coloured according to the hydrophobicity of each amino acid ranging from white (hydrophilic) to red (hydrophobic).
Figure 3
Figure 3. Fluorescence spectroscopy of the SWCNT–fibrinogen interaction.
(a) Relative fluorescent response of DPPE-PEG(5000)-SWCNT (1 mg l−1) sensor to fibrinogen fragments (20 μg ml−1). (b) Fluorescent emission spectra of DPPE-PEG(5000)-SWCNT with 0, 10−4, 2 × 10⁻⁴, 4 × 10⁻⁴, 8 × 10⁻⁴, 1.2 × 10⁻³, 1.6 × 10⁻³, 2 × 10⁻³, 4 × 10⁻³, 8 × 10⁻³, 1.2 × 10⁻², 1.6 × 10⁻², 2 × 10⁻², 4 × 10⁻², 8 × 10⁻² and 0.2 mg ml−1 fibrinogen show substantial decrease in emission intensity with increasing protein concentration. Inset: absorption spectra of DPPE-PEG(5000)-SWCNT suspension before (solid black curve) and after (dashed red curve) the addition of 0.02 mg ml−1 fibrinogen. (c) Excitation–emission profile of the DPPE-PEG(5000)-SWCNT solution before and (d) after the addition of 0.02 mg ml−1 fibrinogen. (e) The normalized fluorescent response of the various chiralities in the DPPE-PEG(5000)-SWCNT suspension to the addition of different concentrations of fibrinogen (dots). The fit according to the model described in the text is plotted as solid lines. (f) The parameters of the model used for data fitting in d and their 95% confidence intervals. Dashed lines are guides to the eye. Top panel: the proportional parameter β used to fit the normalized fluorescent response model. Bottom panel: the parameters Kd1, and (Kd23)1/2 used to fit the normalized fluorescent response model (blue squares and red circles, respectively). (g) Wavelength redshift of the (6,5) fluorescent emission peak of the DPPE-PEG(5000)-SWCNT suspension to the addition of different concentrations of fibrinogen (dots). The fit according to the model described in the text is plotted as a solid line. (h) Sensor performance in a complex environment: relative fluorescent response of DPPE-PEG(5000)-SWCNT suspension following a two-step analyte addition. First, either albumin (columns 1–3), fibrinogen (columns 4–6), or an equal mixture of both (columns 7–9) was added to the solution to a final concentration of 20 μg ml−1 and incubated for an hour. Then either PBS (columns 1, 4 and 7), albumin (columns 2, 5 and 8), or fibrinogen (columns 3, 6 and 9) was added to a final protein concentration of 40 μg ml−1. The fluorescent response was measured after an additional 1 h incubation. (i) Relative fluorescent response of DPPE-PEG(5000)-SWCNT (5 mg l−1) sensor to fibrinogen (0.05, 0.5 and 5 mg ml−1) in serum. Error bars represent the s.d. between three replicate experiments.
Figure 4
Figure 4. Dynamics of the SWCNT–fibrinogen interaction.
(a) Fluorescent emission spectra of 1 mg l−1 DPPE-PEG(5000)-SWCNT, to which either PBS (top) or 0.02 mg ml−1 fibrinogen (bottom) was added 10 s after the beginning of the experiment. Since laser excitation was turned off while adding the solutions, the time point of the PBS or fibrinogen addition appears as a horizontal line with zero intensity. (b) The (10,2) chirality fluorescent emission peak over time of 1 mg l−1 DPPE-PEG(5000)-SWCNT, to which either PBS (control) or 0.02 mg ml−1 fibrinogen was added. Data taken from a. (c) Illustration of solution phase experiment. (d) Fluorescent emission over time of immobilized DPPE-PEG(5000)-SWCNT in agarose hydrogel, to which either PBS (control) or 0.02 mg ml−1 fibrinogen was added. (e) Illustration of hydrogel phase experiment. (f) Single DPPE-PEG(5000)-SWCNT fluorescence recorded by a 2D nIR camera before and (g) after the addition of fibrinogen. (h) Corresponding intensity time traces of the four diffraction limited single SWCNT spots marked in panels f and g. The dotted line represent the time point at which fibrinogen was added. (i) Frequency change (dashed blue curve) and layer thickness (solid orange curve) as measured by QCM-D, and calculated by the Voigt viscoelastic model, respectively, for a fibrinogen layer deposited on top of a DPPE-PEG(5000)-SWCNT layer, and for (j) fibrinogen layer deposited directly on top of the gold-coated quartz crystal.
Figure 5
Figure 5. High resolution microscopy of the SWCNT–fibrinogen interaction.
(a) AFM image of fibrinogen molecules on MICA surface. Scale bar, 200 nm. (b) Height profiles along the lines in the AFM images. (c) AFM of DPPE-PEG(5000)-SWCNT with fibrinogen on a silicon wafer. Scale bar, 200 nm. (d) Illustration of the SWCNT (blue lines) and fibrinogen molecules (green dumbbells) in panel c. (e) Cryo-TEM image of DPPE-PEG(5000)-SWCNT with fibrinogen, showing individually suspended SWCNT and no bundling. The dark spheres are catalyst particles. Scale bar, 50 nm.

References

    1. de Silva A. P. et al. Signaling recognition events with fluorescent sensors and switches. Chem. Rev. 97, 1515–1566 (1997) . - PubMed
    1. Lavigne J. J. & Anslyn E. V. Sensing a paradigm shift in the field of molecular recognition: from selective to differential receptors. Angew. Chem. Int. Ed. 40, 3118–3130 (2001) . - PubMed
    1. Alexander C., Davidson L. & Hayes W. Imprinted polymers: artificial molecular recognition materials with applications in synthesis and catalysis. Tetrahedron 59, 2025–2057 (2003) .
    1. Kumar A., Sun S.-S. & Lees A. J. Directed assembly metallocyclic supramolecular systems for molecular recognition and chemical sensing. Coord. Chem. Rev. 252, 922–939 (2008) .
    1. Grzelczak M., Vermant J., Furst E. M. & Liz-Marzán L. M. Directed self-assembly of nanoparticles. ACS Nano 4, 3591–3605 (2010) . - PubMed

Publication types