. 2016 Jan 8:7:10242.
doi: 10.1038/ncomms10242.

Elevated glucose and oligomeric β-amyloid disrupt synapses via a common pathway of aberrant protein S-nitrosylation

Affiliations

Elevated glucose and oligomeric β-amyloid disrupt synapses via a common pathway of aberrant protein S-nitrosylation

Mohd Waseem Akhtar et al. Nat Commun. .

Abstract

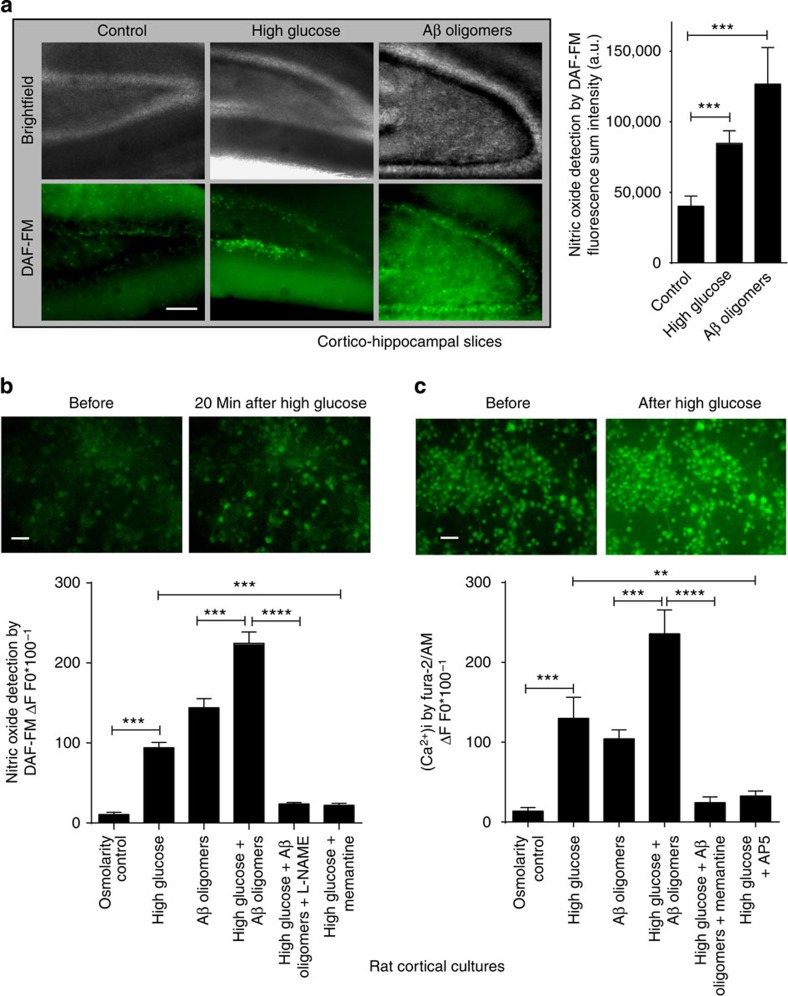
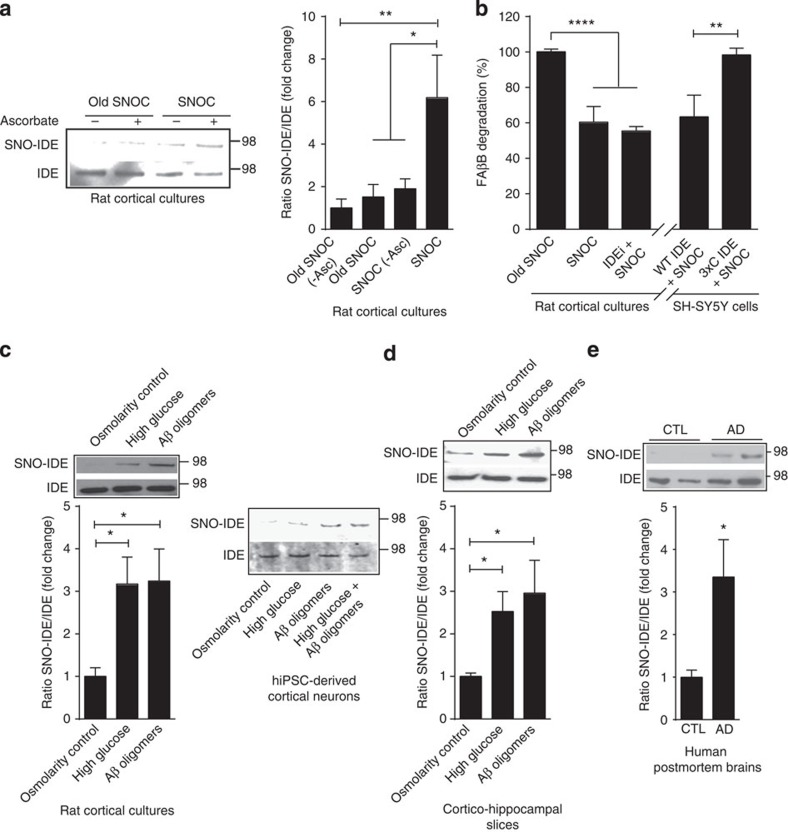
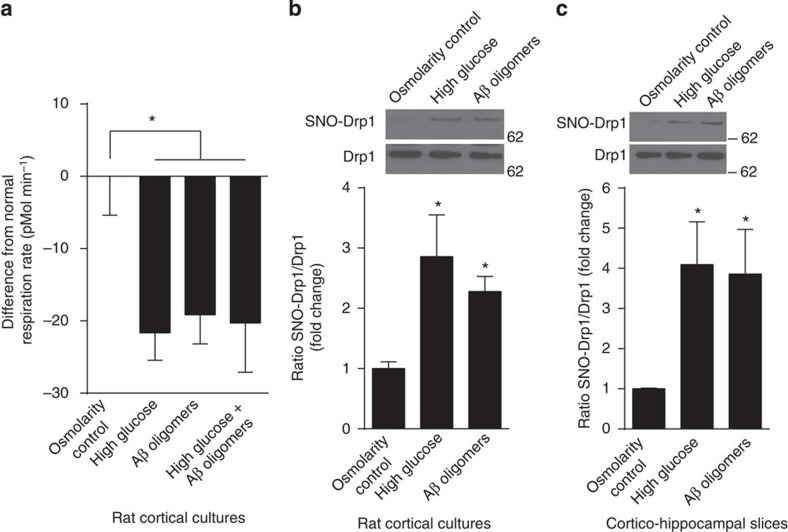
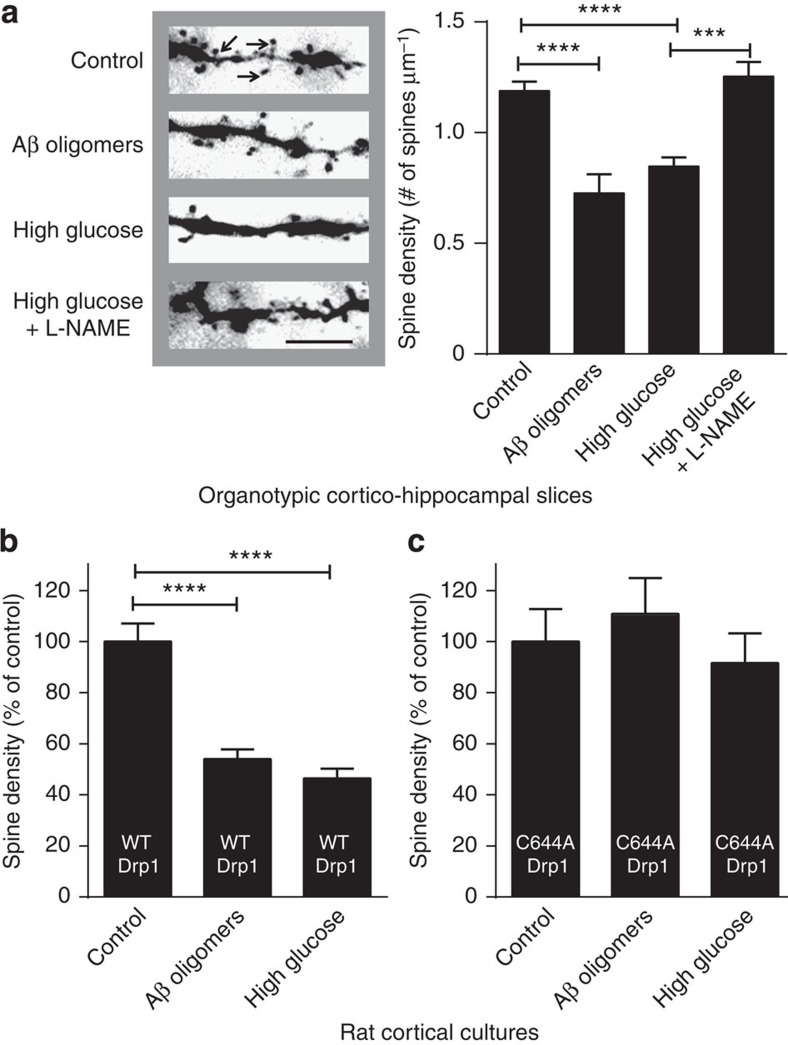
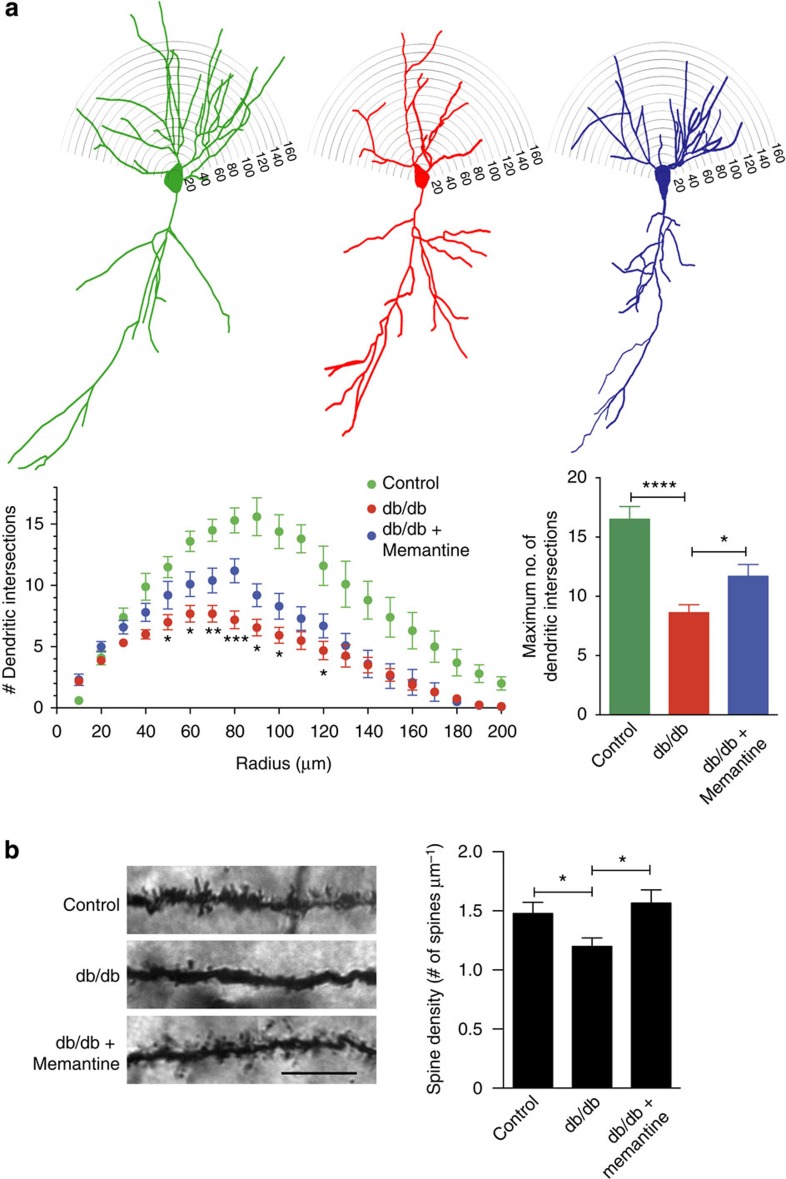
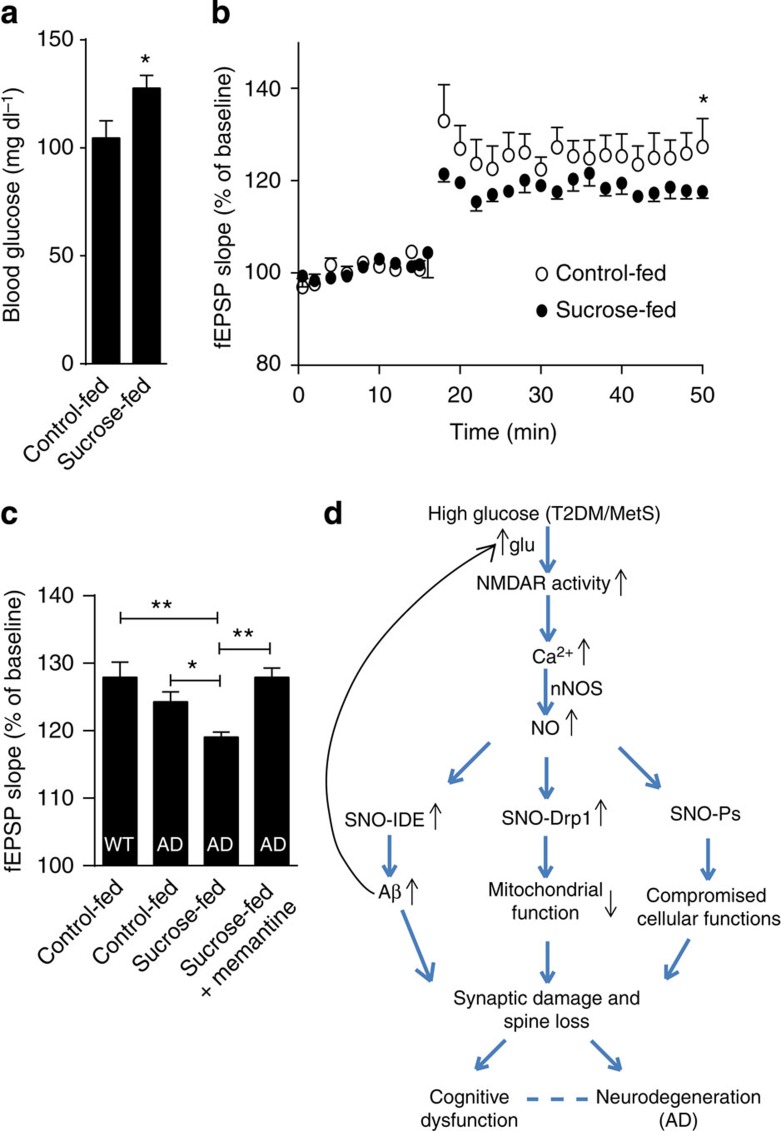
Metabolic syndrome (MetS) and Type 2 diabetes mellitus (T2DM) increase risk for Alzheimer's disease (AD). The molecular mechanism for this association remains poorly defined. Here we report in human and rodent tissues that elevated glucose, as found in MetS/T2DM, and oligomeric β-amyloid (Aβ) peptide, thought to be a key mediator of AD, coordinately increase neuronal Ca(2+) and nitric oxide (NO) in an NMDA receptor-dependent manner. The increase in NO results in S-nitrosylation of insulin-degrading enzyme (IDE) and dynamin-related protein 1 (Drp1), thus inhibiting insulin and Aβ catabolism as well as hyperactivating mitochondrial fission machinery. Consequent elevation in Aβ levels and compromise in mitochondrial bioenergetics result in dysfunctional synaptic plasticity and synapse loss in cortical and hippocampal neurons. The NMDA receptor antagonist memantine attenuates these effects. Our studies show that redox-mediated posttranslational modification of brain proteins link Aβ and hyperglycaemia to cognitive dysfunction in MetS/T2DM and AD.


Conflict of interest statement

S.A.L. is the named inventor on worldwide patents for memantine (Namenda®) for the treatment of neurodegenerative diseases. Following Harvard University guidelines, he participates in a royalty sharing agreement with his former institution Harvard Medical School/Boston Children's Hospital for the licensing of these patents to Forest Laboratories (now Actavis, Inc.). He is also a Scientific Founder of Adamas Pharmaceuticals, Inc., which has agreements with Forest Laboratories/Actavis for the co-development and marketing of long-lasting formulations of memantine. The remaining authors declare competing interests.

Figures

Figure 1
Figure 1. High glucose levels and oligomeric Aβ increase nitric oxide (NO) and neuronal calcium [Ca2+]i in acute cortico-hippocampal slices and cortical neuronal cultures.
(a) High glucose (25 mM) or oligomeric Aβ (250 nM) increase NO levels in acute cortico-hippocampal slices, monitored with DAF-FM imaging. Values are mean+s.e.m., n≥3; ***P<0.001 by ANOVA with Dunnett's post hoc test (Scale bar, 50 μm). (b) Quantitative DAF-FM imaging of cortical neurons showing increased NO after exposure to high glucose (20 mM above ambient levels) or Aβ oligomers (250 nM). Memantine (10 μM) inhibited the increase in NO in response to high glucose. Combined exposure to high glucose and Aβ manifested additive effects on NO that were inhibited by treatment with L-NAME (1 mM). Mannitol (20 mM) was used as a control for possible effects of osmolarity. For this and subsequent panels, fluorescence intensity change was calculated as ΔF/F0, plotted as a fraction of 100. Values are mean+s.e.m., n≥40 neurons for each condition; **P<0.01, ***P<0.001, ****P<0.0001 by ANOVA with Dunnett's post hoc test (Scale bar, 20 μm). (c) High glucose enhances Aβ-induced increases in [Ca2+]i in cultured rat primary cortical neurons, monitored with fura-2/AM (n=∼15 cells for each condition); memantine (10 μM) or AP5 (100 μM) blocked the increase. Values are mean+s.e.m., n≥40 neurons for each condition; **P<0.01, ***P<0.001, ****P<0.0001 by ANOVA with Dunnett's post hoc test (Scale bar, 20 μm).
Figure 2
Figure 2. S-Nitrosylation and inhibition of neural IDE.
(a) SNO-IDE in cortical cultures. Biotin switch assay after 30-min exposure to 200 μM SNOC. Bottom panel, loading control. Densitometry shown on right. As a control, sodium ascorbate (20 mM) was omitted. Values are mean+s.e.m., n=3; *P<0.05, **P<0.01 by ANOVA with Fisher's Protected Least Significant Difference (PLSD) post hoc test. (b) S-Nitrosylation of IDE inhibits its activity. Left: less FAβB peptide degradation in cortical lysates following cell exposure to SNOC. Addition of the IDE-specific inhibitor, IDEi, produced similar results. Right: non-nitrosylatable IDE rescues IDE activity in SH-SY5Y cells after SNOC exposure. Overexpressed WT-IDE, but not non-nitrosylatable (triple-cysteine mutant) IDE, significantly decreased FAβB after SNOC exposure. Values are mean+s.e.m., n≥3; **P<0.01, ****P<0.0001 by ANOVA with Tukey's post hoc test. (c) High glucose and oligomeric Aβ induce SNO-IDE formation in cortical cultures and in hiPSC-derived neurons by biotin switch assay. Cortical cultures (15 days in vitro (DIV)) or hiPSC-derived neurons (100 days post differentiation) were exposed to high glucose (20 mM) or oligomeric Aβ (250 nM) for 2 h. Equimolar mannitol served as an osmolarity control for high glucose. Values are mean+s.e.m., n=3, *P<0.05 by ANOVA with Fisher's PLSD post hoc test. (d) Acute rat cortico-hippocampal slices were exposed to high glucose, equimolar mannitol osmolarity control or oligomeric Aβ for 2 h. Biotin switch detected SNO-IDE. Values are mean+s.e.m., n=3, *P<0.05 by ANOVA with Fisher's PLSD post hoc test. (e) Detection of S-nitrosylated (SNO-) IDE in human post-mortem brain lysates by biotin switch. Values are mean+s.e.m., n≥6, *P<0.05 by Student's t-test.
Figure 3
Figure 3. High glucose and oligomeric Aβ induce formation of SNO-Drp1 in cortical cultures and cortico-hippocampal slices and impair respiratory reserve.
(a) Mitochondrial O2 consumption by cortical cultures was monitored using the Seahorse platform after exposure to high glucose (20 mM), equimolar mannitol as an osmolarity control or oligomeric Aβ (250 nM) for 72 h. Basal respiratory rate was measured in triplicate. Values are mean+s.e.m., n≥12, *P<0.05 by ANOVA with Tukey's post hoc test. (b) Cortical cultures (15 DIV) were exposed to high glucose (20 mM) or oligomeric Aβ (250 nM) for 2 h. Equimolar mannitol served as an osmolarity control for high glucose. Lysates were then analysed by biotin switch for SNO-Drp1. Values are mean+s.e.m., n≥3, *P<0.05 by ANOVA with Fisher's PLSD post hoc test. (c) Acute rat cortico-hippocampal slices were exposed to high glucose, equimolar mannitol osmolarity control or oligomeric Aβ for 2 h. Biotin switch detected SNO-Drp1. Values are mean+s.e.m., n=3, *P<0.05 by ANOVA with Fisher's PLSD post hoc test.
Figure 4
Figure 4. High glucose and oligomeric Aβ decrease dendritic spine density in a Drp1-dependent manner.
(a) Dendritic spine density in organotypic cortico-hippocampal slices from YFP-transgenic mice after a 7-day exposure to high (25 mM) glucose or oligomeric Aβ (250 nM). Left: images of YFP-labelled dendritic spines (arrows) under epifluorescence microscopy (Scale bar, 10 μm). Right: quantification of spine density. The NOS inhibitor L-NAME (1 mM) prevented the decrease in spine density engendered by high glucose. Values are mean+s.e.m., n≥4 for each group, ***P<0.001, ****P<0.0001 by ANOVA with Tukey's post hoc test. (b) Overexpression of WT Drp1 did not substantially attenuate the spine loss due to high glucose of oligomeric Aβ in cortical cultures. Values are mean+s.e.m., n≥6, ****P<0.0001 by ANOVA with Tukey's post hoc test. (c) Overexpression of non-nitrosylatable Drp1 (C644A) mutant during exposure to high glucose or oligomeric Aβ resulted in spine number that was not statistically different from control. Values are mean+s.e.m., n≥10.
Figure 5
Figure 5. Chronic memantine treatment rescues dendritic arborization and synaptic density in a T2DM mouse model.
(a) db/db mice show a significant decrease in dendritic branching in CA1 pyramidal neurons compared to heterozygous (db/+) controls. Chronic memantine treatment partially rescues the defect. Upper: representative delineated profiles of CA1 hippocampal pyramidal neurons with dendritic tree. Lower left: plot of dendritic intersections as a function of radius. Values are mean+s.e.m., n≥10 neurons from each of three mice, *P<0.05, **P<0.01, ***P<0.001 by ANOVA using repeated measures with Fisher's PLSD post hoc test. Lower right: quantification of total dendritic branching. Values are mean+s.e.m., n≥10 neurons from each of three mice, ****P<0.0001, *P<0.05 by ANOVA with Tukey's post hoc test. (b) db/db mice show a significant decrease in synaptic spine density in CA1 pyramidal neurons compared with controls. Chronic treatment with memantine completely reversed the loss of spines. Left: representative images of Golgi-stained dendrites from CA1 pyramidal neurons (Scale bar, 10 μm). Right: quantification of dendritic spine densities. Values are mean+s.e.m., n≥12 dendrites from three mice each, *P<0.05 by ANOVA with Fisher's PLSD post hoc test.
Figure 6
Figure 6. High glucose enhances LTP deficits in the 3 × Tg-AD mouse model.
(a) Sucrose-fed 3 × Tg AD mice show a significant increase in blood glucose levels compared to controls. Values are mean+s.e.m., n=10, P<0.05 by Student's t-test. (b) Hippocampal LTP in 3 × Tg-AD mice. Initial slope of field excitatory postsynaptic potentials (fEPSP) in CA1 pyramidal cells was measured after stimulation of the Schaffer collaterals. Sucrose-fed 3 × Tg-AD mice displayed a significant decrease in LTP compared with controls. (c) Percent potentiation of fEPSP over baseline at 50 min after first tetanus in control (WT) and 3 × Tg-AD mice fed with water containing sucrose, sucrose+0.01% memantine (calculated to provide a dose of 2 mg per kg per day), or normal water. Values are mean+s.e.m., n≥5 mice per condition; *P<0.05, **P<0.01, by ANOVA with Fisher's PLSD post hoc test. (d) Schematic of high glucose and Aβ-induced aberrant S-nitrosylation mechanisms linking T2DM/MetS to AD. High glucose and oligomeric Aβ lead to increased glutamate (glu) release, stimulation of NMDARs, and increased influx of neuronal Ca2+ with consequent NO production. The resulting aberrant S-nitrosylation of IDE leads to increased levels of Aβ and insulin, and aberrant S-nitrosylation of Drp1 contributes to mitochondrial fragmentation and bioenergetic compromise. These redox-mediated changes, potentially among others (designated SNO-Ps in the figure, indicating other S-nitrosylated proteins), culminate in synaptic loss and neurodegeneration, compromising cognitive function in Alzheimer's disease (AD).

References

    1. Biessels G. J., Staekenborg S., Brunner E., Brayne C. & Scheltens P. Risk of dementia in diabetes mellitus: a systematic review. Lancet Neurol. 5, 64–74 (2006) . - PubMed
    1. Farooqui A. A., Farooqui T., Panza F. & Frisardi V. Metabolic syndrome as a risk factor for neurological disorders. Cell Mol. Life Sci. 69, 741–762 (2012) . - PMC - PubMed
    1. Park S. A. A common pathogenic mechanism linking type-2 diabetes and Alzheimer's disease: evidence from animal models. J. Clin. Neurol. 7, 10–18 (2011) . - PMC - PubMed
    1. Ramos-Rodriguez J. J. et al. Differential central pathology and cognitive impairment in pre-diabetic and diabetic mice. Psychoneuroendocrinology 38, 2462–2475 (2013) . - PubMed
    1. Crane P. K. et al. Glucose levels and risk of dementia. N. Engl. J. Med. 369, 540–548 (2013) . - PMC - PubMed

Publication types

MeSH terms