. 2016 Jan 7:17:23.
doi: 10.1186/s12859-015-0821-8.

Fast and accurate branch lengths estimation for phylogenomic trees

Affiliations

Fast and accurate branch lengths estimation for phylogenomic trees

Manuel Binet et al. BMC Bioinformatics. .

Abstract

Background: Branch lengths are an important attribute of phylogenetic trees, providing essential information for many studies in evolutionary biology. Yet, part of the current methodology to reconstruct a phylogeny from genomic information - namely supertree methods - focuses on the topology or structure of the phylogenetic tree, rather than the evolutionary divergences associated to it. Moreover, accurate methods to estimate branch lengths - typically based on probabilistic analysis of a concatenated alignment - are limited by large demands in memory and computing time, and may become impractical when the data sets are too large.

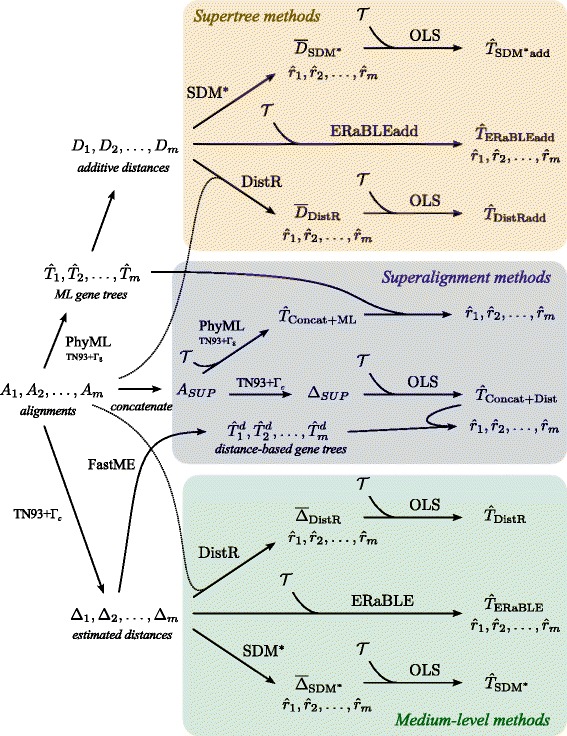
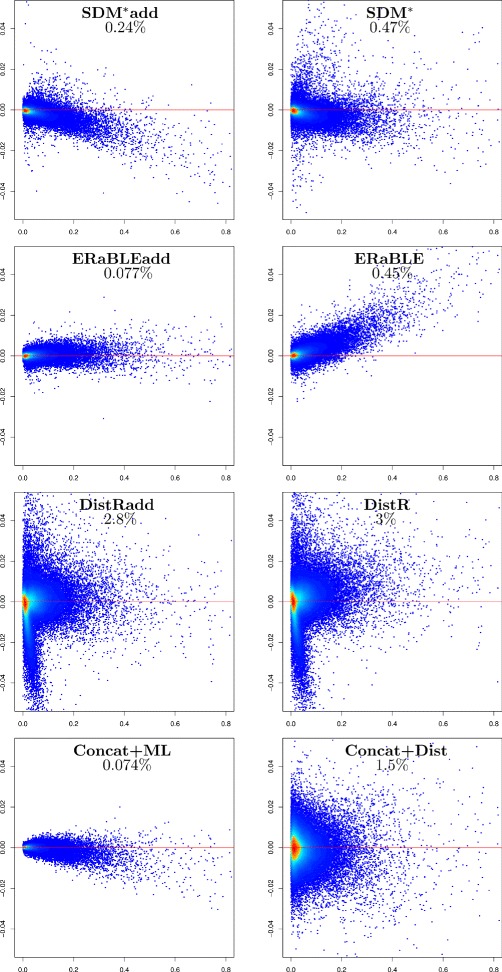
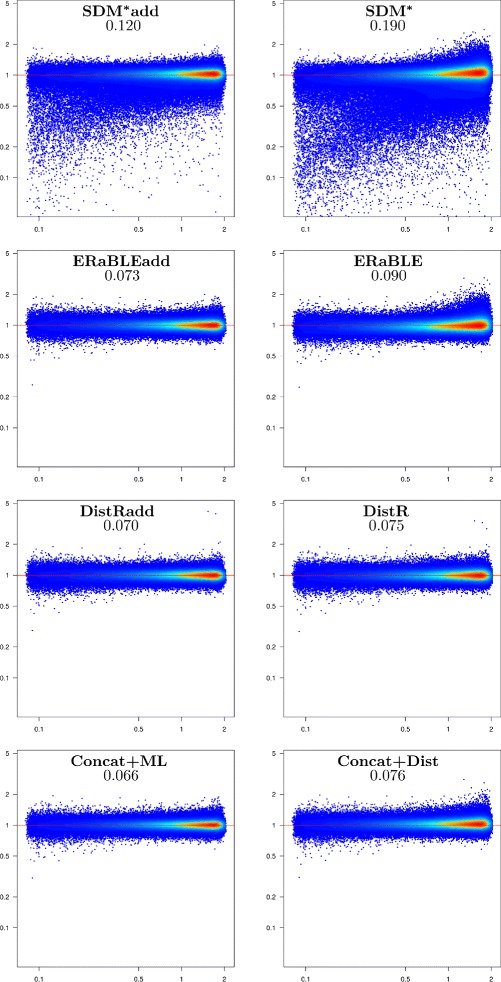
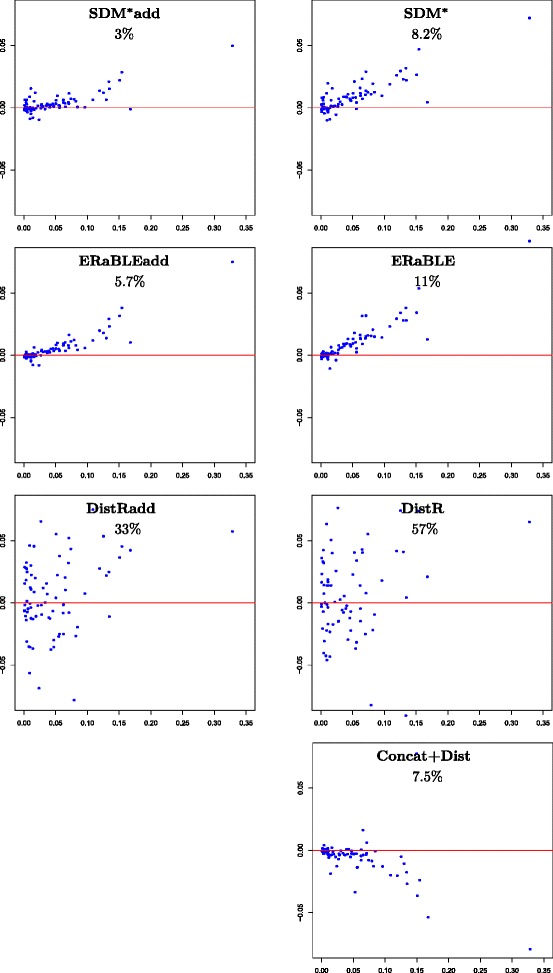
Results: Here, we present a novel phylogenomic distance-based method, named ERaBLE (Evolutionary Rates and Branch Length Estimation), to estimate the branch lengths of a given reference topology, and the relative evolutionary rates of the genes employed in the analysis. ERaBLE uses as input data a potentially very large collection of distance matrices, where each matrix is obtained from a different genomic region - either directly from its sequence alignment, or indirectly from a gene tree inferred from the alignment. Our experiments show that ERaBLE is very fast and fairly accurate when compared to other possible approaches for the same tasks. Specifically, it efficiently and accurately deals with large data sets, such as the OrthoMaM v8 database, composed of 6,953 exons from up to 40 mammals.

Conclusions: ERaBLE may be used as a complement to supertree methods - or it may provide an efficient alternative to maximum likelihood analysis of concatenated alignments - to estimate branch lengths from phylogenomic data sets.


Figures

Fig. 1
Fig. 1
Pipelines of the analyses applied to both data sets, represented as flowcharts. We refer to the “Analysis protocol” subsection for a detailed description of each analysis method
Fig. 2
Fig. 2
Accuracy of branch length estimates in the simulated data set. For each method, model branch lengths b e (x-axis) are plotted against estimation errors b^ebe (y-axis) for all branches in all 500 model trees (500×77=38,500 points per plot). Colors (from blue to red) indicate increased density of points. The horizontal red line corresponds to no estimation error. Method names are shown at the top of each plot, followed by the mean (over 500 values) of the fraction of variance unexplained of (b e) relative to (b^e) (see Additional file 3)
Fig. 3
Fig. 3
Estimation accuracy for gene rates in the simulated data set. Log-log scatterplots showing model gene rates r k (x-axis) against error ratios r^k/rk (y-axis) for all genes in all 500 replicates (500 × 500=250,000 points per plot). Note that errors are measured with ratios, instead of differences. Colors (from blue to red) indicate increased density of points. The horizontal red line corresponds to no estimation error. Method names are shown at the top of each plot, followed by the mean absolute log-ratio between estimated and model gene rates (see Additional file 3)
Fig. 4
Fig. 4
Accuracy of branch length estimates in the OrthoMaM data set. For each method, the 77 branch lengths b^eML estimated by Concat+ML (x-axis) are plotted against the differences b^eb^eML (y-axis) (where b^e is the estimate for the length of e obtained by the method at the top of the plot). The horizontal red line corresponds to no difference between the two estimates. Method names are shown at the top of each plot, followed by the fraction of variance unexplained of (b^eML) relative to (b^e) (see Additional file 3)
Fig. 5
Fig. 5
Estimation accuracy for gene rates in the OrthoMaM data set. Logarithmic scatterplots showing the 6,953 “reference” gene rates r^kML estimated by Concat+ML (x-axis), against ratios r^k/r^kML (y-axis). Note that errors relative to the reference gene rates are measured with ratios, instead of differences. Colors (from blue to red) indicate increased density of points. The horizontal red line corresponds to no difference between the two estimates. Method names are shown at the top of each plot, followed by the mean absolute log-ratio between estimated and reference gene rates (see Additional file 3)

References

    1. Burleigh JG, Bansal MS, Eulenstein O, Hartmann S, Wehe A, Vision TJ. Genome-scale phylogenetics: inferring the plant tree of life from 18,896 gene trees. Syst Biol. 2011;60(2):117–25. doi: 10.1093/sysbio/syq072. - DOI - PMC - PubMed
    1. Criscuolo A, Gribaldo S. Large-scale phylogenomic analyses indicate a deep origin of primary plastids within cyanobacteria. Mol Biol Evol. 2011;28(11):3019–32. doi: 10.1093/molbev/msr108. - DOI - PubMed
    1. Baker AJ, Haddrath O, McPherson JD, Cloutier A. Genomic support for a moa–tinamou clade and adaptive morphological convergence in flightless ratites. Mol Biol Evol. 2014;31(7):1686–96. doi: 10.1093/molbev/msu153. - DOI - PubMed
    1. Pupko T, Huchon D, Cao Y, Okada N, Hasegawa M. Combining multiple data sets in a likelihood analysis: which models are the best? Mol Biol Evol. 2002;19(12):2294–307. doi: 10.1093/oxfordjournals.molbev.a004053. - DOI - PubMed
    1. Bevan RB, Lang BF, Bryant D. Calculating the evolutionary rates of different genes: a fast, accurate estimator with applications to maximum likelihood phylogenetic analysis. Syst Biol. 2005;54(6):900–15. doi: 10.1080/10635150500354829. - DOI - PubMed

Publication types

LinkOut - more resources