. 2016 Jan 8:7:10178.
doi: 10.1038/ncomms10178.

Superactivation of AMPA receptors by auxiliary proteins

Affiliations

Superactivation of AMPA receptors by auxiliary proteins

Anna L Carbone et al. Nat Commun. .

Abstract

Glutamate receptors form complexes in the brain with auxiliary proteins, which control their activity during fast synaptic transmission through a seemingly bewildering array of effects. Here we devise a way to isolate the activation of complexes using polyamines, which enables us to show that transmembrane AMPA receptor regulatory proteins (TARPs) exert their effects principally on the channel opening reaction. A thermodynamic argument suggests that because TARPs promote channel opening, receptor activation promotes AMPAR-TARP complexes into a superactive state with high open probability. A simple model based on this idea predicts all known effects of TARPs on AMPA receptor function. This model also predicts unexpected phenomena including massive potentiation in the absence of desensitization and supramaximal recovery that we subsequently detected in electrophysiological recordings. This transient positive feedback mechanism has implications for information processing in the brain, because it should allow activity-dependent facilitation of excitatory synaptic transmission through a postsynaptic mechanism.


Figures

Figure 1
Figure 1. Isolating AMPAR-Stargazin complexes using intracellular polyamines.
(a) Currents from GluA2 receptors alone were blocked by polyamines and responses were indistinguishable from the noise at +50 mV (left). Only cells coexpressing GluA2 and Stargazin showed a current at +50 mV in the presence of 50 μM intracellular spermine (right). (b) GV relations in the presence of intracellular spermine for peak currents evoked by 10 mM glutamate for GluA2 alone (n=15), GluA2 cotransfected with Stargazin (n=9) and GluA2-Stargazin tandem (n=7). (c) Representative current responses from cells coexpressing GluA2 and Stargazin in response to 500 ms (left) and 1 ms (right) applications of glutamate recorded at +50 or −60 mV (with 50 μM intracellular spermine). Normalizing to the peak current revealed a greater apparent effect of Stargazin at +50 mV (bottom panels; ISS=20 and 12%; kdeact=700 and 1300, s−1 at +50 mV and −60 mV, respectively). (d) Currents from cells expressing the GluA2-Stargazin tandem showed no voltage dependence (ISS=18%; kdeact=1,100 and 1,000 s−1 at +50 mV and −60 mV, respectively). Representative solution exchange profiles are shown above the traces. (e) Voltage dependence of the rate of desensitization, the steady-state current and the deactivation rate of GluA2 cotransfected with Stargazin (red diamonds, n=10–44), GluA2-Stargazin tandem (orange circles, n=8–25) and GluA2 alone (black squares, n=10–30). Error bars represent s.e.m.
Figure 2
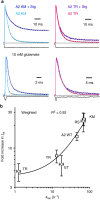
Figure 2. Kinetic effects of Stargazin are correlated to open state availability.
(a) Representative traces from GluA2 K761M (left) and GluA2 E713T/Y768R (right) with and without Stargazin evoked by long (top) and short (bottom) applications of 10 mM glutamate. Stargazin significantly affected channel kinetics for the fast recovering mutant A2 K761M (kdes=150 and 50 s−1; Iss=2 and 30%; kdeact=3,100 and 860 s−1, in the example traces of receptors without and with Stargazin, respectively) but had less effect on the slow recovering mutant A2 E713T/Y768R (kdes=170 and 160 s−1; Iss=1 and 7%; kdeact=270 and 260 s−1, in these example traces without and with Stargazin, respectively). (b) A strong correlation was observed between the increase in the steady-state current induced by Stargazin and the recovery rate of the receptors (weighted R2=0.96, n=6–34). Fast recovering mutants showed at least 20-fold increase in the level of steady-state current when coexpressed with Stargazin; in contrast, mutants with slower recovery displayed only a modest increase in the steady-state current. Error bars represent s.e.m.
Figure 3
Figure 3. A model for Stargazin modulation.
(a) Simplified single binding site model of AMPARs without TARPs. Open state is green, shut states are red. The kinetic behaviour of the mutant series was reproduced by altering the lifetime of the desensitized state AD2 (blue-arrowed rates), which was compensated by the channel shutting rate (α, pink) to maintain microscopic reversibility. (b) Model including TARPs, with boosted channel opening rate (βs) in the TARP-active open state only. Other rate constants were as in a. The rate of TARP activation (s*+, pink) compensated alterations to the channel shutting rate (α) over the mutant series, to maintain microscopic reversibility. (c) The TARP model predicted larger peak open probability and steady-state currents, and slower desensitization (Trial #7, see Methods). (d) Concentration response relations were left-shifted for the TARP model, despite equivalent binding rate constants. (e) The TARP model predicted the more profound slow component in the decay following a 1 ms pulse of glutamate for fast recovering mutants (compare with Fig. 2a).
Figure 4
Figure 4. Stargazin induces suprarecovery without changing the rate of recovery from desensitization.
(a) Simulated relaxations following equilibrium desensitization in 10 mM glutamate for the model in Fig. 3a. (b) The model from Fig. 3b predicted an overshoot in the recovery for fast recovering mutants. (c) During recovery, GluA2 WT+Stargazin currents recovered to a higher level than the initial pulse (red diamonds; for the patch shown, 107% of the initial value; krec=40 s−1). (d) The overshoot was more profound for the GluA2 R675S mutant (in this example, 120% of the initial peak current; krec=84 s−1. (e) Summary of recovery data for GluA2 WT and R675S. A monoexponential fit gave a faster rate of recovery in the presence of Stargazin, for both GluA2 WT (from 46±4 s−1, n=14 without Stargazin to 90±6 s−1 with Stargazin, n=25) and GluA2 R675S receptors (from 70±8 s−1, n=15–130±20 s−1, n=15). For biexponential fits, recovery rates with Stargazin were indistinguishable from those of receptors in the absence of Stargazin (53±3 and 70±8 s−1 for GluA2 WT and GluA2 R675S, respectively). The rates of dissipation of suprarecovery were: 0.95±0.2 and 2.1±0.7 s−1 for GluA2 WT (n=18) and R675S (n=15), respectively. (f) Increasing the length of the conditioning pulse (from 10 to 1800, ms) leads to an increase in the peak current in the test pulse (maximum of 27%, with ksuper=2.7 s−1, in this example). The interval between pulses was kept constant at 200 ms. (g) Summary of suprarecovery for progressive lengthening of the conditioning pulse for GluA2 WT+Stargazin (red diamonds, n=6–12) and GluA2 WT (empty grey diamonds, n=6–8) at an interval of 200 ms. Error bars represent s.e.m.
Figure 5
Figure 5. Superactivation of AMPA receptors by TARPs.
(a) The TARP model predicted slow augmentation of current during long (>1 s) glutamate pulses. (b) Predicted correlation between recovery rate and fold-increase in steady-state current with TARPs (see Fig. 2b). (c) Long application (5 s) of glutamate to GluA2 WT coexpressed with Stargazin induced a slowly increasing current (11%, k=1.8 s−1, left), which was larger for faster-recovering mutants (GluA2 R675S, 22%, k=1.5 s−1, right) (d) Correlation between superactivation and recovery rate (Pearson r=0.91, 95% confidence interval 0.38–0.99, n=6–34). Error bars represent s.e.m.
Figure 6
Figure 6. Blocking desensitization enhances TARP-induced superactivation.
(a) Removing desensitization from the model (blue traces and scheme, see Methods) predicted that long glutamate applications should exhibit greatly enhanced superactivation, compared with the model with desensitization intact (red). (b) Representative traces from GluA2 WT with Stargazin evoked by 5 s application of glutamate in the absence (ksuper=1.7 s−1, left) and presence (ksuper=2.5 s−1, right) of CTZ. Abolishing desensitization greatly enhanced superactivation (from 4 to 85% for this trace). (c) When desensitization was intact, increases in the steady-state current for GluA4-Stargazin complexes in response to long application of 10 mM glutamate were barely detectable. Pre-exposure of the patch to cyclothiazide (CTZ, 100 μM) unmasked superactivation (from 0.2%, left panel, to 97%, right panel). Traces pre- and post-incubation with CTZ are overlaid in the inset. (d) Superactivation by γ-8 was also enhanced by CTZ (from 150 to 450% in this example, ksuper=1.7 and 1.8 s−1, in the absence and presence of CTZ, respectively). (e) Bar graph summarising superactivation in the presence and absence of CTZ for GluA2+Stargazin (n=24 and 4), GluA4+Stargazin (n=3) and GluA2+γ-8 (n=8 and 11). Error bars represent s.e.m.
Figure 7
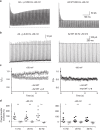
Figure 7. Train stimulation induces superactivation.
(a) 200 Hz trains of 1 ms pulses of 10 mM glutamate, to mimic intense synaptic activity, induced superactivation of currents from GluA2-Stargazin complexes (in this example, 23%). (b) GluA2 WT receptors coexpressed with γ-8 showed superactivation in response to lower frequency stimulation (20 Hz; steady-state potentiation in this example was 31%). (c) Summary of peak current, normalized to the first peak in the train, during 20 Hz train stimulation for A2+γ-8 and A2 alone at +50 (left panel; n=8 and 4, respectively) and −60 mV (right panel; n=7 and 4, respectively). (d) Summary of charge transfer increase during train stimulation for A2+γ-8 and A2 alone at +50 (left panel; n=8–10 and 6–7, respectively) and −60 mV (right panel; n=8–10 and 6–7, respectively) recorded at different frequencies. The charge transfer increase was calculated as the ratio between the change in the charge transfer during the last five pulse of the train and the change during the first five pulses (see Methods). A nonparametric randomization test was used; *P<0.05, **P<0.01.

References

    1. Tomita S. et al.. Functional studies and distribution define a family of transmembrane AMPA receptor regulatory proteins. J. Cell Biol. 161, 805–816 (2003) . - PMC - PubMed
    1. Chen L. et al.. Stargazin regulates synaptic targeting of AMPA receptors by two distinct mechanisms. Nature 408, 936–943 (2000) . - PubMed
    1. Hashimoto K. et al.. Impairment of AMPA receptor function in cerebellar granule cells of ataxic mutant mouse stargazer. J. Neurosci. 19, 6027–6036 (1999) . - PMC - PubMed
    1. Studniarczyk D., Coombs I., Cull-Candy S. G. & Farrant M. TARP γ-7 selectively enhances synaptic expression of calcium-permeable AMPARs. Nat. Neurosci. 16, 1266–1274 (2013) . - PMC - PubMed
    1. Bats C., Groc L. & Choquet D. The interaction between Stargazin and PSD-95 regulates AMPA receptor surface trafficking. Neuron 53, 719–734 (2007) . - PubMed

Publication types