

Gene Duplicability of Core Genes Is Highly Consistent across All Angiosperms
- PMID: 26744215
- PMCID: PMC4790876
- DOI: 10.1105/tpc.15.00877
Gene Duplicability of Core Genes Is Highly Consistent across All Angiosperms
Abstract
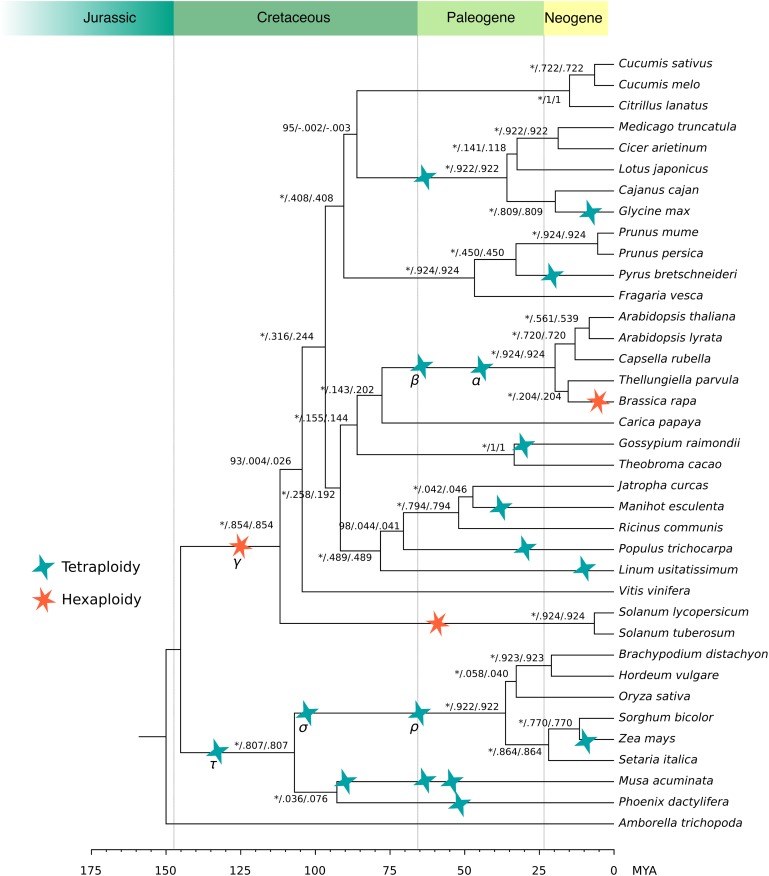
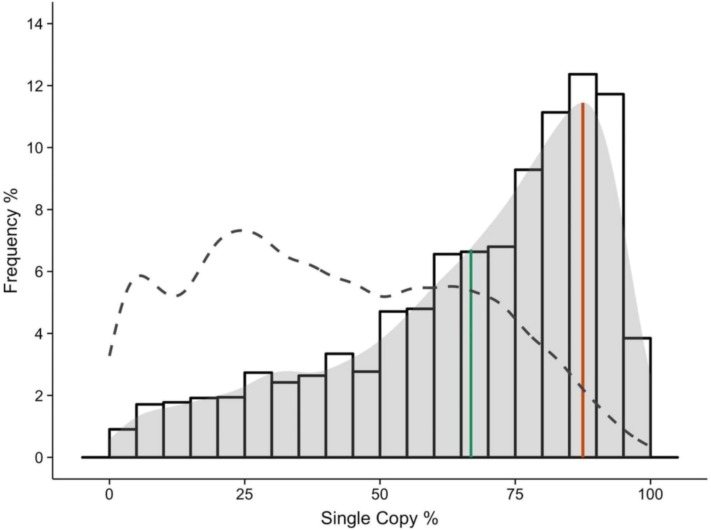
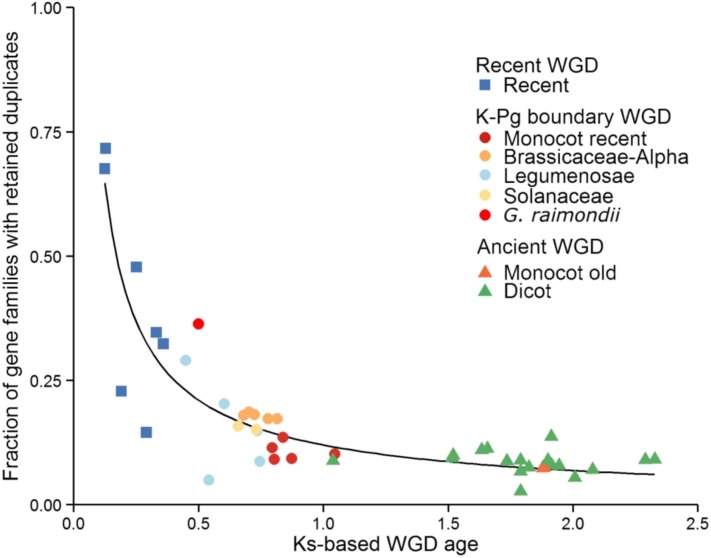
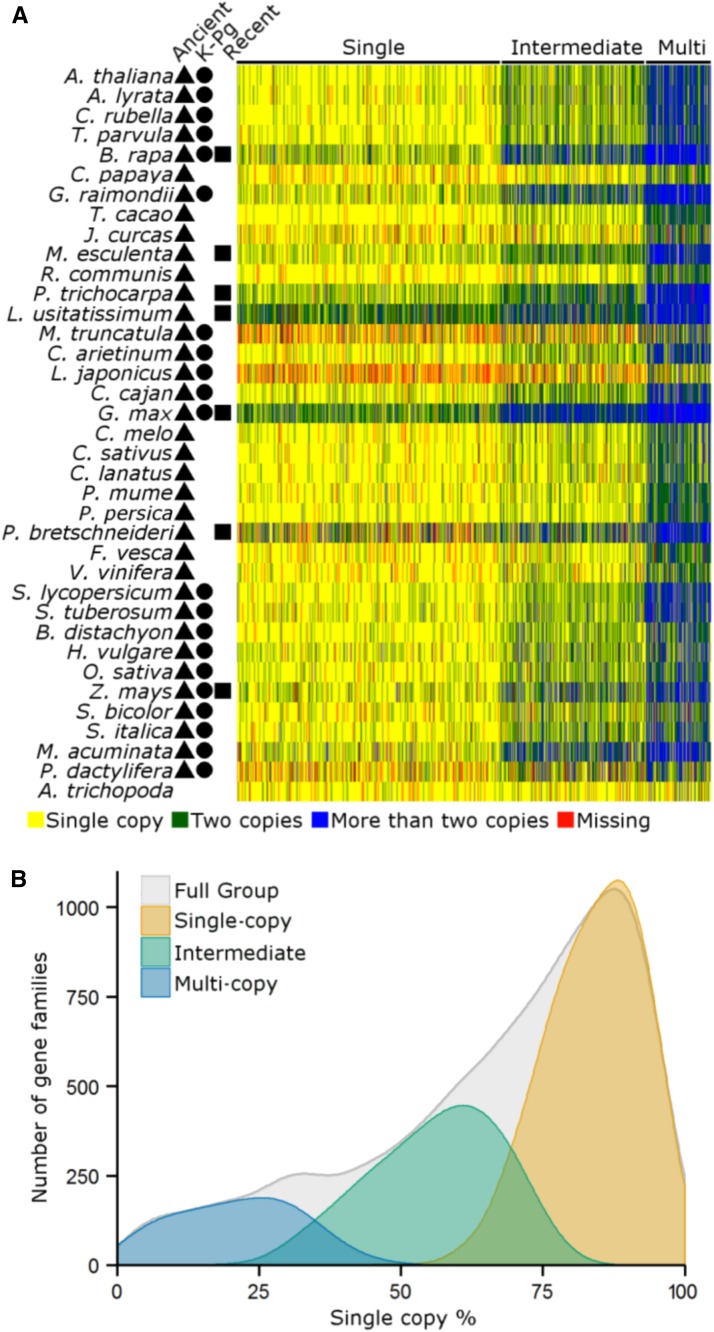
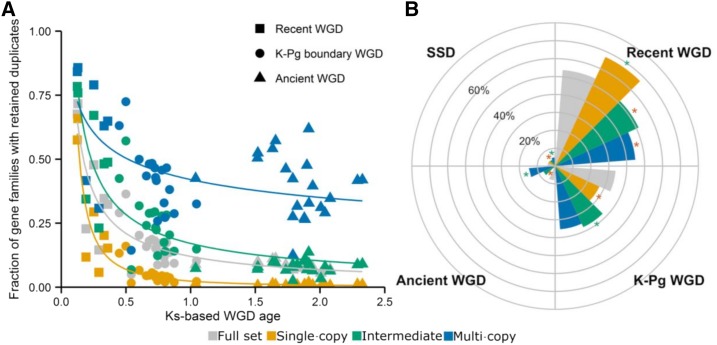
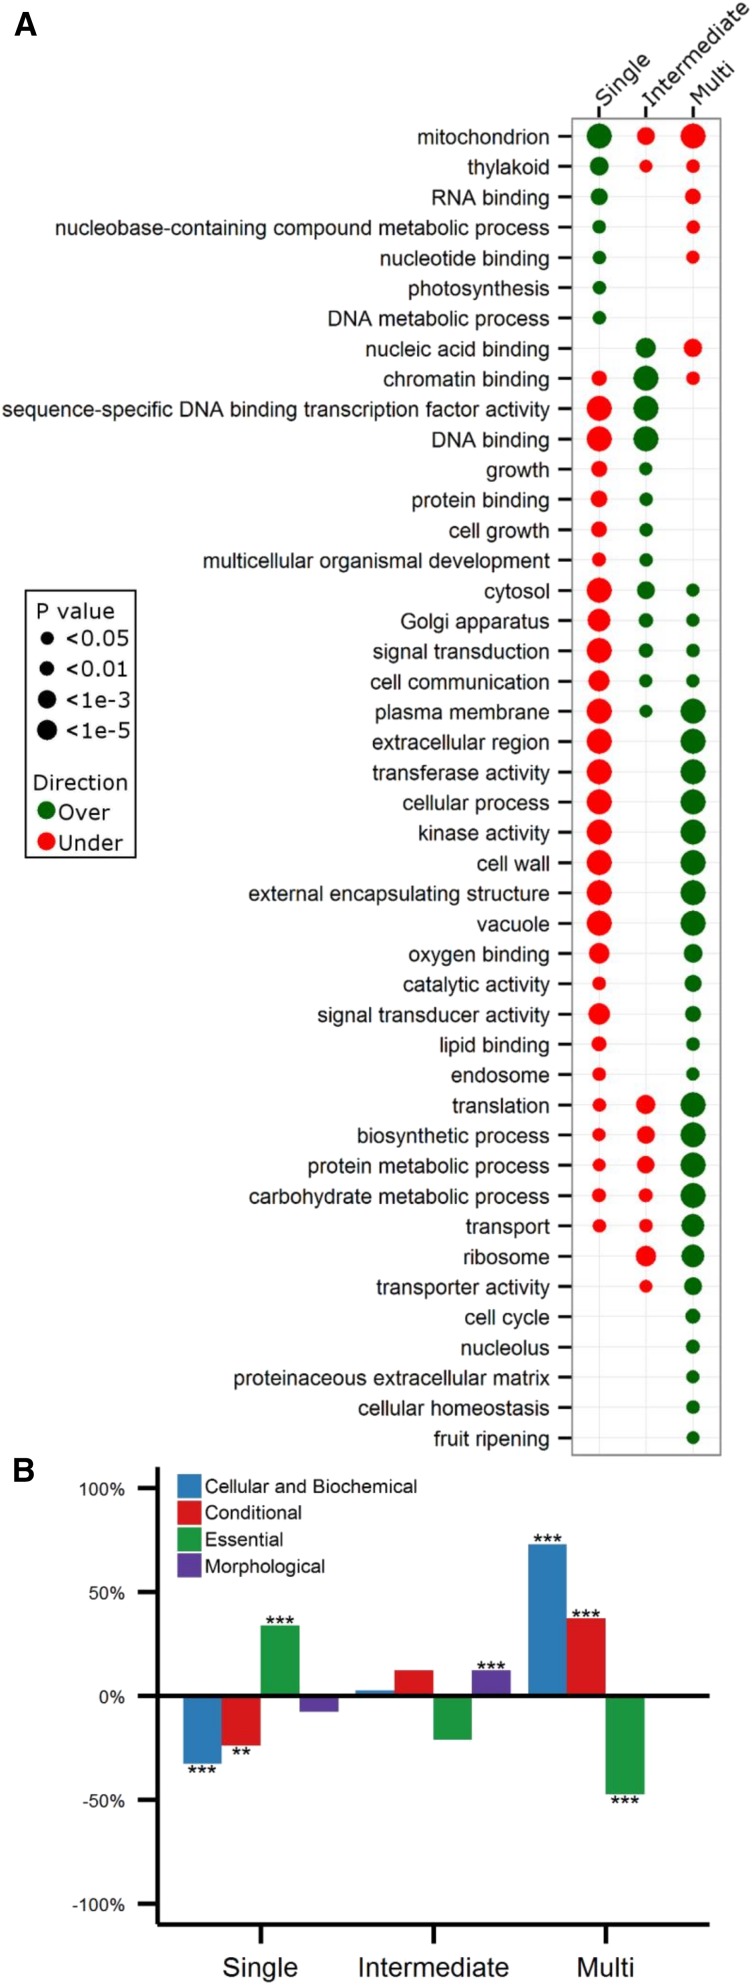
Gene duplication is an important mechanism for adding to genomic novelty. Hence, which genes undergo duplication and are preserved following duplication is an important question. It has been observed that gene duplicability, or the ability of genes to be retained following duplication, is a nonrandom process, with certain genes being more amenable to survive duplication events than others. Primarily, gene essentiality and the type of duplication (small-scale versus large-scale) have been shown in different species to influence the (long-term) survival of novel genes. However, an overarching view of "gene duplicability" is lacking, mainly due to the fact that previous studies usually focused on individual species and did not account for the influence of genomic context and the time of duplication. Here, we present a large-scale study in which we investigated duplicate retention for 9178 gene families shared between 37 flowering plant species, referred to as angiosperm core gene families. For most gene families, we observe a strikingly consistent pattern of gene duplicability across species, with gene families being either primarily single-copy or multicopy in all species. An intermediate class contains gene families that are often retained in duplicate for periods extending to tens of millions of years after whole-genome duplication, but ultimately appear to be largely restored to singleton status, suggesting that these genes may be dosage balance sensitive. The distinction between single-copy and multicopy gene families is reflected in their functional annotation, with single-copy genes being mainly involved in the maintenance of genome stability and organelle function and multicopy genes in signaling, transport, and metabolism. The intermediate class was overrepresented in regulatory genes, further suggesting that these represent putative dosage-balance-sensitive genes.
© 2016 American Society of Plant Biologists. All rights reserved.
Figures
Similar articles
-
Expectations of duplicate gene retention under the gene duplicability hypothesis.BMC Ecol Evol. 2023 Dec 14;23(1):76. doi: 10.1186/s12862-023-02174-2. BMC Ecol Evol. 2023. PMID: 38097959 Free PMC article.
-
Reciprocally Retained Genes in the Angiosperm Lineage Show the Hallmarks of Dosage Balance Sensitivity.Plant Cell. 2017 Nov;29(11):2766-2785. doi: 10.1105/tpc.17.00313. Epub 2017 Oct 23. Plant Cell. 2017. PMID: 29061868 Free PMC article.
-
Ohnologs and SSD Paralogs Differ in Genomic and Expression Features Related to Dosage Constraints.Genome Biol Evol. 2023 Oct 6;15(10):evad174. doi: 10.1093/gbe/evad174. Genome Biol Evol. 2023. PMID: 37776514 Free PMC article.
-
Genome and gene duplications and gene expression divergence: a view from plants.Ann N Y Acad Sci. 2012 May;1256:1-14. doi: 10.1111/j.1749-6632.2011.06384.x. Epub 2012 Jan 18. Ann N Y Acad Sci. 2012. PMID: 22257007 Review.
-
The flowering world: a tale of duplications.Trends Plant Sci. 2009 Dec;14(12):680-8. doi: 10.1016/j.tplants.2009.09.001. Epub 2009 Oct 7. Trends Plant Sci. 2009. PMID: 19818673 Review.
Cited by
-
Diversity and evolution of cytochromes P450 in stramenopiles.Planta. 2019 Mar;249(3):647-661. doi: 10.1007/s00425-018-3028-1. Epub 2018 Oct 19. Planta. 2019. PMID: 30341489
-
Gene Duplication Accelerates the Pace of Protein Gain and Loss from Plant Organelles.Mol Biol Evol. 2020 Apr 1;37(4):969-981. doi: 10.1093/molbev/msz275. Mol Biol Evol. 2020. PMID: 31750917 Free PMC article.
-
Greater genetic and regulatory plasticity of retained duplicates in Epichloë endophytic fungi.Mol Ecol. 2019 Dec;28(23):5103-5114. doi: 10.1111/mec.15275. Epub 2019 Nov 6. Mol Ecol. 2019. PMID: 31614039 Free PMC article.
-
Diversifying Evolution of the Ubiquitin-26S Proteasome System in Brassicaceae and Poaceae.Int J Mol Sci. 2019 Jun 30;20(13):3226. doi: 10.3390/ijms20133226. Int J Mol Sci. 2019. PMID: 31262075 Free PMC article.
-
Characterization of Transposon-Derived Accessible Chromatin Regions in Rice (Oryza Sativa).Int J Mol Sci. 2022 Aug 11;23(16):8947. doi: 10.3390/ijms23168947. Int J Mol Sci. 2022. PMID: 36012213 Free PMC article.
References
-
- Amborella Genome Project (2013). The Amborella genome and the evolution of flowering plants. Science 342: 1241089. - PubMed
-
- Anisimova M., Gascuel O. (2006). Approximate likelihood-ratio test for branches: A fast, accurate, and powerful alternative. Syst. Biol. 55: 539–552. - PubMed
-
- Antoni R., Gonzalez-Guzman M., Rodriguez L., Peirats-Llobet M., Pizzio G.A., Fernandez M.A., De Winne N., De Jaeger G., Dietrich D., Bennett M.J., Rodriguez P.L. (2013). PYRABACTIN RESISTANCE1-LIKE8 plays an important role for the regulation of abscisic acid signaling in root. Plant Physiol. 161: 931–941. - PMC - PubMed
Publication types
MeSH terms
LinkOut - more resources
Full Text Sources
Other Literature Sources
