. 2016 Jan 8;351(6269):169-72.
doi: 10.1126/science.aaa8714.

Accurate concentration control of mitochondria and nucleoids

Affiliations

Accurate concentration control of mitochondria and nucleoids

Rishi Jajoo et al. Science. .

Abstract

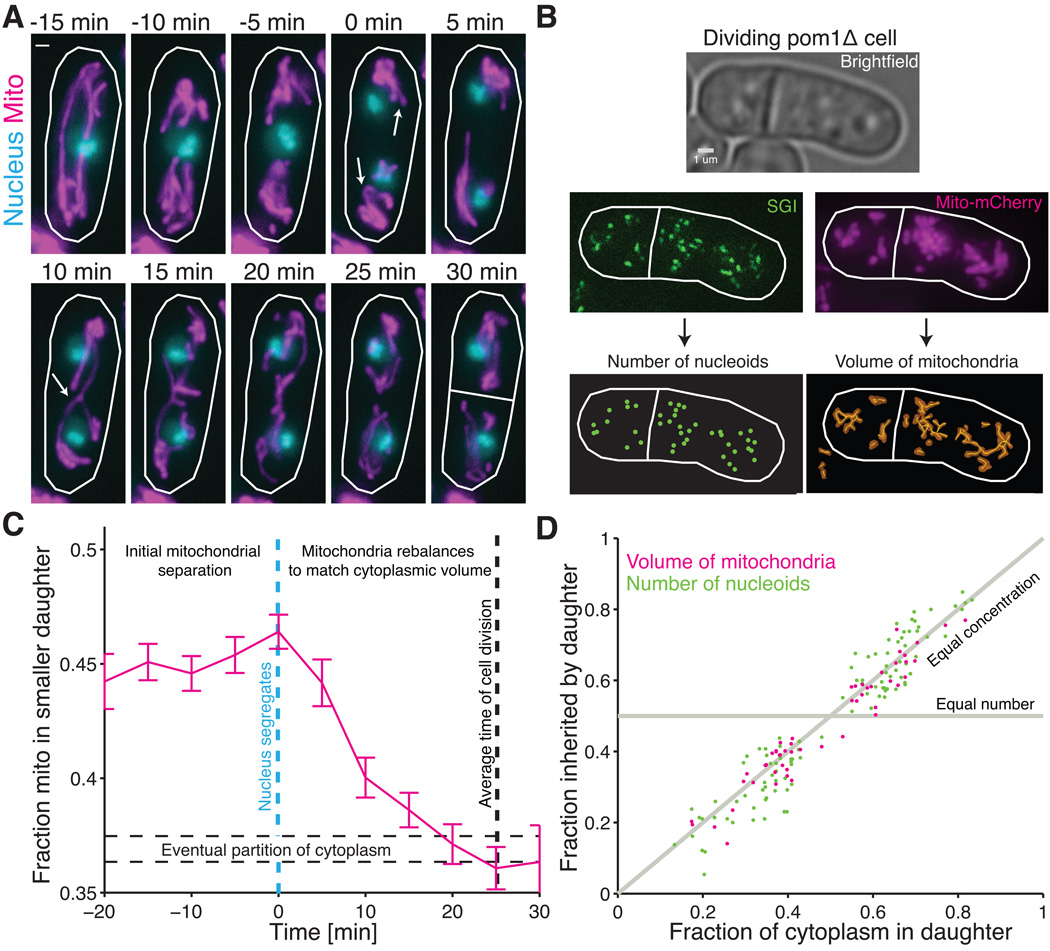
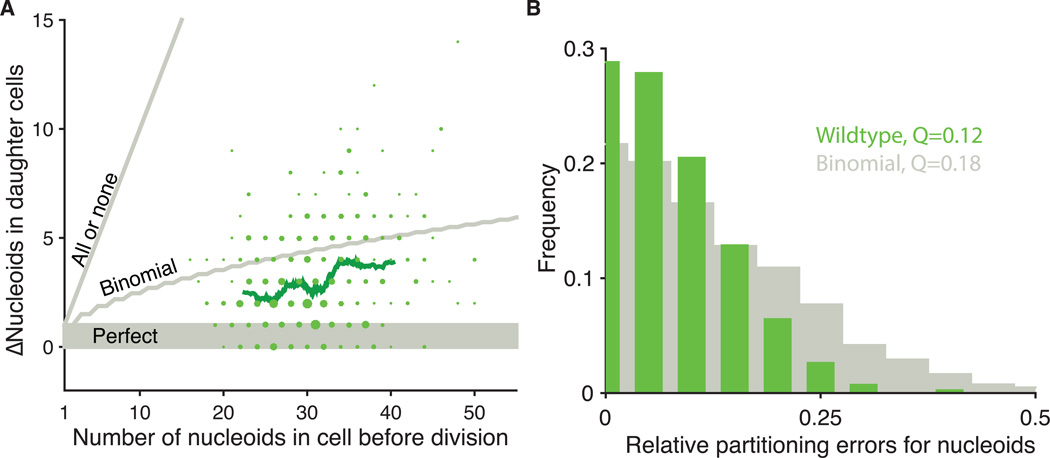
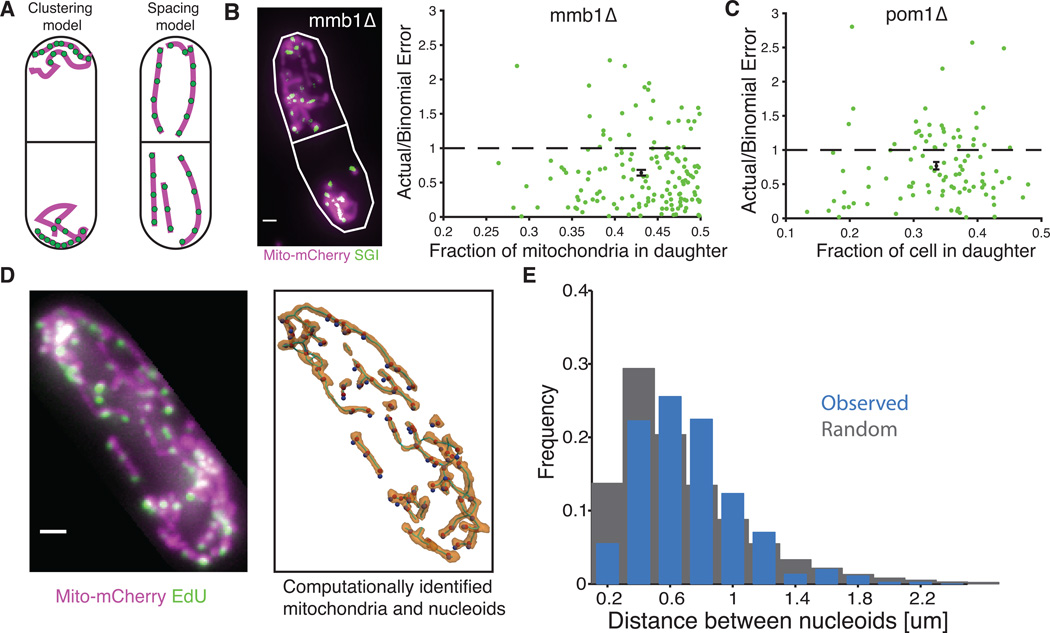
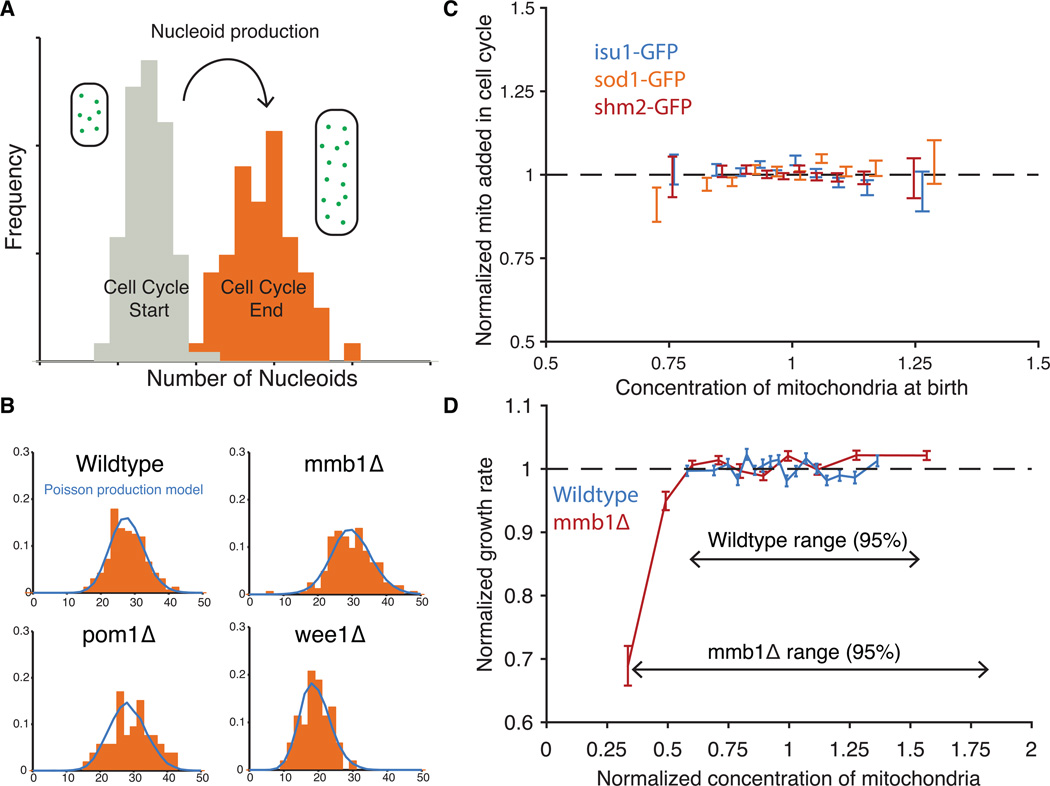
All cellular materials are partitioned between daughters at cell division, but by various mechanisms and with different accuracy. In the yeast Schizosaccharomyces pombe, the mitochondria are pushed to the cell poles by the spindle. We found that mitochondria spatially reequilibrate just before division, and that the mitochondrial volume and DNA-containing nucleoids instead segregate in proportion to the cytoplasm inherited by each daughter. However, nucleoid partitioning errors are suppressed by control at two levels: Mitochondrial volume is actively distributed throughout a cell, and nucleoids are spaced out in semiregular arrays within mitochondria. During the cell cycle, both mitochondria and nucleoids appear to be produced without feedback, creating a net control of fluctuations that is just accurate enough to avoid substantial growth defects.


Figures

Figure 1
Figure 1
Spatial re-equilibration of mitochondria and nucleoids after nuclear segregation matches cytoplasmic division. (A) Timelapse images of a dividing wild-type cell (RJP041) with mitochondrial matrix-targeted mCherry (magenta) and green fluorescent protein (GFP) labeled nuclei (cyan). Arrows at 0 min indicate initial separation of nuclei and further bunching of the mitochondria to the poles and then reformation of a continuous mitochondrial network at 10 min but before division at 30 min. (B) For individual dividing pom1Δ cells (RJP025), the number of nucleoids in each daughter cell was determined with semi-automated spot detection of SGI signal, and the mitochondrial volume in each cell half was determined using the surface-based volume reconstruction from the MitoGraph software package (10). (C) Fraction of mitochondria in the part of the cell region that will eventually become the smaller daughter as a function of time for pom1Δ cells (RJP042). Images of cells as in (A) were taken every 5 minutes and aligned to when nuclei first separated (blue dashed line). Average cell division occurred 25 minutes after nuclear separation, with approximately 37% of cytoplasmic volume inherited by smaller daughter (dashed horizontal lines). Error bars indicate standard error of the mean (s.e.m.). Dashed horizontal lines represent the average partition of the cytoplasm ±1 s.e.m. (n=91 cells) (D) The fraction of nucleoids and of mitochondrial volume in each pom1Δ daughter cell as computed in (B), plotted as a function of the fraction of cytoplasmic volume in each daughter cell. The coefficient of determination between cytoplasmic volume and nucleoids is r2=0.88 (102 cells) and for cytoplasmic volume and mitochondrial volume is r2=0.88 (52 cells). All scale bars indicate 1 um.
Figure 2
Figure 2
Partitioning of mitochondria and nucleoids to daughter cells. (A) The absolute difference between the number of nucleoids segregated between wild-type sister cells plotted against the total number of nucleoids (RJP005 and DH60). The areas of plotted points are proportional to the number of observations. The green line represents a running average of 80 points. Gray lines indicate models of perfect, binomial and all-or-none segregation. 76% of cells segregate better than binomial, including 28% that are perfect. 24% segregate worse than binomial. Binomial predictions assumed that each nucleoid had the same chance of being inherited by either daughter (n=420 cells) More spot overlap in daughters with higher numbers can also reduce the observed error slightly, but appears to contribute marginally since we observe even more strongly sub-binomial errors in cells where each daughter gets as few as 10 copies. (B) The same data as (A) plotted as histogram of relative errors for nucleoid segregation compared to a binomial model. Q is defined as: Q(LR)2/(L+R)2 where L and R are the number of nucleoids that partition to the left and right daughter cells respectively, and the angle brackets represent averages over all cells (22).
Figure 3
Figure 3
Requirement of accurate mitochondrial segregation and regular spacing of nucleoids within mitochondria to produce accurate segregation of nucleoids. (A) Two models of how nucleoids could be segregated accurately to daughter cells: 1) Measured and ordered clustering or 2) regular spacing within mitochondria that are themselves evenly partitioned between cells. (B) Left: image of mmb1Δ with mito-mcherry (magenta) and SGI (green). Right: Nucleoid segregation error normalized to the binomial model plotted against the degree of asymmetric mitochondrial division in mmb1Δ cells. (C) Nucleoid segregation error normalized to the binomial model plotted against the degree of asymmetric division in pom1Δ cells. The green points are individual cells and the black point is their average. Error bars indicate s.e.m. (D) Left: A fixed cell (RJP028) with mito-mCherry (magenta) and EdU-labeled nucleoids (green). Right: The same cell analyzed with Mitograph (10) to identify mitochondria (gold) and nucleoids (blue dots). Nucleoids were then projected onto the nearest part of the mitochondrial network (red dots). (E) A histogram of the actual distances between neighbor nucleoids for 1,871 nucleoids in 24 cells (blue) and randomly redistributed nucleoids within the mitochondrial network (gray). Redistributed nucleoids were restricted to be farther apart than the microscope resolution limit. This again shows that the sub-binomial errors do not reflect higher under-counting in the daughter with more copies.
Figure 4
Figure 4
Nucleoid and mitochondrial production is constant and cell growth depends on mitochondrial concentration. (A) Schematic of data used to infer nucleoid production. In dividing cells, the number of nucleoids was measured for both newborn daughter cells (grey) and just divided mother cells (orange) and then normalized to the average volume of each population. (B) To model nucleoid production without feedback control, a Poisson distribution based on the average number of nucleoids at the beginning of the cell cycle was added to the full distribution of nucleoids at the beginning of the cell cycle. The resulting distribution is plotted in blue against the actual data from the end of the cell cycle (orange) for each strain. On average over all datasets and strains, the standard deviation predicted by the Poisson model differed from the actual data by 15%. (C) Total mitochondria added during the cell cycle divided by the added volume is plotted against the concentration of mitochondria in newborn cells. Both are normalized by their respective averages. The fluorescence signals of mitochondrially-localized GFP fusion proteins were used as a proxy of the amount of mitochondria in the cell. A running average of data is shown with error bars representing the s.e.m. of the observations. (isu1-GFP: n=835 cells, sod1-GFP:n= 1167 cells, shm2-GFP: n= 2720 cells (D) The normalized growth rate of cells is plotted against the normalized concentration of mitochondria for both WT (n=3582 cells) and mmb1Δ (n=2056 cells). Each point is an average of 200 cells and error bars are ±1 s.e.m.

Similar articles

Cited by

References

    1. Liu Z, Butow RA. Mitochondrial Retrograde Signaling. Annu. Rev. Genet. 2006;40:159–185. - PubMed
    1. Hoppins S, Nunnari J. Mitochondrial Dynamics and Apoptosis--the ER Connection. Science. 2012;337:1052–1054. - PubMed
    1. Duchen MR. Mitochondria in health and disease: perspectives on a new mitochondrial biology. Molecular Aspects of Medicine. 2004;25:365–451. - PubMed
    1. Mukherji S, O'Shea EK. Mechanisms of organelle biogenesis govern stochastic fluctuations in organelle abundance. Elife. 2014;3:e02678. - PMC - PubMed
    1. Chan YHM, Marshall WF. How Cells Know the Size of Their Organelles. Science. 2012;337:1186–1189. - PMC - PubMed

Publication types

MeSH terms

Substances

LinkOut - more resources