. 2016 Jan 8;351(6269):aaa5694.
doi: 10.1126/science.aaa5694.

Gating of hippocampal activity, plasticity, and memory by entorhinal cortex long-range inhibition

Affiliations

Gating of hippocampal activity, plasticity, and memory by entorhinal cortex long-range inhibition

Jayeeta Basu et al. Science. .

Erratum in

Abstract

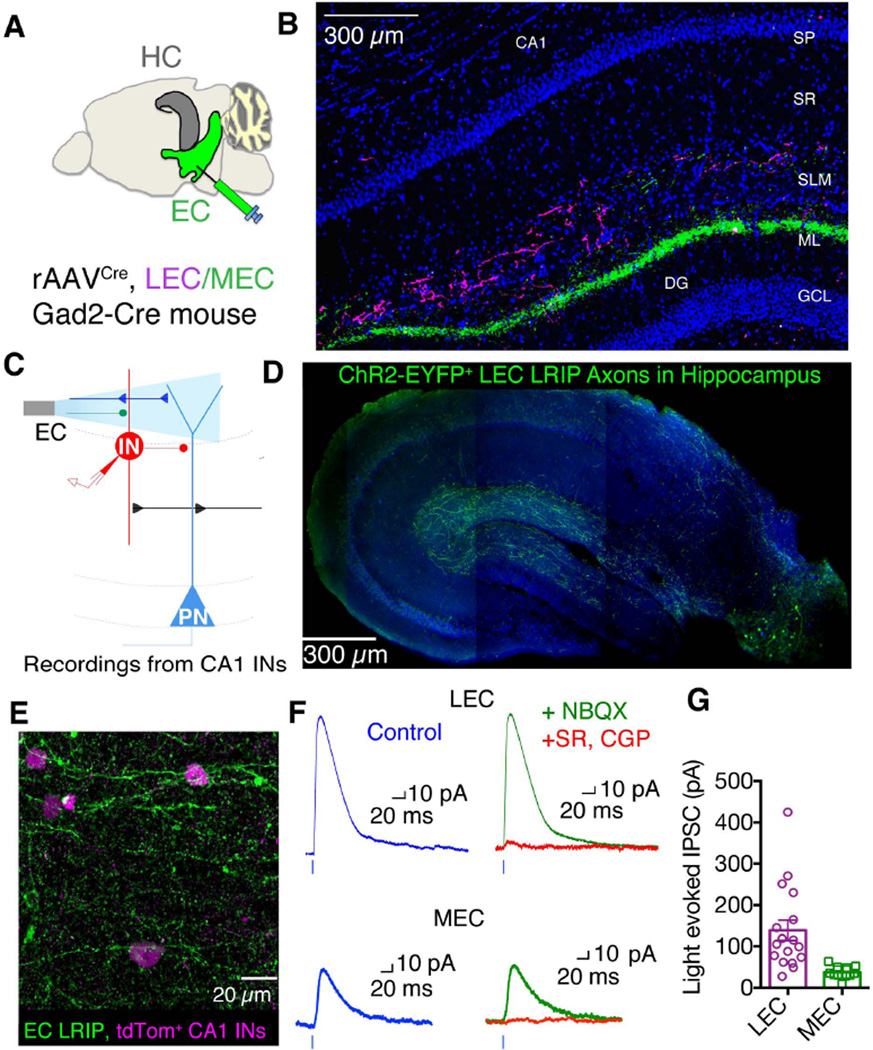
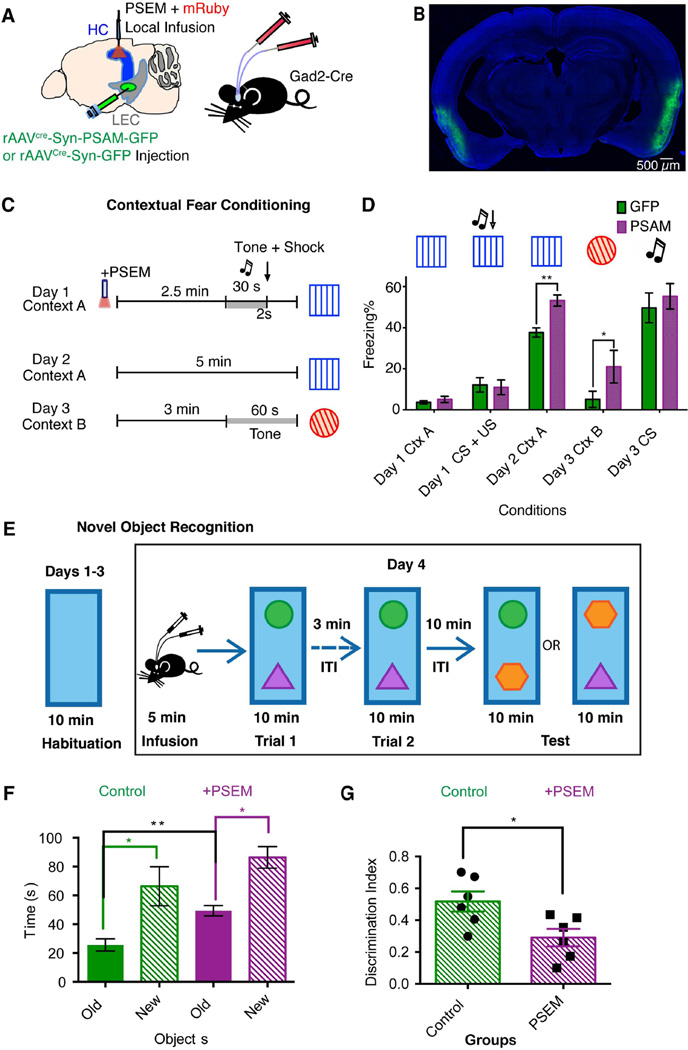
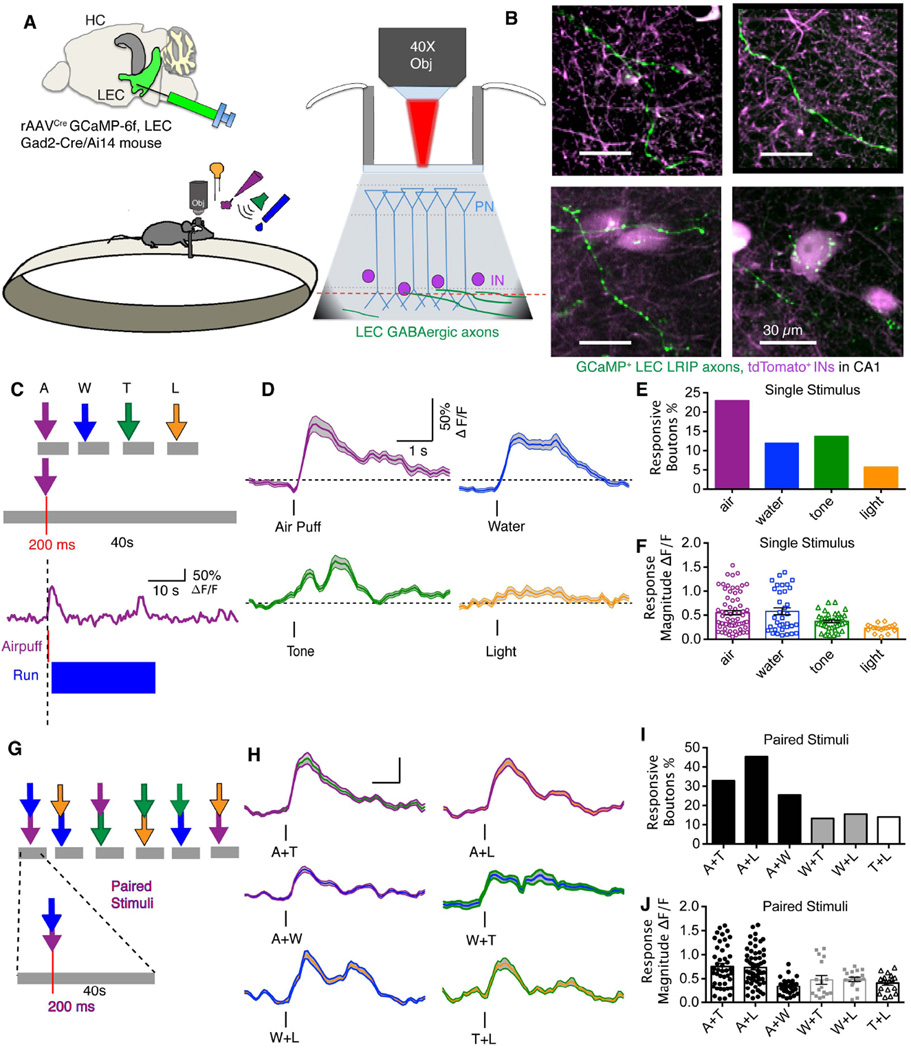
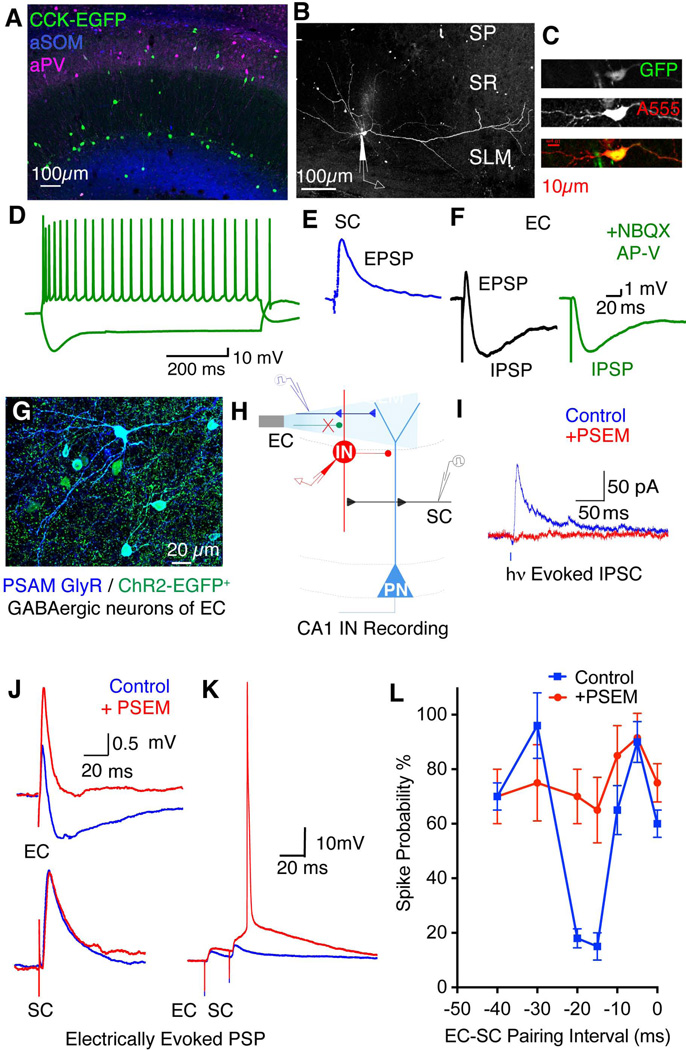
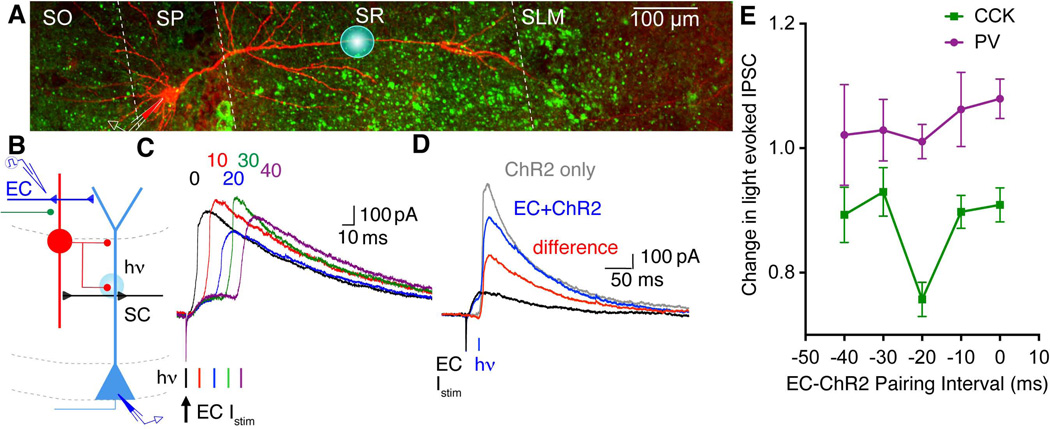
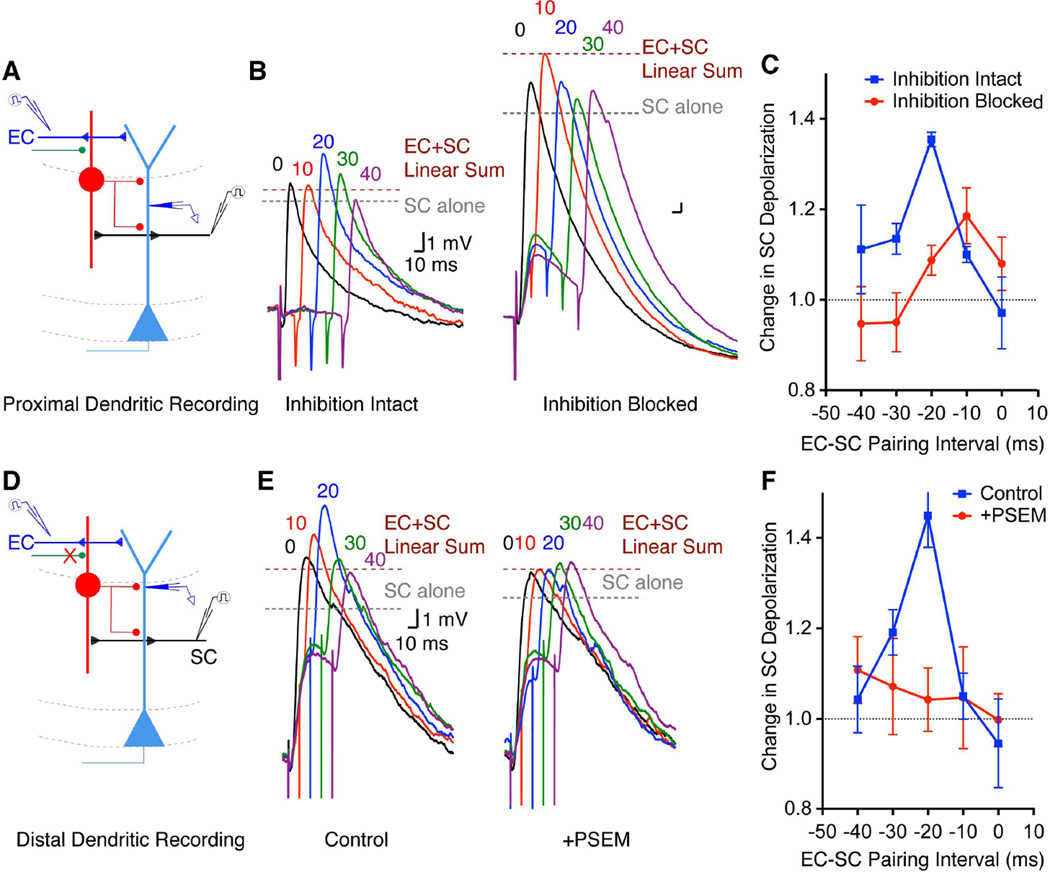
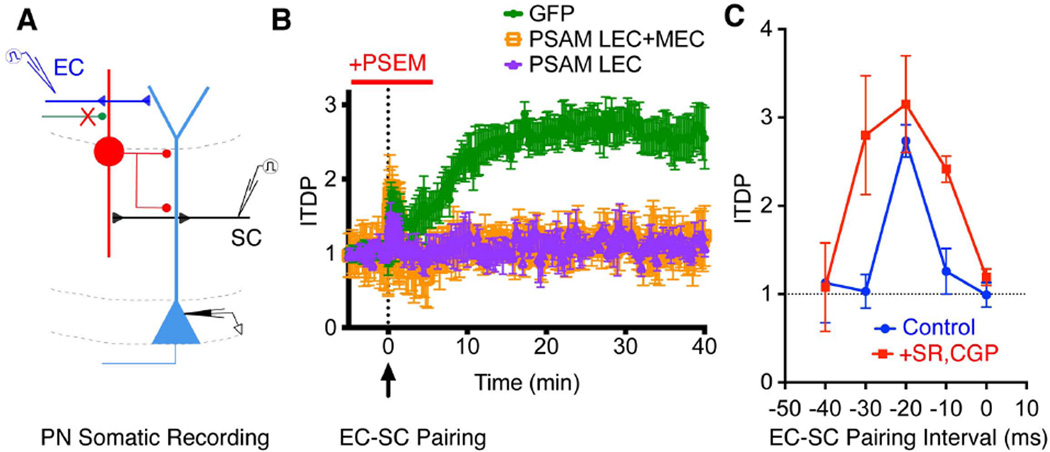
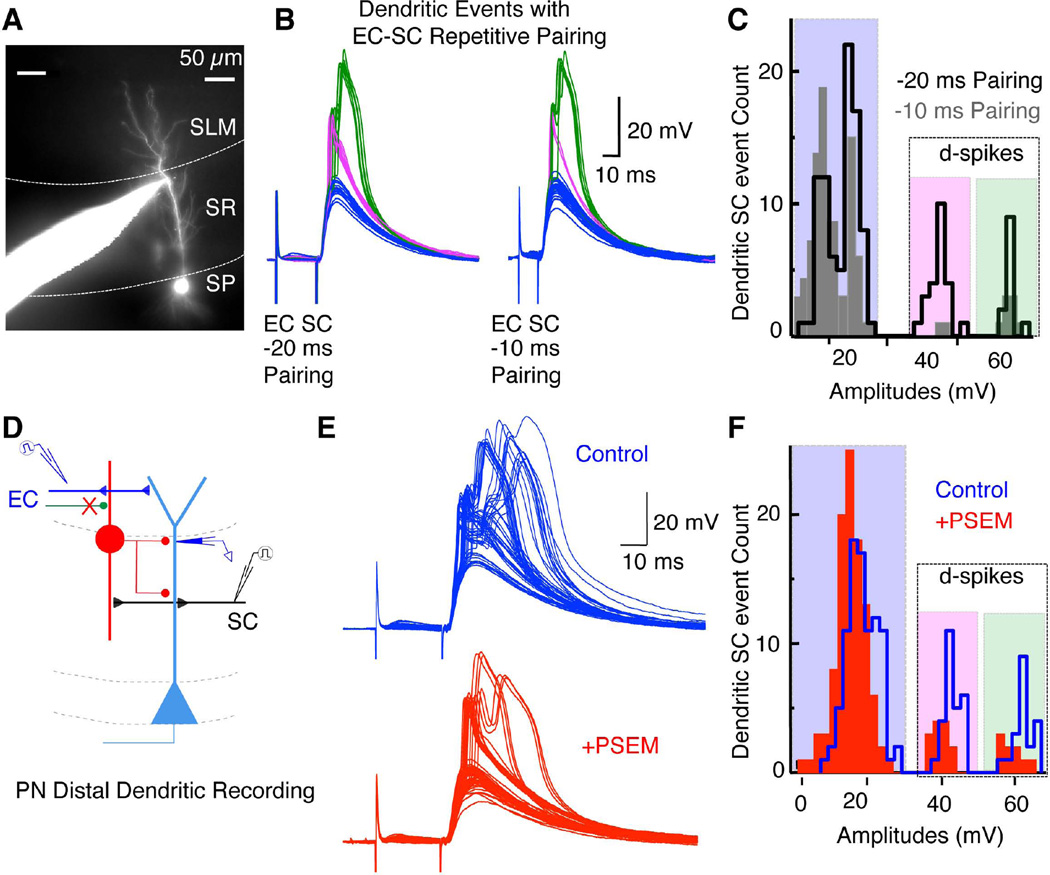
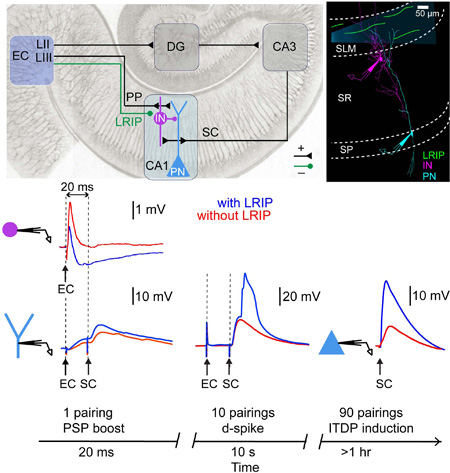
The cortico-hippocampal circuit is critical for storage of associational memories. Most studies have focused on the role in memory storage of the excitatory projections from entorhinal cortex to hippocampus. However, entorhinal cortex also sends inhibitory projections, whose role in memory storage and cortico-hippocampal activity remains largely unexplored. We found that these long-range inhibitory projections enhance the specificity of contextual and object memory encoding. At the circuit level, these γ-aminobutyric acid (GABA)-releasing projections target hippocampal inhibitory neurons and thus act as a disinhibitory gate that transiently promotes the excitation of hippocampal CA1 pyramidal neurons by suppressing feedforward inhibition. This enhances the ability of CA1 pyramidal neurons to fire synaptically evoked dendritic spikes and to generate a temporally precise form of heterosynaptic plasticity. Long-range inhibition from entorhinal cortex may thus increase the precision of hippocampal-based long-term memory associations by assessing the salience of mnemonormation to the immediate sensory input.


Figures

Fig. 1
Fig. 1. Lateral entorhinal cortex provides strong long-range GABAergic inputs to local CA1 inhibitory neurons
A. LEC and MEC viral injection sites (in green) and their hippocampal target (HC, in grey). B. TdTomato-labelled (magenta) and GFP-labeled (green) axons in SLM of CA1 from LEC and MEC Gad2-Cre+ LRIPs, respectively. DAPI stain in blue. C. Scheme of experiment to functionally map impact of LRIPs from LEC or MEC on CA1 INs at SR/SLM border. ChR2-EYFP was virally expressed in GABAergic neurons in the LEC or MEC using rAAVCre injections in Gad2-Cre mice. Patch clamp recordings obtained from a CA1 IN (red) at the border of SR/SLM that targets the CA1 PN dendrite (light blue). 470 nm laser light focused on SLM photostimulated ChR2+ LRIPs (green). D. 20× confocal image of ChR2-EYFP+ LRIP axons from LEC (green) in hippocampus from Gad2-Cre mouse. DAPI staining in blue. E. 63× confocal images showing ChR2-EYFP+ LRIP axons from LEC (green) in CA1 SLM region impinging upon tdTomato+ IN soma (magenta). F. Light-evoked inhibitory postsynaptic currents (IPSCs) recorded from CA1 SR/SLM INs in normal extracellular solution (control, blue) and in presence of glutamate receptor blockers (10 µM NBQX and 100 µM D-APV, green trace) or GABA receptor antagonists (2 µM SR95531 and 1 µM CGP55845, red trace), see fig. S1 for statistics. G. Bar (Mean ± SEM) and scatter (individual cells) plot of the light-evoked IPSCs (pA, Vm = +10 mV) from responsive CA1 SR/SLM INs with ChR2 expressed in LEC (magenta, 139 ± 24.8 pA, n = 17) or MEC (green, 37.7 ± 4.5 pA, n = 11; P < 0.005, t-test, LEC LRIP versus MEC LRIP).
Fig. 2
Fig. 2. Silencing LEC LRIPs in CA1 alters both context and object recognition memory
A. Diagram of the experimental design. Gad2-Cre mice were injected with AAVCre to express GFP or PSAM in LEC. PSEM was delivered bilaterally to the CA1 region just prior to the training phase of memory tasks. B. Confocal image (5×) of coronal section from a Gad2-Cre mouse injected in LEC with an AAVCre expressing PSAM-2A-GFP, showing expression of GFP (green) in LEC (DAPI in blue). C. Scheme of contextual fear conditioning (see Methods). On day 1, mice were exposed to Context A, then given a tone followed by footshock. On day 2, mice were re-exposed to Context A. On day 3, mice were exposed to novel Context B, followed by a tone. PSEM was delivered just prior to training in mice expressing GFP (control) or PSAM in LRIPs. C. Bar plot (mean ± SEM) of time spent freezing (GFP, green; PSAM, purple): Day 1, in Context A before (Ctx A) and after (CS+US) footshock; Day 2, during recall testing in Context A; Day 3, in novel Context B before (Ctx B) and after cued tone (Day 3 CS.). Two-way repeated-measures ANOVA revealed no significant difference between groups in freezing on day 1 in Context A (treatment × time F (6, 105) = 0.8055, P = 0.5679; treatment F (1, 105) = 3.655, P = 0.0586; time F (6, 105) = 8.583, P < 0.0001). There was a significant difference in freezing between groups in Context A on day 2 (treatment × time F (4, 48) = 0.8918, P = 0.4761; treatment F (12, 48) = 5.069, P < 0.0001; time F (4, 48) = 11.75, P < 0.0001) and in Context B (no tone) on day 3 (treatment × time F (3, 45) = 1.230, P = 0.3069; treatment F (15, 45) = 2.246, P < 0.0186; time F (3, 45) = 53.01, P < 0.0001). The PSAM group showed significantly greater freezing on Day 3 in context B versus context A on Day 1 prior to footshock (treatment F (12, 24) = 5.332; time F (2, 24)=19.76; P < 0.0002). The GFP control group showed no significant difference in freezing in context A on Day 1 versus context B on Day 3 (treatment F (18, 18) = 0.4932; time F(2, 18) = 12.84; P = 0.928 n.s.). E. Schematic of experiment to test effect of silencing LEC LRIPs on novel object recognition (NOR). Mice were exposed to two objects in training trials 1 and 2, followed by a test trial in which one (now familiar or “old”) object was replaced by a novel (“new”) object. Prior to training, mice were infused with 0.5 µl of either 15 µM PSEM308 plus the dye miniRuby (silenced group, + PSEM) or miniRuby alone (control). Both groups expressed PSAM in LEC. F. Bar plots of time spent with familiar (old) versus novel (new) object in test trial. The PSEM treated group explored the old object for 49.38 ± 3.55 s (P < 0.005 versus control) and the new object for 86.38 ± 7.49 s (n = 6; P < 0.05, new versus old object, paired t-test). G. The discrimination index, calculated as (time spent exploring the new object – time spent exploring old object)/(total exploration time), was significantly greater in control versus PSEM-treated mice (P < 0.05, paired t-test).
Fig. 3
Fig. 3. Functional imaging of sensory coding in LEC LRIPs in SLM of CA1
A. Diagram of in vivo imaging experiment. GCaMP6f was expressed in dorsal LEC, by injecting cre-dependent rAAV in Gad2-Cre/Ai 14 mice that also expressed tdTomato in all GABAergic neurons. A 40× water immersion objective was used for two-photon imaging through a cranial window over CA1 in head-fixed awake mice during multimodal sensory and behavioral stimuli presentation. B. Four examples of time averaged images of GCaMP6f fluorescence in LEC LRIP axons in SLM (green) with tdTomato labeling CA1 interneurons (magenta). C. Experimental design of single stimulus protocol. Imaging was performed in blocks of 4 trials, each 40 s in duration. After a 10 ± 3 s baseline one of four types of stimuli—aversive airpuff (A), water drop (W), tone (T) and light (L)—were presented in random order for 200 ms, except the water drop was limited to 50 ms to prevent satiation. Each block was repeated to obtain at least 5 trials per stimulus. The animal's behavioral response (running and licking) was monitored. ΔF/F traces showing increased Ca2+ signal in a single bouton on an LRIP axon in response to airpuff. D. Mean (± SEM) ΔF/F Ca2+ signal (PSTH) from responsive regions-of-interest (ROI) to indicated stimuli. E. Percentage of responsive boutons to the stimuli (air = 22.92%, water = 11.96%, tone = 13.64% and light = 5.65%). F. Scatter and mean (± SEM) plots of ΔF/F signals from individual responsive boutons (air = 0.55 ± 0.05, n = 68; water = 0.58 ± 0.07, n = 35; tone = 0.37 ± 0.03, n = 37; light = 0.23 ± 0.02, n = 18) G. Experimental protocol: Imaging was performed as described above, but in response to pairs of stimuli, presented in blocks of 10 trials, each 40 s long. Stimuli were randomized and paired stimuli were interleaved with single stimulus presentations. H. Mean (± SEM) ΔF/F Ca2+ signal (PSTH) from responsive ROIs to paired stimuli. I. Percentage of responsive boutons for paired stimuli (A+T = 32.8%; A+L = 45.3%; A+W = 25.4%; W+T = 13.3%; W+L = 15.6%; T+L = 14.1%). J. Scatter and mean (± SEM) plots of ΔF/F signals to paired stimuli from individual responsive boutons (A+T = 0.76 ± 0.07, n = 44; A+L = 0.74 ± 0.05, n = 58; A+W = 0.34 ± 0.03, n = 31; W+T = 0.48 ± 0.09, n = 17; W+L = 0.49 ± 0.04; T+L = 0.41 ± 0.045, n = 18).
Fig. 4
Fig. 4. CCK IN excitation and spike firing is suppressed 15–20 ms after LRIP activation
A. Confocal projection image (left) showing CCK+ (GFP, green), PV+ (immunostained, magenta) and SOM+ (immunostained, blue) IN soma in a hippocampal section from a CCK-Cre/DLX-Flpe/RCE dual reporter mouse. Note abundant GFP+ CCK IN soma at the SR/SLM border. B. Z-axis projection image (right) of a GFP+ CCK IN at SR/SLM border filled with neurobiotin-Alexa 555 (white). C. Zoomed in image of IN in B, showing GFP (top) and Alexa 555-neurobiotin (middle) colabeling (bottom, yellow). Scale bar,10 µm. D–F. Whole cell voltage recordings from IN in B, C. D. Spike firing and voltage sag in response to 700 ms, 200 pA depolarizing and hyperpolarizing current steps, respectively. E. Depolarizing PSP evoked by SC stimulation. F. Mixed depolarizing and hyperpolarizing PSP evoked by EC stimulation (black). Bath application of NBQX (10 µM) and D-APV (100 µM) blocked the depolarization but not the hyperpolarization (green trace). G. 63× projection image of PSAM (α–BTX-Alexa 647, blue) and ChR2-EGFP (green) showing co-expression in ~75% of EC INs in brain section from a Gad2-Cre mouse injected in LEC and MEC with rAAVCre. H. Experimental scheme showing whole cell recording from a CA1 SR/SLM IN with photostimulation of LRIPs or electrical activation of EC inputs. I. Voltage-clamped IPSCs from CCK+ IN (verified by posthoc staining) evoked by photostimulation of LRIPs in absence (blue trace) or presence (red trace) of PSEM (3 µM). J. Voltage responses in CA1 IN evoked by electrical stimulation of EC (top) or SC (bottom) inputs in absence (control, blue trace) and presence (red trace) of PSEM. K. Voltage responses of CA1 SR/SLM IN to paired electrical stimulation of EC and SC inputs (20 ms delay) in the absence (blue trace) and presence (red trace) of PSEM. L. Mean probability of SR/SLM IN spike firing (percent of stimuli eliciting a spike±SEM) in response to paired EC-SC stimulation as a function of pairing interval in absence and presence of PSEM (spike probability with −20ms EC-SC pairing: control = 18 ± 4%; PSEM = 70 ±10%; P < 0.005, n = 7).
Fig. 5
Fig. 5. LRIPs suppress SC-evoked FFI from CCK+ SR/SLM INs
A. Confocal projection image of a CA1 PN filled with Alexa 594 (red) in a slice where CCK+ INs expressed ChR2-EGFP (green). Blue circle represents the perimeter of 470 nm light stimulus. B. Experimental scheme depicting somatic recording from a CA1 PN (red); electrical stimulation of EC inputs in SLM was paired at variable delays with photostimulation of CCK+ INs. C. IPSCs evoked by photostimulation of CCK INs (hv) recorded from soma of a voltage-clamped CA1 PN (+10 mv) during paired electrical stimulation of EC inputs (arrow) at 0, 10, 20, 30 and 40 ms delays. D. IPSCs in CA1 PNs evoked by electrical stimulation of EC inputs and photostimulation of CCK+ INs. Grey trace (ChR2 only), CA1 PN IPSC evoked by photostimulation of CCK+ IN. Black trace (EC), CA1 PN IPSC evoked by electrical stimulation of EC input. Blue trace (EC+ChR2), net IPSC evoked by pairing EC electrical stimulation with photostimulation of CCK+ IN (20 ms delay). Red trace (difference), Inferred CCK+ IN IPSC evoked when EC electrical stimulation preceded photostimulation of CCK+ IN by 20 ms. Trace obtained by subtracting EC-evoked IPSC (black trace) from IPSC evoked during paired stimulation (blue trace). E. Effect of pairing interval on EC-dependent suppression of IPSC evoked by photostimulation of CCK+ INs or PV+ INs. Mean (±SEM) amplitude of photostimulation-evoked IPSC during pairing with EC stimulation (measured as in D) normalized by photostimulated IPSC amplitude in absence of EC stimulation, plotted versus pairing interval. ChR2-EGFP expressed in either PV+ INs (magenta, 1.01 ± 0.03 fold change at −20 ms pairing interval, P = 0.3319, paired two-tailed t-test, n = 5) or CCK+ INs (green, 0.76 ± 0.03 fold decrease in IPSC at −20 ms pairing interval, P = 0.0006, paired two-tailed t-test, n = 9).
Fig. 6
Fig. 6. LRIPs enhance CA1 pyramidal neuron dendritic depolarization in response to SC stimulation through disinhibition
A. Experimental scheme for assessing the synaptic response in CA1 PN dendrites to paired EC-SC electrical stimulation. Panel shows approximate locations of EC and SC stimulation electrodes and dendritic recording pipette. B. Dendritic voltage responses to paired EC-SC electrical stimulation at indicated delays (SC after EC), in absence (left) or presence (right) of SR95531 (2 µM) and CGP55845 (1 µM). Grey dashed line, amplitude of PSP evoked by SC stimulation alone. Red dashed line, predicted linear sum of PSPs evoked by EC and SC stimulation alone. C. Summary plot (mean ± SEM) of paired EC-SC peak PSP normalized by PSP evoked by SC stimulation alone recorded in CA1 PN proximal dendrites in absence (blue squares) and presence (red circles) of GABAR blockers (EC-SC −20 ms pairing: with inhibition intact, fold change = 1.35 ± 0.02; with inhibition blocked, fold change = 1.08 ± 0.03; P = 0.001, Two way ANOVA with Sidak multiple comparisons test, n = 5). D. Experimental scheme to determine how silencing LRIPs (denoted by X) affects PSP in CA1 PN distal dendrites during paired EC-SC stimulation. PSAM expressed in LEC GABAergic neurons in GAD2-Cre mouse with AAVCre. E. CA1 PN distal dendrite PSPs evoked by paired stimulation of EC-SC inputs at indicated intervals, first in absence (left) and then in presence (right) of PSEM. F. Mean (± SEM) PSP amplitude recorded in CA1 PN distal dendrites evoked by paired EC-SC stimulation normalized by PSP evoked by SC stimulation alone, in absence (blue squares) and presence (red dots) of PSEM. PSEM significantly reduced the effect of paired EC-SC stimulation at −20 ms delay to increase PSP size (Control, 1.45 ± 0.07 fold increase; PSEM, 1.04 ± 0.07 fold increase; P < 0.001, Two way ANOVA with Sidak multiple comparisons test, n = 8).
Fig. 7
Fig. 7. LEC LRIPs enable induction of ITDP in CA1 PNs
A. Experimental scheme to assess role of LRIPs in ITDP. PSAM or GFP was expressed in GABAergic neurons in LEC alone or in both LEC and MEC. ITDP was induced by pairing EC-SC stimulation at 1 Hz for 90 s with a −20 ms delay. B. Pairing protocol induces a 2.65 ± 0.23 fold increase in the SC-evoked depolarization in the CA1 PN soma (ITDP relative to baseline PSP) when PSEM is applied to slices expressing GFP in LEC GABAergic neurons (green, n = 5, P < 0.0001 two tailed t-test, before versus after ITDP pairing). ITDP is absent when the pairing protocol is applied with PSEM present in slices expressing PSAM in GABAergic neurons in LEC alone (purple triangles, 1.09 ± 0.12 fold potentiation, n =4, P = 0.114, two tailed t-test before versus after ITDP pairing; P < 0.0001, two tailed t-test for ITDP with GFP versus PSAM in LEC). ITDP is also absent in presence of PSEM when PSAM was expressed in both LEC and MEC (orange squares, 1.10 ± 0.31 fold potentiation, n = 4, P = 0.189, two tailed t-test pre vs. post ITDP pairing; P < 0.0001, two tailed t-test for ITDP with GFP versus PSAM in LEC+MEC). Peak PSP value normalized to value 5 mins prior to ITDP induction. Mean fold potentiation obtained by averaging normalized PSP values during the 25–30 min period after ITDP induction. C. ITDP tuning curve showing potentiation (mean ± SEM) as a function of EC-SC pairing interval. Blue circles, with inhibition intact (−10 ms interval, 1.25 ± 0.26 fold change, n = 4; −20 ms interval, 2.74 ± 0.18 fold change, n = 5; −30 ms interval, 1.03 ± 0.19 fold change, n = 4). Red squares, ITDP with GABAR antagonists applied only during induction protocol (−10 ms, 2.41 ± 0.15 fold change, n = 5; −20 ms, 3.15 ± 0.55 fold change, n = 7; −30 ms, 2.8 ± 0.67 fold change, n = 4). Inhibition blocked versus intact, no significant difference, P = 0.105 two way ANOVA.
Fig. 8
Fig. 8. EC-SC pairing at −20 ms interval induces dendritic spikes
A. Image showing CA1 PN filled with Alexa 594 during a distal dendritic recording. B. Dendritic PSPs (blue), brief spikes (magenta) and long spikes (green) evoked by 10––30s repetitive pairing of EC-SC inputs at 1 Hz with −20 or −10 ms pairing intervals. During first 5–10 paired stimuli only subthreshold PSPs were observed. C. Histograms of the peak dendritic voltage response evoked by a train of 30 paired EC-SC stimuli at 1 Hz, using a −20 ms (black open bars) or −10 ms (gray filled bars) pairing interval (P < 0.005, t-test within cell comparisons for −20 ms vs −10 ms; n = 3). Responses were classified based on amplitude and duration as subthreshold PSPs (blue) or dendritic spikes (magenta, brief spikes; green, long spikes. D. Experimental scheme to assess role of LRIPs in dendritic spikes firing. PSAM was virally expressed in LEC of Gad2-Cre mice. E. and F. Distal dendritic responses (E) and event amplitude histograms (F) to paired EC-SC stimulation at 1 Hz using a −20 ms delay interval in absence (blue) and then presence (red) of PSEM (P < 0.0001, t-test within cell comparisons, Control vs. +PSEM; n = 3).
None
Long-range inhibitory projections gate cortico-hippocampal information flow
Top Left, Entorhinal cortex (EC) excites CA1 pyramidal neurons (PN) directly (PP) and indirectly (ECe→DGe→CA3e→CA1). EC also sends direct long-range inhibitory projections (LRIP) to CA1. Top Right, LRIPs (green) and dye-filled CA1 PN and inhibitory interneuron (IN). Bottom, Disinhibitory effect of LRIPs. IN (top) and PN (bottom) recordings with LRIPs active (blue) or silenced (red). EC stimulation evokes mixed excitation/inhibition (EPSP/IPSP) in IN. Schaffer collateral, SC-evoked dendritic depolarization is enhanced when preceded by EC stimulation (20 ms delay) because LRIPs inhibit INs (disinhibition). Ten or more EC-SC paired stimuli (1 pair/s) trigger PN dendritic spikes (d-spikes). 90 s of EC-SC pairing induces input timing-dependent plasticity (ITDP) leading to long-term potentiation in SC-evoked PN excitation. LRIP silencing (red traces) decreases dendritic depolarization and spike firing, and blocks ITDP.

Comment in

References

    1. Brun VH, et al. Impaired spatial representation in CA1 after lesion of direct input from entorhinal cortex. Neuron. 2008;57:290–302. - PubMed
    1. Suh J, Rivest AJ, Nakashiba T, Tominaga T, Tonegawa S. Entorhinal cortex layer III input to the hippocampus is crucial for temporal association memory. Science. 2011;334:1415–1420. - PubMed
    1. Kitamura T, et al. Island cells control temporal association memory. Science. 2014;343:896–901. - PMC - PubMed
    1. Melzer S, et al. Long-range-projecting GABAergic neurons modulate inhibition in hippocampus and entorhinal cortex. Science. 2012;335:1506–1510. - PubMed
    1. Amaral DG, Witter MP. The three-dimensional organization of the hippocampal formation: a review of anatomical data. Neuroscience. 1989;31:571–591. - PubMed

Publication types

MeSH terms

Substances