. 2016 Mar 17;127(11):1468-80.
doi: 10.1182/blood-2015-08-663146. Epub 2016 Jan 7.

Synthesis and dephosphorylation of MARCKS in the late stages of megakaryocyte maturation drive proplatelet formation

Affiliations

Synthesis and dephosphorylation of MARCKS in the late stages of megakaryocyte maturation drive proplatelet formation

Kellie R Machlus et al. Blood. .

Abstract

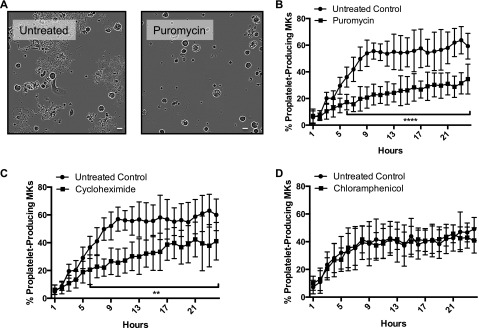
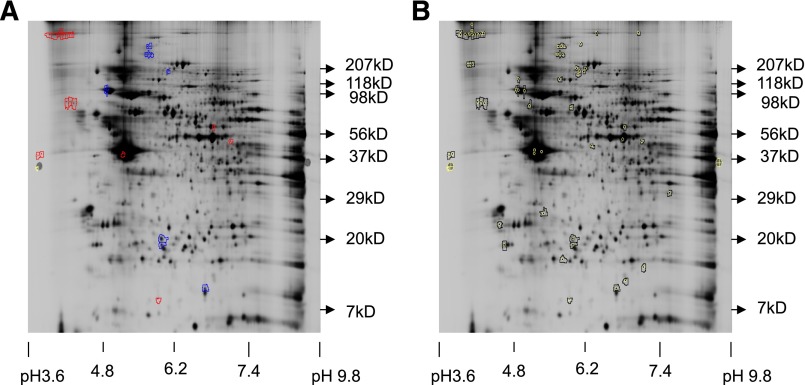
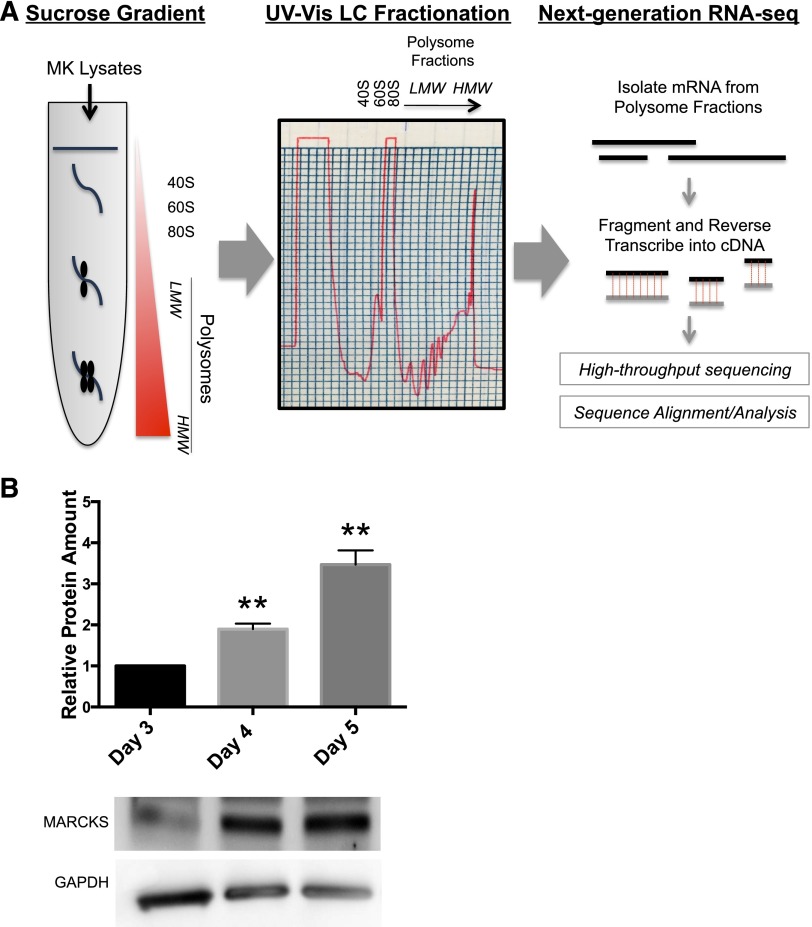
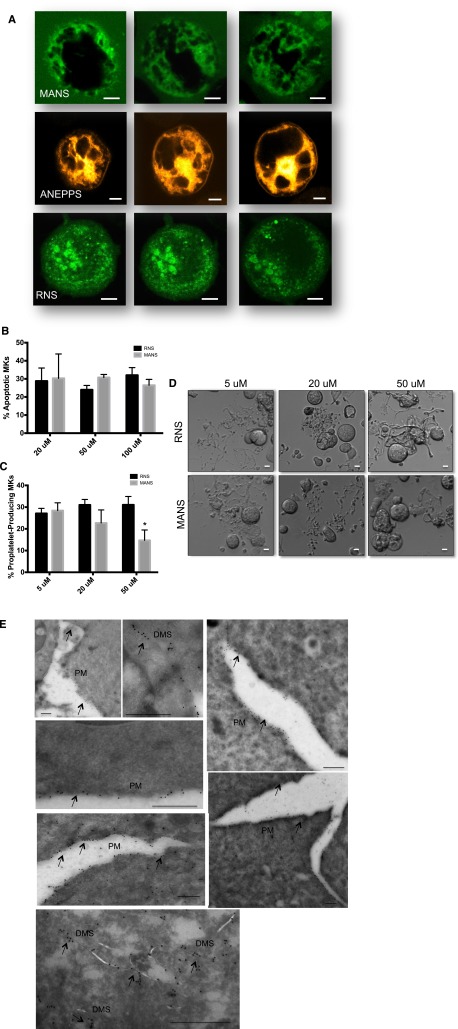
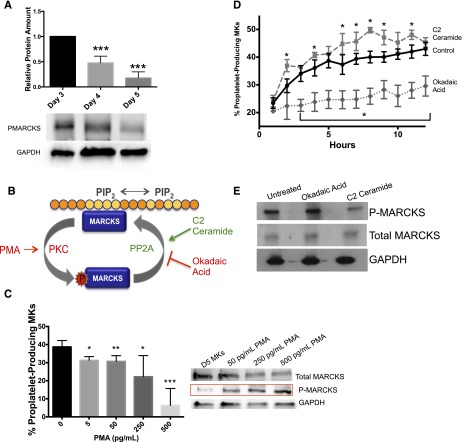
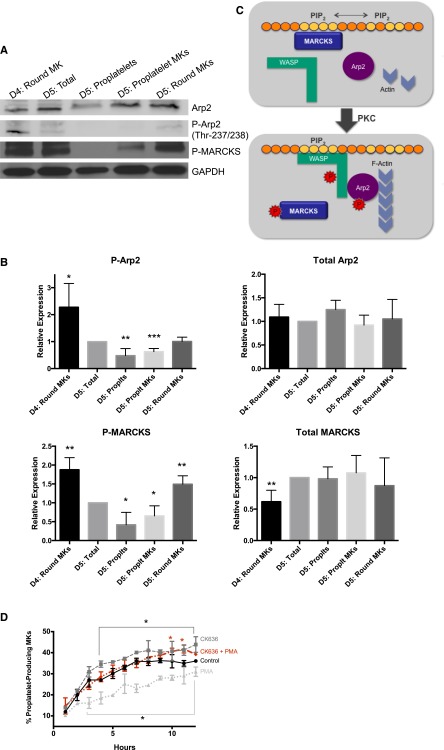
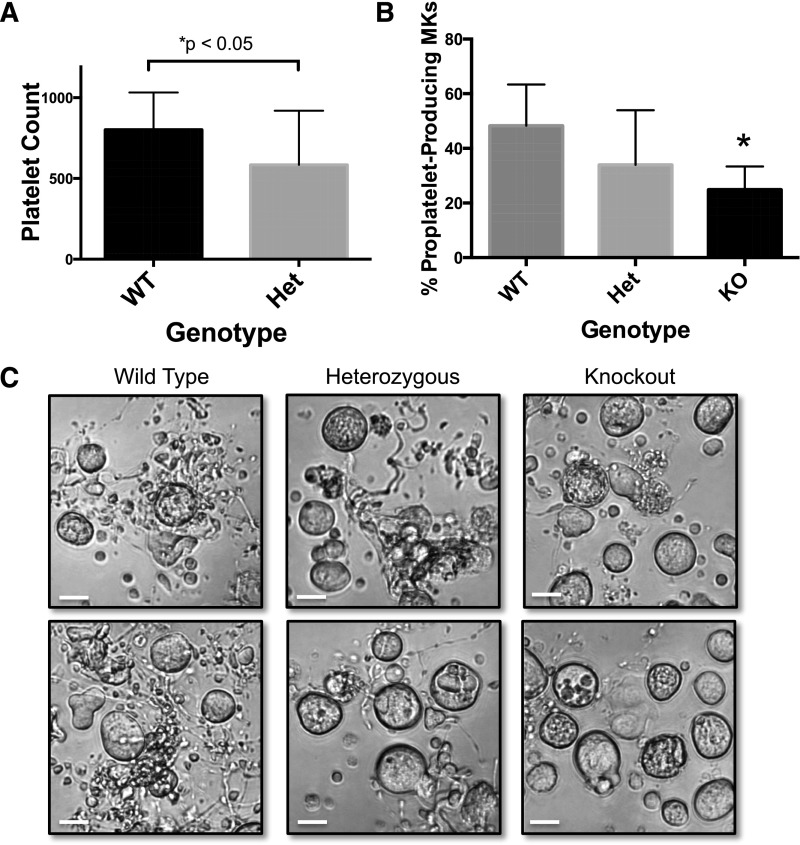
Platelets are essential for hemostasis, and thrombocytopenia is a major clinical problem. Megakaryocytes (MKs) generate platelets by extending long processes, proplatelets, into sinusoidal blood vessels. However, very little is known about what regulates proplatelet formation. To uncover which proteins were dynamically changing during this process, we compared the proteome and transcriptome of round vs proplatelet-producing MKs by 2D difference gel electrophoresis (DIGE) and polysome profiling, respectively. Our data revealed a significant increase in a poorly-characterized MK protein, myristoylated alanine-rich C-kinase substrate (MARCKS), which was upregulated 3.4- and 5.7-fold in proplatelet-producing MKs in 2D DIGE and polysome profiling analyses, respectively. MARCKS is a protein kinase C (PKC) substrate that binds PIP2. In MKs, it localized to both the plasma and demarcation membranes. MARCKS inhibition by peptide significantly decreased proplatelet formation 53%. To examine the role of MARCKS in the PKC pathway, we treated MKs with polymethacrylate (PMA), which markedly increased MARCKS phosphorylation while significantly inhibiting proplatelet formation 84%, suggesting that MARCKS phosphorylation reduces proplatelet formation. We hypothesized that MARCKS phosphorylation promotes Arp2/3 phosphorylation, which subsequently downregulates proplatelet formation; both MARCKS and Arp2 were dephosphorylated in MKs making proplatelets, and Arp2 inhibition enhanced proplatelet formation. Finally, we used MARCKS knockout (KO) mice to probe the direct role of MARCKS in proplatelet formation; MARCKS KO MKs displayed significantly decreased proplatelet levels. MARCKS expression and signaling in primary MKs is a novel finding. We propose that MARCKS acts as a "molecular switch," binding to and regulating PIP2 signaling to regulate processes like proplatelet extension (microtubule-driven) vs proplatelet branching (Arp2/3 and actin polymerization-driven).


Figures

Figure 1
Figure 1
Protein synthesis inhibition significantly reduces proplatelet formation. Mature, primary murine megakaryocytes were cultured for 24 hours in the IncuCyte system. (A) Representative images of 10-hour time point, ×20 original magnification. (B-D) Rate and extent of proplatelet production were measured in ImageJ. Cells ≥330 µm2 were categorized as (1) round-megakaryocytes (circularity ≥0.4) or (2) proplatelet-producing megakaryocytes (circularity <0.4), and objects were normalized to initial (day 4) object counts and expressed as percentage of proplatelet-producing megakaryocytes. MKs were cultured with (B) puromycin (250 μg/mL, final), (C) cycloheximide (50 μg/mL, final), or (D) chloramphenicol (250 μg/mL, final); n = 3 biological replicates. The scale bar represents 50 um. **P < .005; ****P < .0001.
Figure 2
Figure 2
Proteomic analysis reveals that MARCKS is upregulated in proplatelet-producing MKS. Representative labeled spot maps of murine megakaryocytes cultured for 24 hours ± puromycin (250 μg/mL, final). (A) Gel showing 1.5× or greater differences in spot volume ratio. Blue = increase in Cy5/Cy3 (Puromycin/Untreated), red = increase in Cy3/Cy5 (Untreated/Puromycin). (B) All picked spots to date; of these, the 7 spots with the highest fold difference were subject to MS/MS analysis.
Figure 3
Figure 3
Polysome profiling and western blot show that MARCKS is enriched in proplatelet-producing MKs. (A) Lysates from either round, mature murine MKs preceding proplatelet formation (day 4) or proplatelet-producing MKs (day 5) were subject to sucrose gradient, fractionation, and RNA-seq, as described in Methods. A representative ribosomal profile used in polysome profiling is shown. (B) Murine fetal liver MKs were cultured as described in Methods and lysed at indicated times. Western blots were quantified relative to the loading control, and then normalized to amount of protein on day 3 (n = 3; **P < .005, compared with day 3).
Figure 4
Figure 4
MANS peptide binds to MARCKS and inhibits proplatelet formation. (A) Live MKs at day 4 were treated with either MANS peptide specific for MARCKS (100 μg/mL) RNS control peptide (100 μg/mL) or Di-8-Anepps to highlight the demarcation membrane. Confocal microscopy was performed with a Leica SP5X Laser Scanning Confocal Microscope equipped with a 63Χ (N.A. = 1.4) Plan-Apo oil immersion objective, and a white light laser. Images were obtained and analyzed using the Leica Applications Suite Advanced Fluorescence, version 2.6.6. MANS and ANEPPS are localized to DMS, whereas the control peptide, RNS, is nonspecific and punctated throughout the MK. (B) Apoptosis and (C) Proplatelet formation after treatment with MANS and RNS peptides (n = 5; *P < .01). (D) Representative images; scale bar represents 10 μm. (E) Immunogold transmission electron microscopy showing MARCKS labeling along the plasma membrane (PM) and demarcation membrane invaginations (DMS). Scale bars represent 500 nm.
Figure 5
Figure 5
MARCKS is differentially expressed and phosphorylated during maturation and proplatelet formation in primary murine MKs. (A) MKs were cultured as described and lysed at indicated times. Western blots were quantified relative to the loading control, and then normalized to amount of protein on day 3 (n = 4; ***P < .0001, compared with day 3). (B) Schematic of MARCKS phosphorylation/internalization and dephosphorylation. (C) MKs at day 4 were treated with PMA (PKC activator) at indicated dosages. Percent proplatelet formation was quantified manually and western blots were done to show differential MARCKS phosphorylation status with PMA treatments (n = 4). (D) MKs on day 4 were treated with C2 ceramide (0.1 μM, PP2A activator) or okadaic acid (0.1 μM, PP2A inhibitor). Percent proplatelet formation over time was quantified using the Incucyte imaging system and (E) western blots were done to show differential MARCKS phosphorylation status with treatments (n = 3; *P < .05, **P < .005, ***P < .0001, compared with control).
Figure 6
Figure 6
Phosphorylated MARCKS and Arp2 are downregulated in proplatelet-producing MKs. Murine fetal liver MKs were cultured as described in Methods and lysed at indicated times. Cell fractions were separated by BSA gradient as described in Methods. (A) Representative western blot. (B) Western blots were quantified relative to the loading control, and then normalized to the total amount of protein at day 5 (n = 4; *P < .05, **P < .01, ***P < .005, compared with D5:total). (C) Proposed model of the role of MARCKS vs P-MARCKS in proplatelet formation. (D) MKs on day 4 were treated with PMA (500 pg/mL, PKC activator), CK636 (1 μM, Arp2 inhibitor), or both simultaneously, and percent proplatelet formation over time was quantified using the Incucyte imaging system (n = 3; *P < .05, compared with control).
Figure 7
Figure 7
MARCKS heterozygous mice and KO MKs have impaired platelet formation. (A) Platelet counts were measured from adult, male MARCKS heterozygous (Het) and wild-type (WT) mice, as described (n = 15 mice per group; *P < .05, compared with WT). (B) Primary murine MKs were cultured as previously described after being isolated from MARCKS KO mice. Proplatelet formation was quantified 24 hours after MK gradient isolation (n = 5-6 fetal livers per condition; *P < .05, compared with WT). (C) Representative images of 24-hour time-point (original magnification ×20); scale bar represents 50 μm.

Similar articles

Cited by

References

    1. Machlus KR, Italiano JE., Jr The incredible journey: From megakaryocyte development to platelet formation. J Cell Biol. 2013;201(6):785–796. - PMC - PubMed
    1. Machlus KR, Thon JN, Italiano JE., Jr Interpreting the developmental dance of the megakaryocyte: a review of the cellular and molecular processes mediating platelet formation. Br J Haematol. 2014;165(2):227–236. - PubMed
    1. DHHS. The 2011 national blood collection and utilization survey report. Department of Health and Human Services; 2013.
    1. Thon JN, Macleod H, Begonja AJ, et al. Microtubule and cortical forces determine platelet size during vascular platelet production. Nat Commun. 2012;3:852. - PubMed
    1. Patel SR, Richardson JL, Schulze H, et al. Differential roles of microtubule assembly and sliding in proplatelet formation by megakaryocytes. Blood. 2005;106(13):4076–4085. - PMC - PubMed

Publication types

MeSH terms