

31P magnetization transfer measurements of Pi→ATP flux in exercising human muscle
- PMID: 26744504
- PMCID: PMC4796179
- DOI: 10.1152/japplphysiol.00871.2015
31P magnetization transfer measurements of Pi→ATP flux in exercising human muscle
Abstract
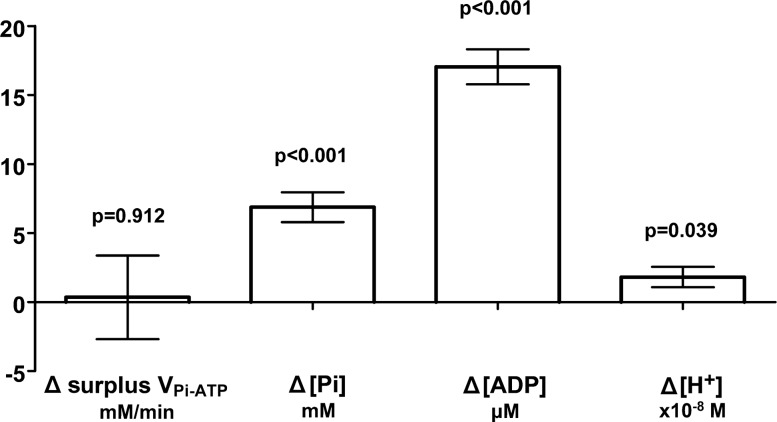
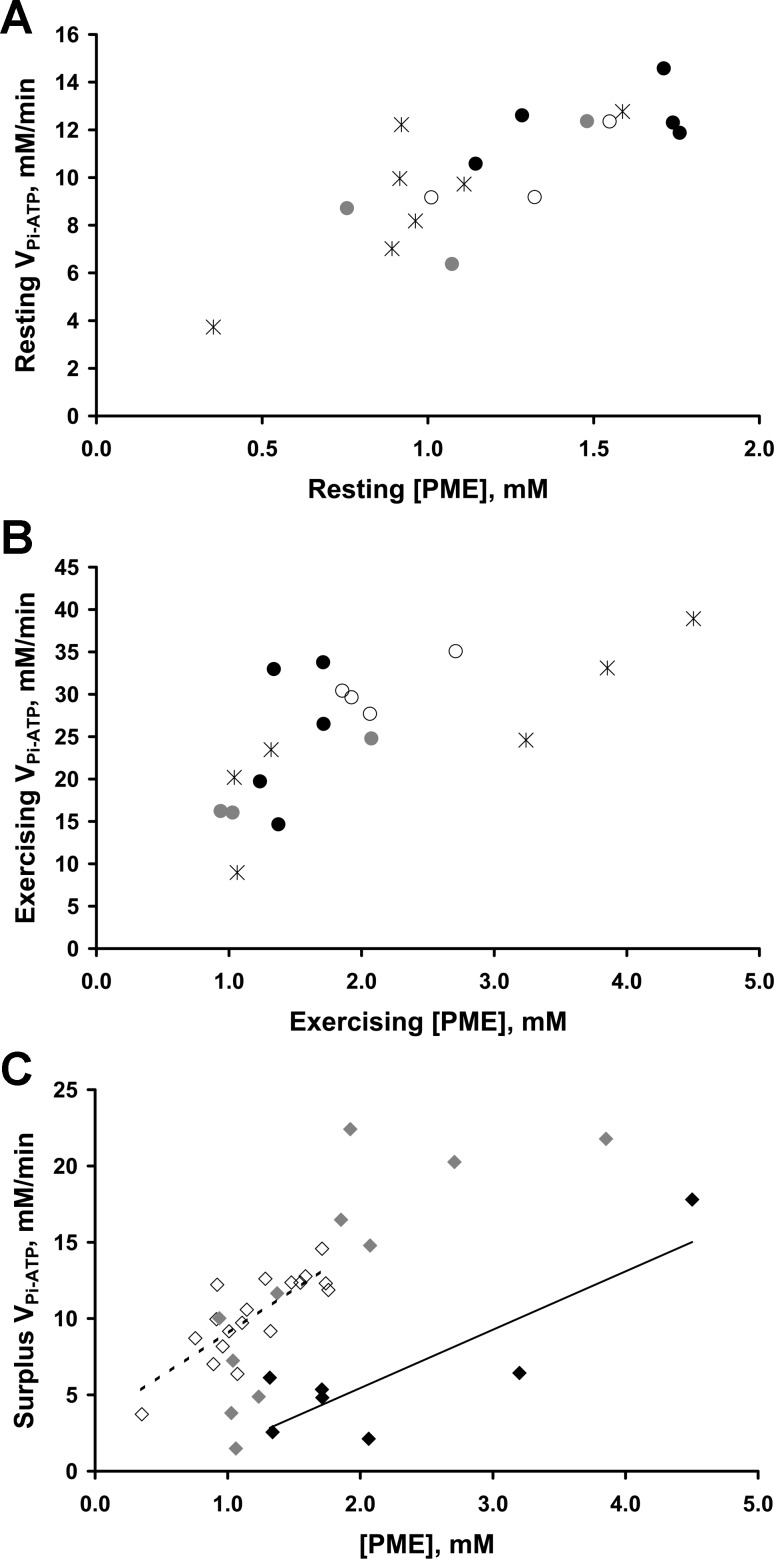
Fundamental criticisms have been made over the use of (31)P magnetic resonance spectroscopy (MRS) magnetization transfer estimates of inorganic phosphate (Pi)→ATP flux (VPi-ATP) in human resting skeletal muscle for assessing mitochondrial function. Although the discrepancy in the magnitude of VPi-ATP is now acknowledged, little is known about its metabolic determinants. Here we use a novel protocol to measure VPi-ATP in human exercising muscle for the first time. Steady-state VPi-ATP was measured at rest and over a range of exercise intensities and compared with suprabasal oxidative ATP synthesis rates estimated from the initial rates of postexercise phosphocreatine resynthesis (VATP). We define a surplus Pi→ATP flux as the difference between VPi-ATP and VATP. The coupled reactions catalyzed by the glycolytic enzymes GAPDH and phosphoglycerate kinase (PGK) have been shown to catalyze measurable exchange between ATP and Pi in some systems and have been suggested to be responsible for this surplus flux. Surplus VPi-ATP did not change between rest and exercise, even though the concentrations of Pi and ADP, which are substrates for GAPDH and PGK, respectively, increased as expected. However, involvement of these enzymes is suggested by correlations between absolute and surplus Pi→ATP flux, both at rest and during exercise, and the intensity of the phosphomonoester peak in the (31)P NMR spectrum. This peak includes contributions from sugar phosphates in the glycolytic pathway, and changes in its intensity may indicate changes in downstream glycolytic intermediates, including 3-phosphoglycerate, which has been shown to influence the exchange between ATP and Pi catalyzed by GAPDH and PGK.
Keywords: 31P magnetization transfer; Pi↔ATP exchange; exercising muscle; saturation transfer.
Copyright © 2016 the American Physiological Society.
Figures
Similar articles
-
High-intensity interval training increases in vivo oxidative capacity with no effect on P(i)→ATP rate in resting human muscle.Am J Physiol Regul Integr Comp Physiol. 2013 Mar 1;304(5):R333-42. doi: 10.1152/ajpregu.00409.2012. Epub 2012 Dec 19. Am J Physiol Regul Integr Comp Physiol. 2013. PMID: 23255590 Free PMC article.
-
What do magnetic resonance-based measurements of Pi→ATP flux tell us about skeletal muscle metabolism?Diabetes. 2012 Aug;61(8):1927-34. doi: 10.2337/db11-1725. Diabetes. 2012. PMID: 22826313 Free PMC article. Review.
-
31P NMR saturation-transfer measurements in Saccharomyces cerevisiae: characterization of phosphate exchange reactions by iodoacetate and antimycin A inhibition.Biochemistry. 1987 Nov 17;26(23):7483-92. doi: 10.1021/bi00397a043. Biochemistry. 1987. PMID: 3322400
-
31P NMR studies of ATP synthesis and hydrolysis kinetics in the intact myocardium.Biochemistry. 1987 Nov 17;26(23):7501-10. doi: 10.1021/bi00397a045. Biochemistry. 1987. PMID: 3427090
-
Absolute quantification of phosphorus metabolite concentrations in human muscle in vivo by 31P MRS: a quantitative review.NMR Biomed. 2007 Oct;20(6):555-65. doi: 10.1002/nbm.1192. NMR Biomed. 2007. PMID: 17628042 Review.
Cited by
-
Quantifying H+ exchange from muscle cytosolic energy catabolism using metabolite flux and H+ coefficients from multiple competitive cation binding: New evidence for consideration in established theories.Physiol Rep. 2021 Apr;9(7):e14728. doi: 10.14814/phy2.14728. Physiol Rep. 2021. PMID: 33904663 Free PMC article.
-
Multinuclear MRS at 7T Uncovers Exercise Driven Differences in Skeletal Muscle Energy Metabolism Between Young and Seniors.Front Physiol. 2020 Jun 29;11:644. doi: 10.3389/fphys.2020.00644. eCollection 2020. Front Physiol. 2020. PMID: 32695010 Free PMC article.
-
Modular 31 P wideband inversion transfer for integrative analysis of adenosine triphosphate metabolism, T1 relaxation and molecular dynamics in skeletal muscle at 7T.Magn Reson Med. 2019 Jun;81(6):3440-3452. doi: 10.1002/mrm.27686. Epub 2019 Feb 22. Magn Reson Med. 2019. PMID: 30793793 Free PMC article.
-
In-vivo31P-MRS of skeletal muscle and liver: A way for non-invasive assessment of their metabolism.Anal Biochem. 2017 Jul 15;529:193-215. doi: 10.1016/j.ab.2017.01.018. Epub 2017 Jan 21. Anal Biochem. 2017. PMID: 28119063 Free PMC article. Review.
-
Feasibility and repeatability of localized (31) P-MRS four-angle saturation transfer (FAST) of the human gastrocnemius muscle using a surface coil at 7 T.NMR Biomed. 2016 Jan;29(1):57-65. doi: 10.1002/nbm.3445. NMR Biomed. 2016. PMID: 26684051 Free PMC article.
References
-
- Arnold DL, Matthews PM, Radda GK. Metabolic recovery after exercise and the assessment of mitochondrial function in vivo in human skeletal muscle by means of 31P NMR. Magn Reson Med 1: 307–315, 1984. - PubMed
-
- Balaban RS, Koretsky AP. Interpretation of 31P NMR saturation transfer experiments: what you can't see might confuse you. Focus on “Standard magnetic resonance-based measurements of the Pi→ATP rate do not index the rate of oxidative phosphorylation in cardiac and skeletal muscles”. Am J Physiol Cell Physiol 301: C12–C15, 2011. - PMC - PubMed
-
- Brand MD. The efficiency and plasticity of mitochondrial energy transduction. Biochem Soc Trans 33: 897–904, 2005. - PubMed
-
- Brindle KM. 31P NMR magnetization-transfer measurements of flux between inorganic phosphate and adenosine 5′-triphosphate in yeast cells genetically modified to overproduce phosphoglycerate kinase. Biochemistry 27: 6187–6196, 1988. - PubMed
Publication types
MeSH terms
Substances
Grants and funding
LinkOut - more resources
Full Text Sources
Other Literature Sources
Medical
Research Materials
Miscellaneous