. 2016 Mar 3;10(1-2):163-78.
doi: 10.1080/19336918.2016.1139265. Epub 2016 Jan 8.

CCN1 (CYR61) and CCN3 (NOV) signaling drives human trophoblast cells into senescence and stimulates migration properties

Affiliations

CCN1 (CYR61) and CCN3 (NOV) signaling drives human trophoblast cells into senescence and stimulates migration properties

Friederike Kipkeew et al. Cell Adh Migr. .

Abstract

During placental development, continuous invasion of trophoblasts into the maternal compartment depends on the support of proliferating extravillous trophoblasts (EVTs). Unlike tumor cells, EVTs escape from the cell cycle before invasion into the decidua and spiral arteries. This study focused on the regulation properties of glycosylated and non-glycosylated matricellular CCN1 and CCN3, primarily for proliferation control in the benign SGHPL-5 trophoblast cell line, which originates from the first-trimester placenta. Treating SGHPL-5 trophoblast cells with the glycosylated forms of recombinant CCN1 and CCN3 decreased cell proliferation by bringing about G0/G1 cell cycle arrest, which was accompanied by the upregulation of activated Notch-1 and its target gene p21. Interestingly, both CCN proteins increased senescence-associated β-galactosidase activity and the expression of the senescence marker p16. The migration capability of SGHPL-5 cells was mostly enhanced in response to CCN1 and CCN3, by the activation of FAK and Akt kinase but not by the activation of ERK1/2. In summary, both CCN proteins play a key role in regulating trophoblast cell differentiation by inducing senescence and enhancing migration properties. Reduced levels of CCN1 and CCN3, as found in early-onset preeclampsia, could contribute to a shift from invasive to proliferative EVTs and may explain their shallow invasion properties in this disease.

Keywords: CCN1; CCN3; migration; placenta; senescence; trophoblast.


Figures

Figure 1.
Figure 1.
CCN1 and CCN3 significantly reduce the proliferation of SGHPL-5 trophoblast cells. (A) Total cell numbers were determined after treatment of SGHPL-5 cells with 1 µg/ml of non-glycosylated recombinant human CCN1 (ng-rhCCN1), ng-rhCCN3, glycosylated (g)-rhCCN1 and g-rhCCN3. Proliferation was significantly lower in response to g-rhCCN1, ng-CCN3, and g-rhCCN3 than in control cultures (ctrl); proliferation was slightly reduced after treatment with ng-rhCCN1. N = 3. *P ≤ 0.05. (B) Staining of SHGPL-5 cells treated with g-rhCCN1 or g-rhCCN3 alone, preincubated with anti-CCN1 or anti-CCN3 and anti-CCN1 or anti CCN3 alone, compared with staining of control cells for the early apoptosis marker Annexin V (AnnV+/propidium iodide [PI]). Numbers of stained cells as a percentage were determined by fluorescence-activated cell sorting. Apoptosis was significantly increased only after treatment with g-rhCCN1. *P ≤ 0.05. (C) Determination of the number of polyploid SGHP-5 cells as a percentage (percentage of cells with n > 4) after treatment for 24 h with CCN1 and CCN3 recombinant proteins. No significant changes in polyploidy were found.
Figure 2.
Figure 2.
Treatment with CCN1 and CCN3 results in a G0/G1 cell cycle arrest of SGHPL-5 cells. Analysis of cell cycle phase distribution (G0/G1, S, G2/M, apoptotic) in SGHPL-5 cells after 24 h treatment with glycosylated recombinant human CCN1 (g-rhCCN1), g-rhCCN3, non-glycosylated rhCCN1 (ng-rhCCN1), or ng-rhCCN3 with the fluorescein isothiocyanate (FITC) bromodeoxyuridine (BrdU) Flow Kit and fluorescence-activated cell sorting (FACS) showed that both glycosylation forms of CCN1 and CCN3 induced a G0/G1 cell cycle arrest. (A) Analysis was performed according to the manufactures instruction (R9: G0/G1, R10: G2/M, R11: S-phase and R12: apoptotic cells). Representative FACS blots of each treatment condition are shown. N = 3. *P ≤ 0.05. (B) Analysis of cell cycle distribution. The proportion of SGHPL-5 cells remaining in G0/G1 after treatment with CCN1 and CCN3 for 24 h was significantly higher than that in control cells. The number of cells in G2/M phase was significantly reduced by treatment with ng-rhCCN1, g-rhCCN1, or g-rhCCN3. N = 3. *P ≤ 0.05.
Figure 3.
Figure 3.
CCN1 and CCN3 activate Notch-1/p21 signaling in SGHPL-5 cells. (A) Exemplary Western blots of the cleaved Notch-1 receptor and (B) the expression of its target gene p21 expression in SGHPL-5 cells after treatment with CCN1 or CCN3 for 2 h or 8 h are shown. Levels of protein expression are normalized to glyceraldehyde 3-phosphate dehydrogenase (GAPDH) or β-actin. Relative expression values of protein quantification are shown as mean expression levels normalized to GAPDH or β-actin above the Western blots. Columns represent the means of three independent measurements; error bars represent SEM. *, P ≤ 0.05 versus control. Cleavage of the Notch-1 receptor and, thus, activation of the Notch pathway is enhanced in cells treated with CCN1 or CCN3 than in control cells. The activated Notch pathway in turn upregulates the expression of the cell cycle regulator p21. *P ≤ 0.05.
Figure 4.
Figure 4.
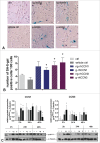
Senescence associated β-Gal staining in SGHPL-5 cells is enhanced by treatment with CCN1 and CCN3. (A) Analysis of cellular senescence in SGHPL-5 cells after treatment with CCN1 and CCN3 for 48 h as determined by SA-β-gal staining (shown as blue staining). Scale bar, 50 µM. (B) Numbers of SA-β-gal positive cells per 100 cells were determined by microscopic observation. The results showed that the occurrence of senescent cells after 48 h of treatment with glycosylated recombinant human CCN1 (g-rhCCN1), g-rhCCN3, or non-glycosylated (ng)-rhCCN3 treatment was significantly higher than that in untreated control cells (ctrl). (C) Exemplary Western blot of protein expression of the cell cycle regulator and senescence marker p16INK4A in SGHPL-5 cells after treatment with CCN1 or CCN3 for 2, 24, or 48 h. Levels of protein expression are normalized to α-tubulin. Densitometric analysis of relative expression values of protein quantification is shown as mean expression levels normalized to α-tubulin (N = 3) above the Western blot. Columns represent the means of three independent measurements; error bars represent SEM. *, P ≤ 0.05 vs. control. The expression of p16 is upregulated after 2 h of treatment with CCN1 and CCN3. *P ≤ 0.05.
Figure 5.
Figure 5.
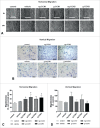
CCN1 and CCN3 change the migration properties of SGHPL-5 trophoblast cells. (A) Exemplary phase micrographs of wound healing horizontal migration assays using ibidi co-culture chambers. SGHPL-5 cells were treated with glycosylated or non-glycosylated CCNs for 24 h. Untreated cells were used as controls (controls and vehicle controls). Each micrograph is representative of three independent experiments. Glycosylated and non-glycosylated CCNs stimulated the horizontal migration of SGHPL-5 cells; the most pronounced effect was achieved with glycosylated CCNs compared to controls. Scale bar, 500 µm. (B) Exemplary micrographs of migration assays using transwell chambers are shown. The cells were treated with glycosylated or non-glycosylated CCNs for 6 h. Five random fields per condition were photographed at 20× magnification. Interestingly, non-glycosylated CCN1 (ng-CCN1) and CCN3 (ng-CCN3) slightly induced migration, whereas glycosylated (g)-CCN3 significantly reduced the migration capability of SGHPL-5 cells. Scale bar, 50 µm. (C) Quantification of horizontal migration assays. Bars represent mean values of three independent experiments; error bars indicate SD. Horizontal migration was significantly enhanced after stimulation with glycosylated CCNs and non-glycosylated CCN1 compared to controls. N = 3 *P ≤ 0.05 (D) Quantification of vertical migration assays using transwell chambers. Bars represent mean values of three separate (glycosylated and non-glycosylated) experiments performed in duplicate; error bars indicate SD. Mean value of untreated cultures (control) was arbitrarily set at 100%. Vertical migration of SGHPL-5 cells was moderately higher after treatment with non-glycosylated (ng)-CCN3 and with ng-CCN1, not changed upon g-CCN1, but it was significantly reduced by treatment with g-CCN3. N = 3. *P ≤ 0.05.
Figure 6.
Figure 6.
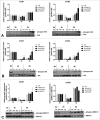
Analysis of matrix metalloproteinase (MMP)-2 and MMP-9 mRNA in SGHPL-5 trophoblast cells after treatment with CCN1 or CCN3. Relative transcript expression of MMP-2 and MMP-9 in SGHPL-5 cells after treatment with CCN1 or CCN3 for 2, 4, or 8 h, as determined by quantitative polymerase chain reaction (q-PCR). The glycosylated forms of CCN1 and CCN3 enhanced mRNA expression of MMP-9 (A), whereas the expression of MMP-2 mRNA (B) was not different from that of controls after treatment with CCN1 or CCN3. Levels of mRNA expression are normalized to β-actin. Relative expression values are shown as mean expression levels normalized to β-actin (N = 3). Columns represent the means of three independent measurements; error bars represent SEM. *P ≤ 0.05 versus controls.
Figure 7.
Figure 7.
Analysis of activation of focal adhesion kinase (FAK), Akt, and extracellular signal-related kinase (ERK) in SGHPL-5 trophoblast cells after treatment with CCN1 or CCN3. Densitometric analysis of the expression of phosphorylated FAK (A), Akt (B), and ERK1/2 (C) compared to total expression of FAK, Akt, and ERK in SGHPL-5 cells after treatment with CCN1 or CCN3 for 2 or 8 h. Columns represent the means of three independent measurements; error bars represent SEM. *, P ≤ 0.05 vs. controls. An exemplary Western blot is shown below the graphs. Phosphorylation of FAK is significantly enhanced only by the glycosylated form of CCN3. (B) Phosphorylation of Akt is significantly increased by both glycosylation forms of CCN1 and by glycosylated recombinant human CCN3 (g-rhCCN3). (C) Phosphorylation of ERK1/2 in SGHPL-5 trophoblast cells is not affected by CCN1 or CCN3. *P ≤ 0.05.
Figure 8.
Figure 8.
Molecular mechanisms of CCN-mediated signaling in the human trophoblast leading to the switch between proliferation and invasion. Treatment with CCN1 or CCN3 decreased cell proliferation via Notch-1, accompanied by an upregulation of activated Notch-1 and its target gene p21, causing a cell cycle arrest. Both CCN proteins increased cellular senescence in SGHPL-5 cells, as characterized by an increase in senescence-associated β-galactosidase activity and p16 expression. In parallel, the migration capability of SGHPL-5 cells was mostly enhanced in response to non-glycosylated CCN1 and CCN3 by the activation of FAK and Akt kinase but not ERK1/2, probably via integrin α5β1 as the receptor. These results are transferable to the placenta. Here the Notch-1 receptor is expressed proximally in the placental cell column, whereas the integrin α5β1 receptor is expressed distally in the invading extravillous cytotrophoblasts (EVTs), as seen in the upper right corner (modified scheme from ref. 9).

Similar articles

Cited by

References

    1. Pijnenborg R, Dixon G, Robertson WB, Brosens I. Trophoblastic invasion of human decidua from 8 to 18 weeks of pregnancy. Placenta 1980; 1(1):3-19; PMID:7443635; http://dx.doi.org/ 10.1016/S0143-4004(80)80012-9 - DOI - PubMed
    1. Lyall F. Mechanisms regulating cytotrophoblast invasion in normal pregnancy and pre-eclampsia. Aust N Z J Obstet Gynaecol 2006; 46(4):266-73; PMID:16866784; http://dx.doi.org/ 10.1111/j.1479-828X.2006.00589.x - DOI - PubMed
    1. Handwerger S. New insights into the regulation of human cytotrophoblast cell differentiation. Mol Cell Endocrinol 2010; 323(1):94-104; PMID:20036312; http://dx.doi.org/ 10.1016/j.mce.2009.12.015 - DOI - PMC - PubMed
    1. Ji L, Brkić J, Liu M, Fu G, Peng C, Wang YL. Placental trophoblast cell differentiation: physiological regulation and pathological relevance to preeclampsia. Mol Aspects Med 2013; 34(5):981-1023; PMID:23276825; http://dx.doi.org/ 10.1016/j.mam.2012.12.008 - DOI - PubMed
    1. Nakayama H, Scott IC, Cross JC. The transition to endoreduplication in trophoblast giant cells is regulated by the mSNA zinc finger transcription factor. Dev Biol 1998; 199(1):150-63; PMID:9676199; http://dx.doi.org/ 10.1006/dbio.1998.8914 - DOI - PubMed

Publication types

MeSH terms

Substances