

In vitro formation of neuroclusters in microfluidic devices and cell migration as a function of stromal-derived growth factor 1 gradients
- PMID: 26744909
- PMCID: PMC5308225
- DOI: 10.1080/19336918.2015.1131388
In vitro formation of neuroclusters in microfluidic devices and cell migration as a function of stromal-derived growth factor 1 gradients
Abstract
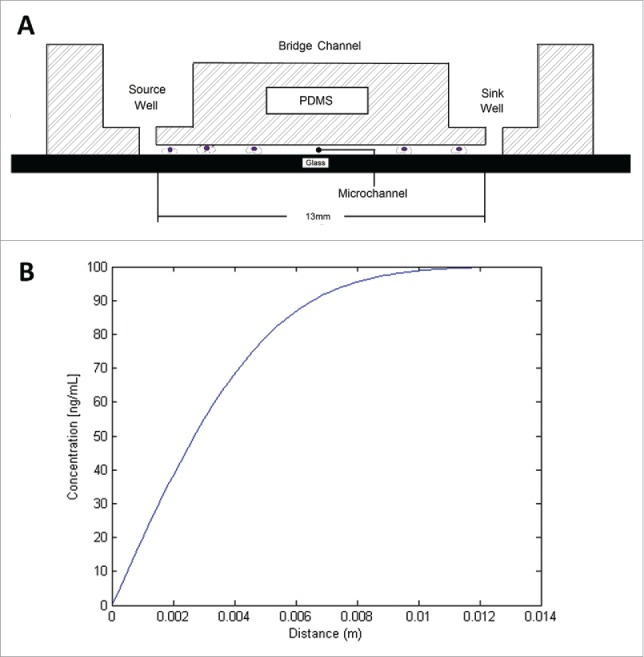
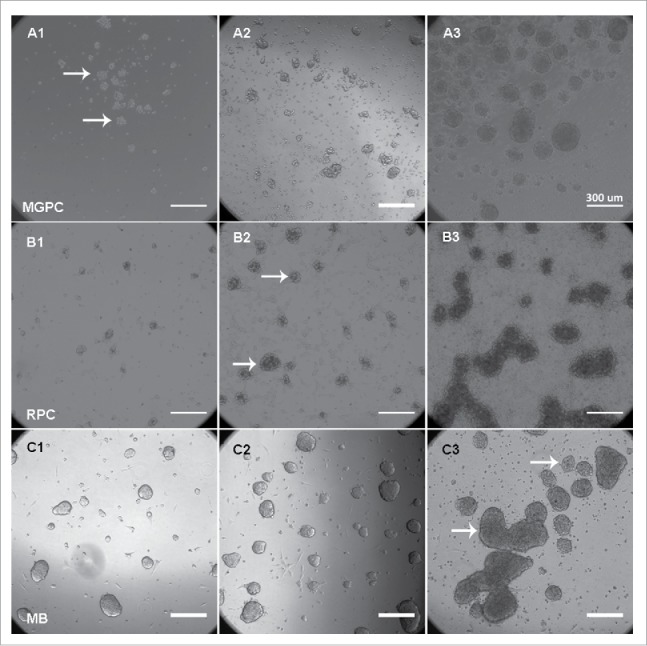
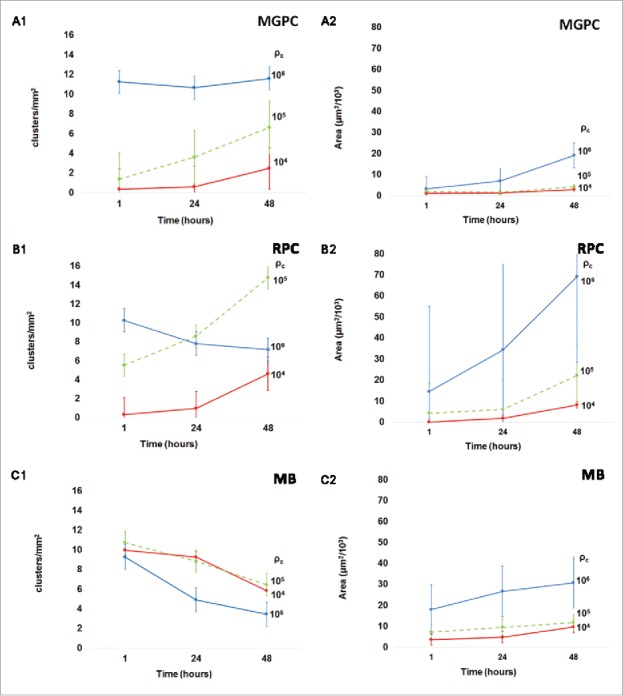
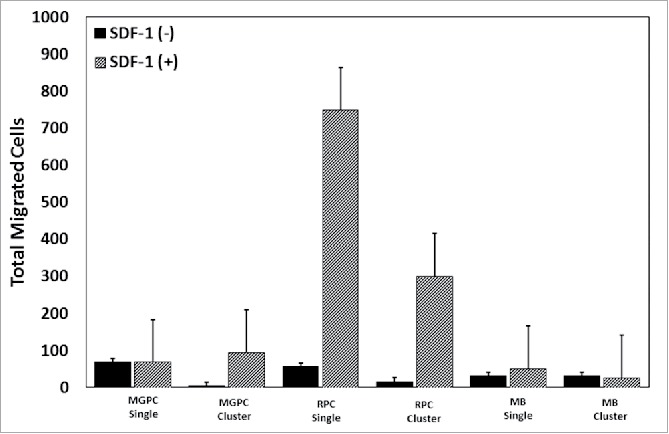
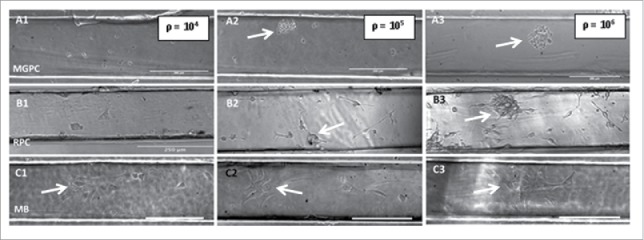
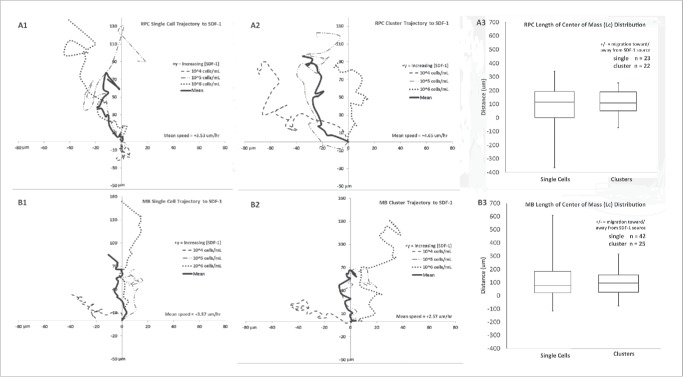
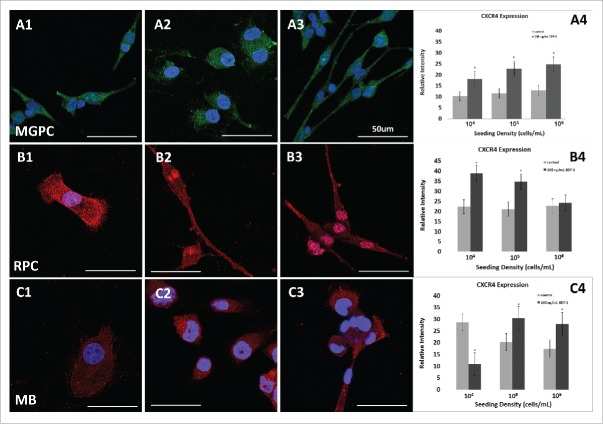
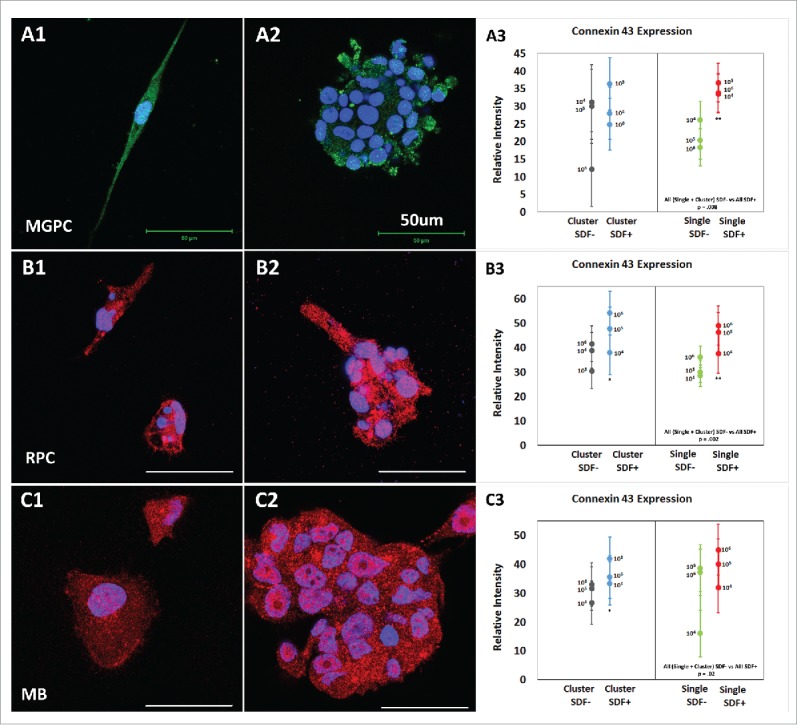
Central nervous system (CNS) cells cultured in vitro as neuroclusters are useful models of tissue regeneration and disease progression. However, the role of cluster formation and collective migration of these neuroclusters to external stimuli has been largely unstudied in vitro. Here, 3 distinct CNS cell types, medulloblastoma (MB), medulloblastoma-derived glial progenitor cells (MGPC), and retinal progenitor cells (RPC), were examined with respect to cluster formation and migration in response to Stromal-Derived Growth Factor (SDF-1). A microfluidic platform was used to distinguish collective migration of neuroclusters from that of individual cells in response to controlled concentration profiles of SDF-1. Cell lines were also compared with respect to expression of CXCR4, the receptor for SDF-1, and the gap junction protein Connexin 43 (Cx43). All cell types spontaneously formed clusters and expressed both CXCR4 and Cx43. RPC clusters exhibited collective chemotactic migration (i.e. movement as clusters) along SDF-1 concentration gradients. MGPCs clusters did not exhibit adhesion-based migration, and migration of MB clusters was inconsistent. This study demonstrates how controlled microenvironments can be used to examine the formation and collective migration of CNS-derived neuroclusters in varied cell populations.
Keywords: SDF-1; central nervous system; chemotaxis; collective migration; medulloblastoma; retinal progenitors; stromal-derived growth factor.
Figures
References
-
- Askenasy N, Zorina T, Farkas DL, Shalit I. Transplanted hematopoietic cells seed in clusters in recipient bone marrow in vivo. Stem Cells 2002; 20(4):301-10; PMID:12110699; http://dx.doi.org/ 10.1634/stemcells.20-4-301 - DOI - PubMed
-
- Friedl P, Gilmour D. Collective cell migration in morphogenesis, regeneration and cancer. Nat Rev Mol Cell Biol 2009; 10:445-4; http://dx.doi.org/ 10.1038/nrm2720 - DOI - PubMed
-
- Aceto N, Bardia A, Miyamoto DT, Donaldson MC, Wittner BS, Spencer JA, Yu M, Pely A, Engstrom A, Zhu H et al.. Circulating tumor cell clusters are oligoclonal precursors of breast cancer metastasis. Cell 2014; 158(5):1110-22; http://dx.doi.org/ 10.1016/j.cell.2014.07.013 - DOI - PMC - PubMed
-
- Gilbert SF. Developmental Biology. 6th edition Sunderland (MA: ): Sinauer Associates; 2000
-
- Galanternik MV, Kramer KL, Piotrowski T. Heparan sulfate proteoglycans regulate Fgf signaling and cell polarity during collective cell migration. Cell Rep 2015. 10, Issue 3, p414-428; http://dx.doi.org/ 10.1016/j.celrep.2014.12.043 - DOI - PMC - PubMed
Publication types
MeSH terms
Substances
Grants and funding
LinkOut - more resources
Full Text Sources
Other Literature Sources
Miscellaneous