Interneurons contribute to the hemodynamic/metabolic response to epileptiform discharges
- PMID: 26745250
- PMCID: PMC4808133
- DOI: 10.1152/jn.00994.2014
Interneurons contribute to the hemodynamic/metabolic response to epileptiform discharges
Abstract
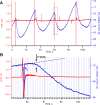
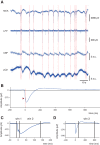
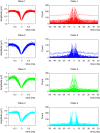
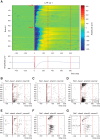
Interpretation of hemodynamic responses in epilepsy is hampered by an incomplete understanding of the underlying neurovascular coupling, especially the contributions of excitation and inhibition. We made simultaneous multimodal recordings of local field potentials (LFPs), firing of individual neurons, blood flow, and oxygen level in the somatosensory cortex of anesthetized rats. Epileptiform discharges induced by bicuculline injections were used to trigger large local events. LFP and blood flow were robustly coupled, as were LFP and tissue oxygen. In a parametric linear model, LFP and the baseline activities of cerebral blood flow and tissue partial oxygen tension contributed significantly to blood flow and oxygen responses. In an analysis of recordings from 402 neurons, blood flow/tissue oxygen correlated with the discharge of putative interneurons but not of principal cells. Our results show that interneuron activity is important in the vascular and metabolic responses during epileptiform discharges.
Keywords: action potentials; animal models; cerebral hemodynamics; electrophysiology; epilepsy; neurovascular coupling; oxygen.
Copyright © 2016 the American Physiological Society.
Figures


Similar articles
-
Pathway-specific variations in neurovascular and neurometabolic coupling in rat primary somatosensory cortex.J Cereb Blood Flow Metab. 2009 May;29(5):976-86. doi: 10.1038/jcbfm.2009.23. Epub 2009 Apr 1. J Cereb Blood Flow Metab. 2009. PMID: 19337274
-
Nonlinear neurovascular coupling in rat sensory cortex by activation of transcallosal fibers.J Cereb Blood Flow Metab. 2007 Mar;27(3):575-87. doi: 10.1038/sj.jcbfm.9600372. Epub 2006 Aug 9. J Cereb Blood Flow Metab. 2007. PMID: 16896350
-
Investigation of linear coupling between single-event blood flow responses and interictal discharges in a model of experimental epilepsy.J Neurophysiol. 2010 Jun;103(6):3139-52. doi: 10.1152/jn.01048.2009. Epub 2010 Mar 24. J Neurophysiol. 2010. PMID: 20457851
-
A New Computational Model for Neuro-Glio-Vascular Coupling: Astrocyte Activation Can Explain Cerebral Blood Flow Nonlinear Response to Interictal Events.PLoS One. 2016 Feb 5;11(2):e0147292. doi: 10.1371/journal.pone.0147292. eCollection 2016. PLoS One. 2016. PMID: 26849643 Free PMC article.
-
Inhibition and brain work.Neuron. 2007 Dec 6;56(5):771-83. doi: 10.1016/j.neuron.2007.11.008. Neuron. 2007. PMID: 18054855 Free PMC article. Review.
Cited by
-
Function and development of interneurons involved in brain tissue oxygen regulation.Front Mol Neurosci. 2022 Nov 24;15:1069496. doi: 10.3389/fnmol.2022.1069496. eCollection 2022. Front Mol Neurosci. 2022. PMID: 36504684 Free PMC article. Review.
-
What Triggers the Interictal Epileptic Spike? A Multimodal Multiscale Analysis of the Dynamic of Synaptic and Non-synaptic Neuronal and Vascular Compartments Using Electrical and Optical Measurements.Front Neurol. 2021 Feb 12;12:596926. doi: 10.3389/fneur.2021.596926. eCollection 2021. Front Neurol. 2021. PMID: 33643187 Free PMC article.
-
Early Development of the GABAergic System and the Associated Risks of Neonatal Anesthesia.Int J Mol Sci. 2021 Nov 30;22(23):12951. doi: 10.3390/ijms222312951. Int J Mol Sci. 2021. PMID: 34884752 Free PMC article. Review.
-
The Contribution of Dysfunctional Chloride Channels to Neurovascular Deficiency and Neurodegeneration.Front Pharmacol. 2021 Oct 4;12:754743. doi: 10.3389/fphar.2021.754743. eCollection 2021. Front Pharmacol. 2021. PMID: 34671264 Free PMC article. No abstract available.
-
Temporal and Spatial Dynamics of Different Interictal Epileptic Discharges: A Time-Frequency EEG Approach in Pediatric Focal Refractory Epilepsy.Front Neurol. 2020 Sep 8;11:941. doi: 10.3389/fneur.2020.00941. eCollection 2020. Front Neurol. 2020. PMID: 33013634 Free PMC article.
References
-
- Attwell D, Iadecola C. The neural basis of functional brain imaging signals. Trends Neurosci 25: 621–625, 2002. - PubMed
-
- Barthó P, Hirase H, Monconduit L, Zugaro M, Harris KD, Buzsaki G. Characterization of neocortical principal cells and interneurons by network interactions and extracellular features. J Neurophysiol 92: 600–608, 2004. - PubMed
-
- Bartolomei F, Wendling F, Bellanger JJ, Regis J, Chauvel P. Neural networks involving the medial temporal structures in temporal lobe epilepsy. Clin Neurophysiol 112: 1746–1760, 2001. - PubMed
-
- Bénar CG, Grova C, Kobayashi E, Bagshaw AP, Aghakhani Y, Dubeau F, Gotman J. EEG-fMRI of epileptic spikes: concordance with EEG source localization and intracranial EEG. Neuroimage 30: 1161–1170, 2006. - PubMed
Publication types
MeSH terms
Substances
LinkOut - more resources
Full Text Sources
Other Literature Sources
Medical

