. 2016 Jan 8;10(1):e0004285.
doi: 10.1371/journal.pntd.0004285. eCollection 2016 Jan.

Trypanosoma cruzi Experimental Infection Impacts on the Thymic Regulatory T Cell Compartment

Affiliations

Trypanosoma cruzi Experimental Infection Impacts on the Thymic Regulatory T Cell Compartment

Florencia Belén González et al. PLoS Negl Trop Dis. .

Abstract

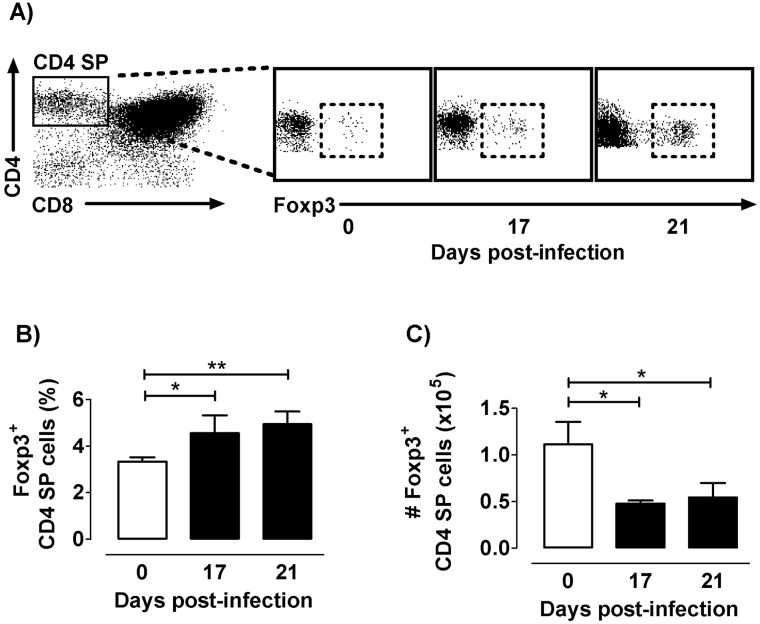
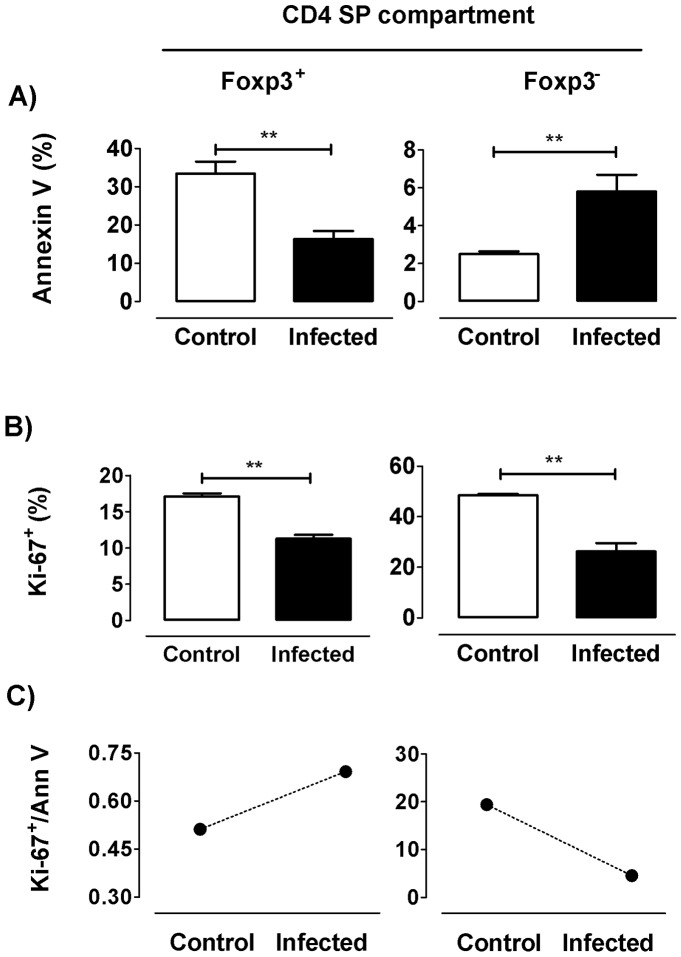
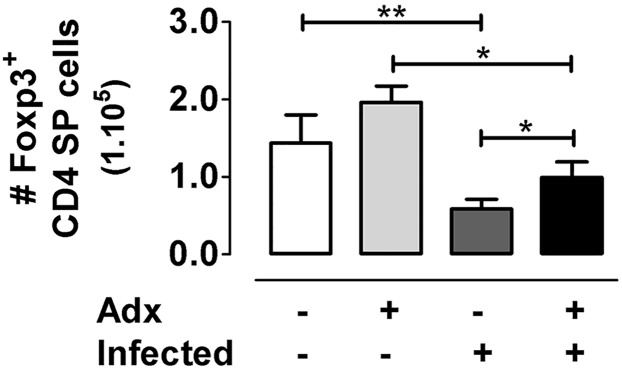
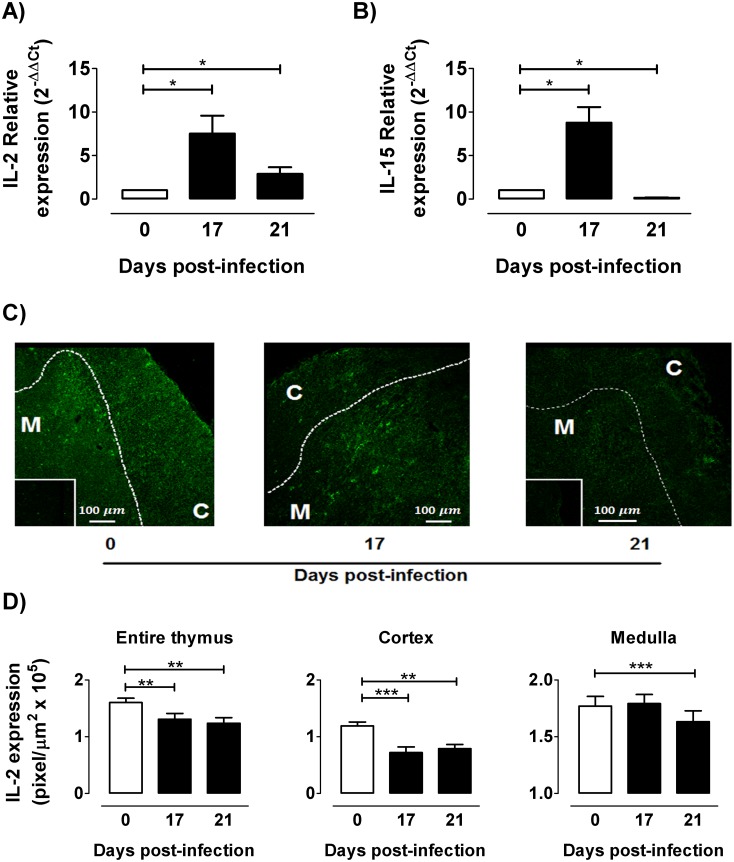
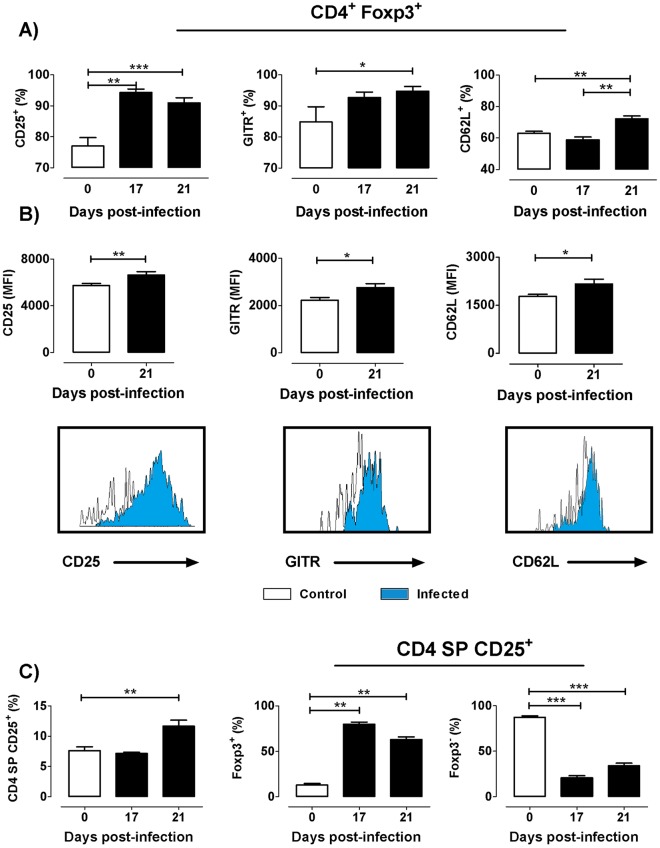
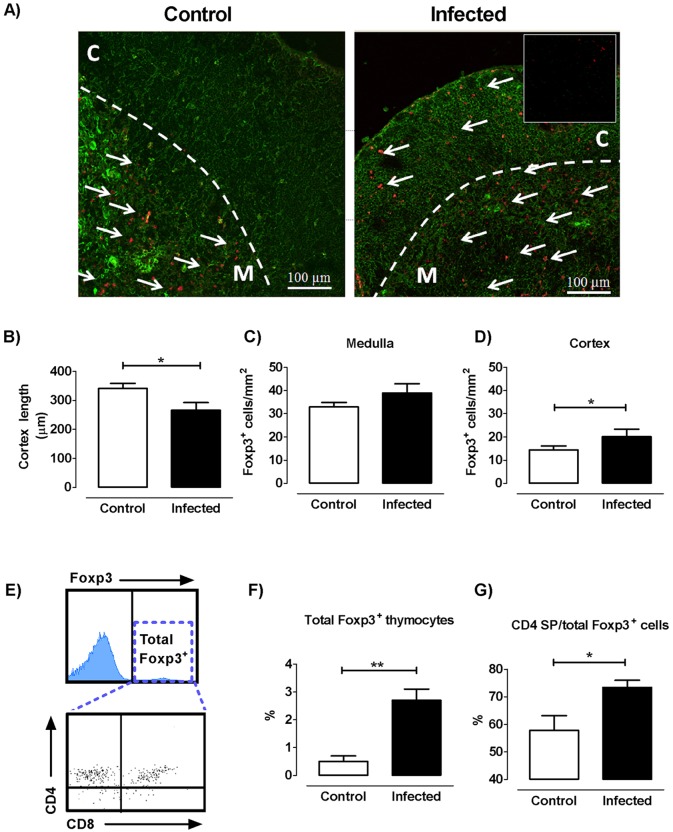
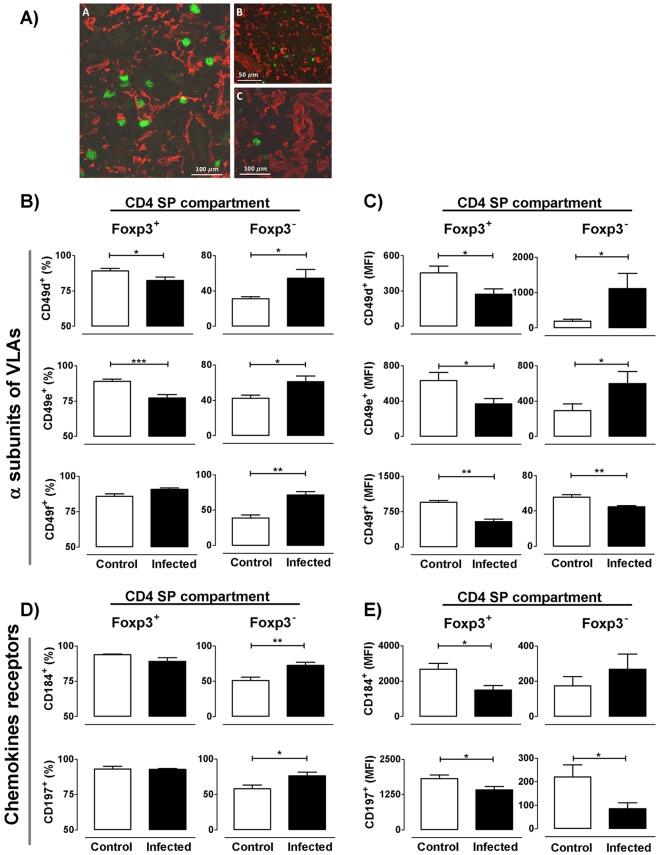
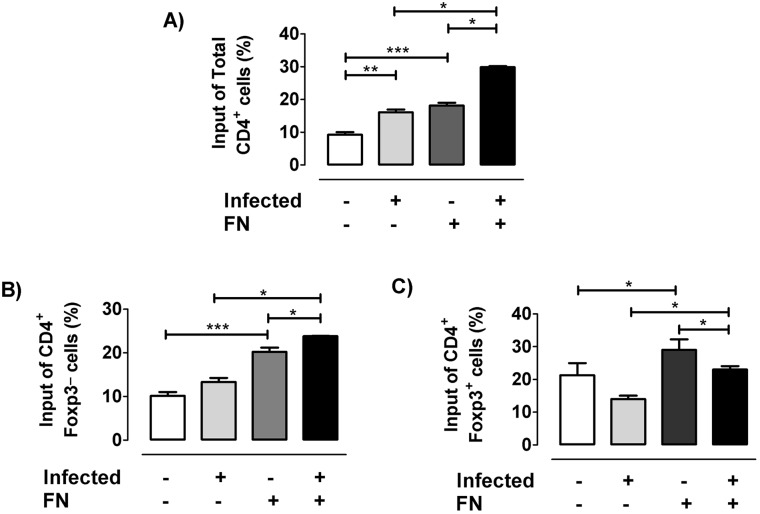
The dynamics of regulatory T cells in the course of Trypanosoma cruzi infection is still debated. We previously demonstrated that acute murine T. cruzi infection results in an impaired peripheral CD4+Foxp3+ T cell differentiation due to the acquisition of an abnormal Th1-like phenotype and altered functional features, negatively impacting on the course of infection. Moreover, T. cruzi infection induces an intense thymic atrophy. As known, the thymus is the primary lymphoid organ in which thymic-derived regulatory T cells, known as tTregs, differentiate. Considering the lack of available data about the effect of T. cruzi infection upon tTregs, we examined tTreg dynamics during the course of disease. We confirmed that T. cruzi infection induces a marked loss of tTreg cell number associated to cell precursor exhaustion, partially avoided by glucocorticoid ablation- and IL-2 survival factor depletion. At the same time, tTregs accumulate within the CD4 single-positive compartment, exhibiting an increased Ki-67/Annexin V ratio compared to controls. Moreover, tTregs enhance after the infection the expression of signature markers (CD25, CD62L and GITR) and they also display alterations in the expression of migration-associated molecules (α chains of VLAs and chemokine receptors) such as functional fibronectin-driven migratory disturbance. Taken together, we provide data demonstrating profound alterations in tTreg compartment during acute murine T. cruzi infection, denoting that their homeostasis is significantly affected. The evident loss of tTreg cell number may compromise the composition of tTreg peripheral pool, and such sustained alteration over time may be partially related to the immune dysregulation observed in the chronic phase of the disease.


Conflict of interest statement

The authors have declared that no competing interests exist.

Figures

Fig 1
Fig 1. Foxp3 expression among CD4 SP cells along infection.
a) Representative dot plots obtained by flow cytometry showing CD4 SP gathered among total thymocytes and Foxp3 expressing cells among CD4 SP cells during the course of infection. b) Frequency of Foxp3+ cells among CD4SP thymocytes. c) Absolute number Foxp3+ cells among CD4SP thymocytes. Values are mean ± s.e.m. of 5–8 mice/day one representative of six experiments performed independently in C57BL/6 mice infected with Tulahuén strain. * p <0.05 and ** p<0.01.
Fig 2
Fig 2. Death and proliferative response of tTregs during T. cruzi infection.
Flow cytometric analysis was achieved in thymocytes from control and 17 days-infected animals. a) Frequency of annexin V+ cells among each Foxp3-defined CD4 SP subpopulation. b) Frequency of Ki-67+ cells among each Foxp3-defined CD4 SP subpopulation. c) Ki-67/annexin V ratio in control and infected animals within the different subpopulations. Values are mean ± s.e.m. of 3–6 mice/day. One representative of two experiments performed independently in C57BL/6 mice infected with Tulahuén strain. ** p<0.01.
Fig 3
Fig 3. Glucocorticoid depletion and tTreg number during T. cruzi infection.
Animals were subjected to adrenalectomy (Adx) or sham surgery one week after infection. After 14 days p.i., thymuses were obtained and the absolute number of CD4+Foxp3+ cells was evaluated by flow cytometry. As observed, there was a clear increase in the number of tTregs in Adx+Infected animals compared to the infected counterparts. Results are representative from two independent experimental rounds carried out in C57BL/6 mice infected with Tulahuén strain. Values are mean ± s.e.m. of 4–6 mice/group* p <0.05 and **p<0.01.
Fig 4
Fig 4. Thymic expression of IL-2 during T. cruzi infection.
After 0, 17 and 21 days p.i., mRNA was extracted from thymuses and quantitative real time RT-PCR was performed for: a) IL-2 b) the IL-2 related cytokine IL-15. In both cases, bars show the relative expression of each thymic transcript using GADPH as reference. Representative results of two independent experiments (n = 3-7/day). For IL-2 localization and semi-quantification, immunofluorescence assays were performed in thymuses from control, 17- and 21 days-infected mice. c) Representative images showed a marked IL-2 inmunoreactivity (green) in both thymic cortex (C) and medulla (M), while cortico-medullary boundary is shown by dotted line. Inserts show negative controls of immunostaining. d) IL-2 intensity (pixel/μm2) was diminished in thymi from infected animals, both in cortex and medulla. Values are mean ± s.e.m. of 3–6 mice/day. One representative of three experiments performed independently in C57BL/6 mice infected with Tulahuén strain. * p <0.05; ** p<0.01 and *** p<0.001.
Fig 5
Fig 5. Expression of CD25, GITR and CD62L among Foxp3 expressing cells during T. cruzi infection.
a) Frequency of CD25, GITR, and CD62L expression among CD4+Foxp3+ cells during the course of infection. b) Mean Fluorescence intensity (MFI) of CD25, GITR and CD62L in CD4+Foxp3+ and the corresponding representative histograms showing the increase in the MFI of three markers after 21 days p.i. compared to the controls. c) Frequency of CD4+CD25+ cells within theCD4 SP compartment and Foxp3+ and Foxp3 cells within the CD4+CD25+ population. Values are mean ± s.e.m. of 3–8 mice/day. One representative of three experiments performed independently in C57BL/6 mice infected with Tulahuén strain. * p <0.05; ** p<0.01 and *** p<0.001.
Fig 6
Fig 6. Cortical and medullary location of Foxp3+ expressing cells.
a) Representative confocal images of thymic lobules from control and infected mice, showing a clear Foxp3+ immunostaining (in red fluorescence) in both cortex (C) and medulla (M). Cytokeratins are detected by green fluorescence, while cortico-medullary boundaries are delimited by a dotted line. b) Variations in cortical thickness after 17 days post-infection. c) Number of Foxp3+ cells per unit area in the medulla. d) Number of Foxp3+ cells per unit area in the cortex. Bars represent the mean ± s.e.m. of data obtained from 10 microscopic fields of thymuses from five control mice and six 17 days-infected mice. Data are representative of two experiments performed independently in C57BL/6 mice infected with Tulahuén strain of parasite. e) Representative analysis of whole thymocytes expressing Foxp3 (Total Foxp3+) where dot plots represent Foxp3+ expressing thymocytes within the different subpopulations. f) Bars represent the variation in the proportions of whole thymic Foxp3+ expressing cells in control and infected thymus. g) Frequency of CD4 SP withinFoxp3 expressing cells. Data correspond to mean ± s.e.m. of 5 mice/group and represent values obtained after 21 days p.i. (one representative of four independent sets of experiments). * p<0.05 and ** p<0.01.
Fig 7
Fig 7. Alterations in migratory-related molecules among Foxp3 expressing cells during infection.
a) Localization by immunofluorescence of cytokeratins, extracellular matrix molecules and Foxp3+ cells in the thymus of normal (Panel A) and 17 days-infected mice (Panels B and C). Panel A shows medullary Foxp3+ cells in close contact with the medullary epithelial stroma (denoted by cytokeratin red staining). Panels B and C show Foxp3+ cells located in regions with high extracellular matrix network density, as seen by staining with the anti-laminin antibody (red staining, panel B) and anti-fibronectin (red staining, panel C). b) Frequency of integrin α chains CD49d, CD49e and CD49f within CD4+Foxp3+ and CD4+Foxp3- cells. c) Mean fluorescence intensity (MFI) of each integrin α chain within CD4+Foxp3+ and CD4+Foxp3- cells. d) Frequency of chemokine receptors CD184/CXCR4 and CD197/CCR7 within CD4+Foxp3+ and CD4+Foxp3- cells. e) MFI of each chemokine receptor within CD4+Foxp3+ and CD4+Foxp3- cells. Data are expressed as mean ± s.e.m. of 3–6 mice/day, after 17 days p.i. and exemplify one representative of three experiments performed independently in BALB/c mice infected with Y strain. * p <0.05; ** p<0.01 and *** p<0.001.
Fig 8
Fig 8. Fibronectin-driven ex vivo migratory activity of tTregs.
For migration assays, thymocyte pools of at least 3–4 animals from control or 17 days-infected mice were allowed to migrate in transwell chambers coated with fibronectin (FN+) alone or BSA as control (FN-) during 12 h. a) Percentage of input of total CD4+ thymocytes. b) Percentage of input of CD4+Foxp3- cells. c) Percentage of input of CD4+Foxp3+ cells. Flow cytometric analyses of FN-induced migratory activity correspond to the migratory capacity of thymocyte subpopulations as percentage of input (% of input = [Absolute number of migrating cells with a determinate phenotype /Total number of migrating cells] x 100). Results derived from ex vivo migration assays are representative from two independent experiments carried out with C57BL/6 mice infected with Tulahuén strain of parasite. *p<0.05 and **p<0,01.

Similar articles

Cited by

References

    1. Sakaguchi S, Miyara M, Costantino CM, Hafler D a. FOXP3+ regulatory T cells in the human immune system. Nat Rev Immunol. 2010;10: 490–500. 10.1038/nri2785 - DOI - PubMed
    1. Rochman Y, Spolski R, Leonard WJ. New insights into the regulation of T cells by gamma(c) family cytokines. Nat Rev Immunol. 2009;9: 480–490. 10.1038/nri2580 - DOI - PMC - PubMed
    1. Pandiyan P, Lenardo MJ. The control of CD4+CD25+Foxp3+ regulatory T cell survival. Biol Direct. 2008;3: 6 10.1186/1745-6150-3-6 - DOI - PMC - PubMed
    1. Vang KB, Yang J, Mahmud S a, Burchill M a, Vegoe AL, Farrar M a. IL-2, -7, and -15, but not thymic stromal lymphopoeitin, redundantly govern CD4+Foxp3+ regulatory T cell development. J Immunol. 2008;181: 3285–3290. - PMC - PubMed
    1. Belkaid Y. Regulatory T cells and infection: a dangerous necessity. Nat Rev Immunol. 2007;7: 875–888. - PubMed

Publication types