. 2016 Jan 8;12(1):e1004109.
doi: 10.1371/journal.pcbi.1004109. eCollection 2016 Jan.

Evidence for Functional Groupings of Vibrissae across the Rodent Mystacial Pad

Affiliations

Evidence for Functional Groupings of Vibrissae across the Rodent Mystacial Pad

Jennifer A Hobbs et al. PLoS Comput Biol. .

Abstract

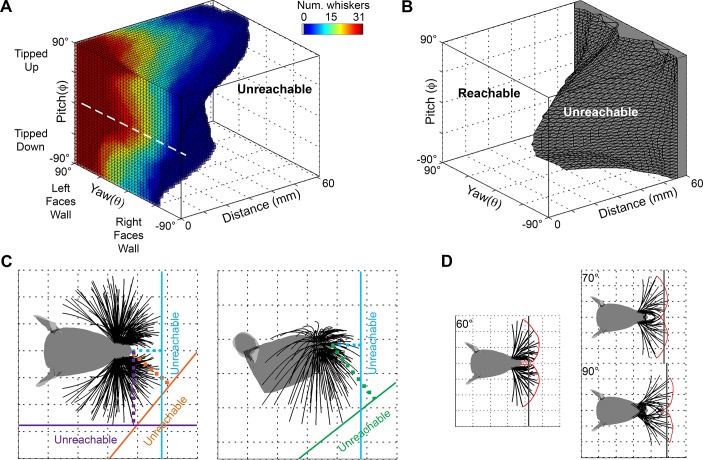
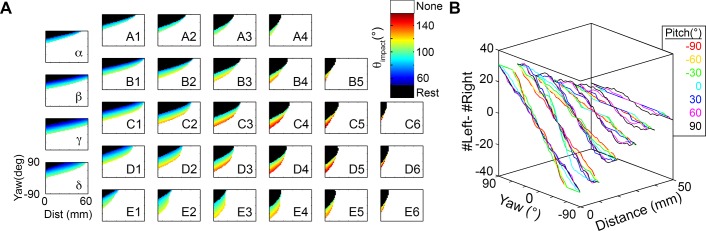
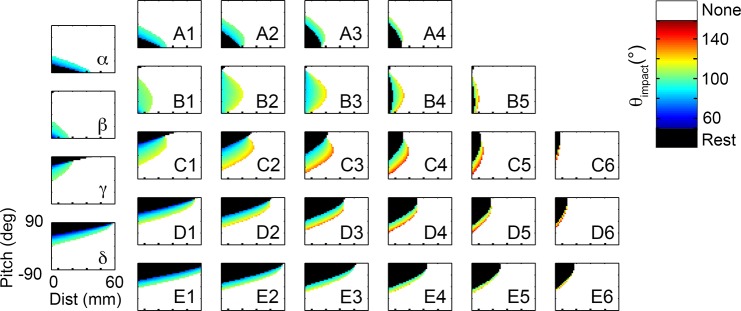
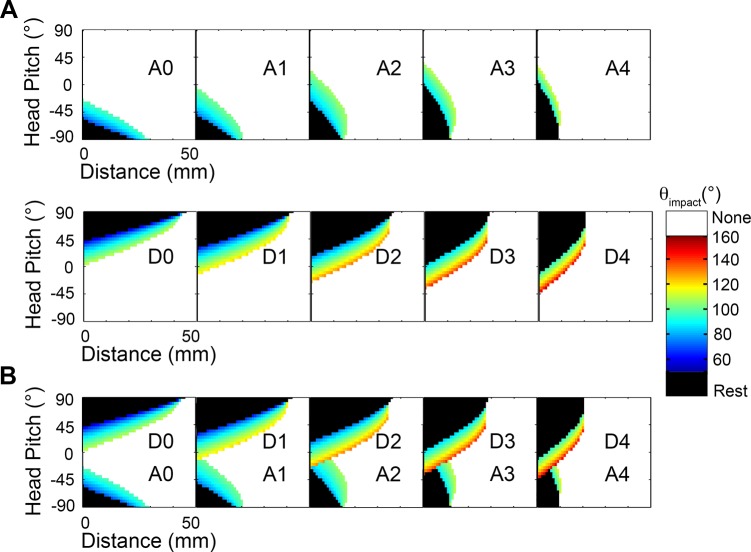
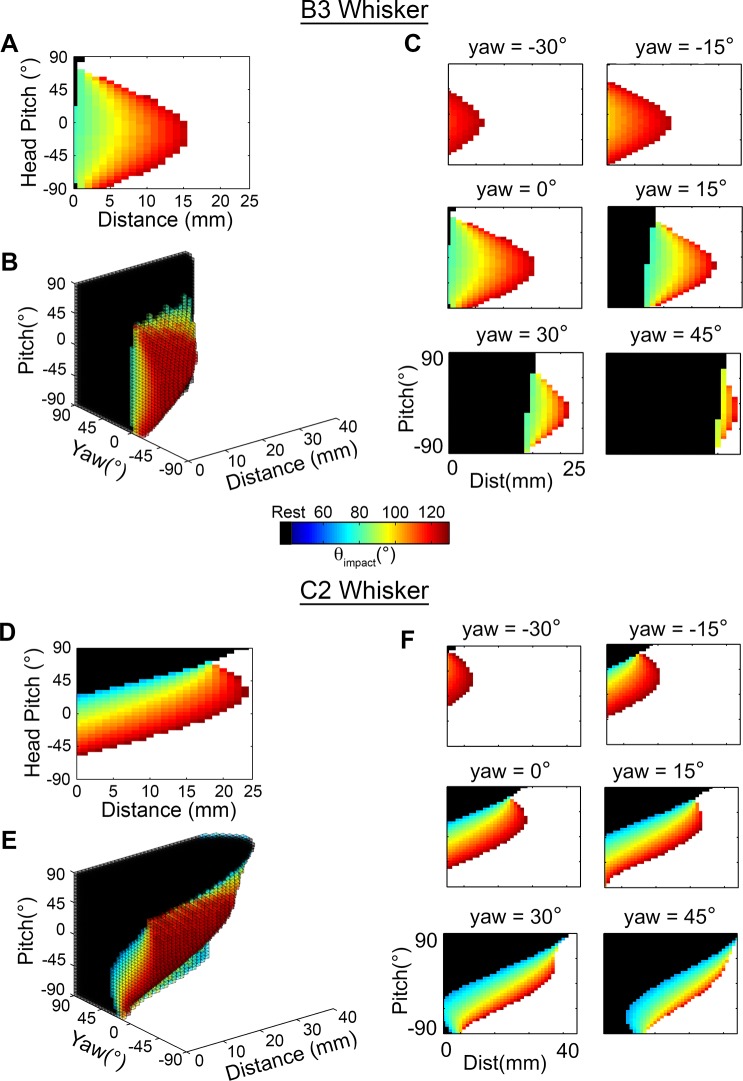
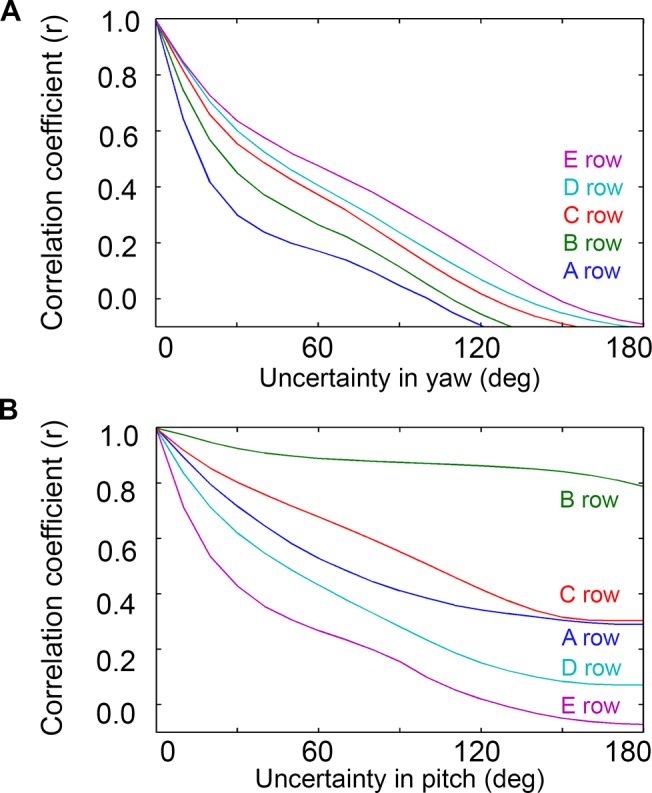
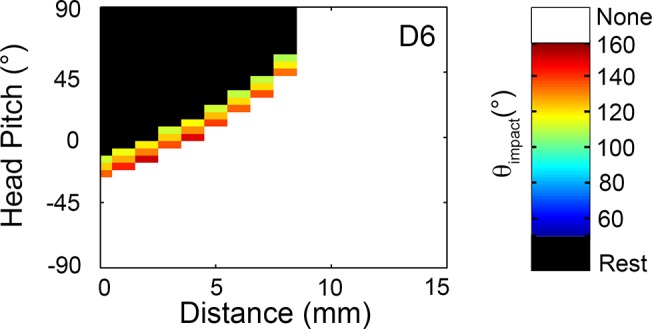
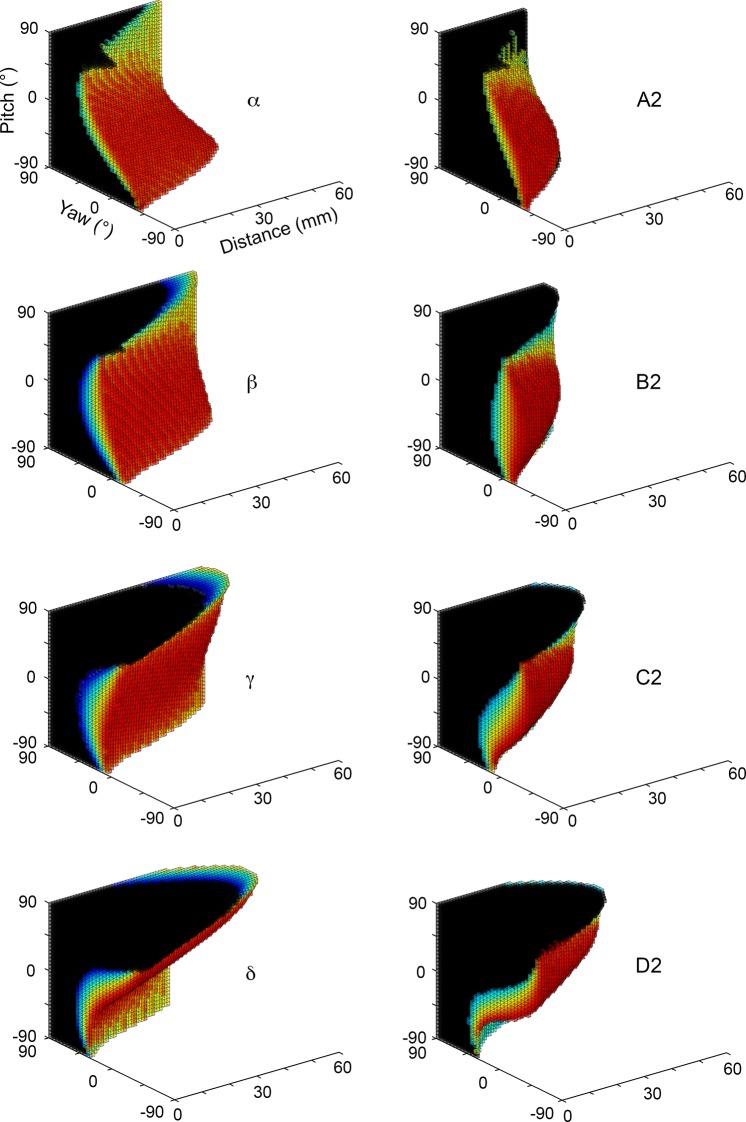
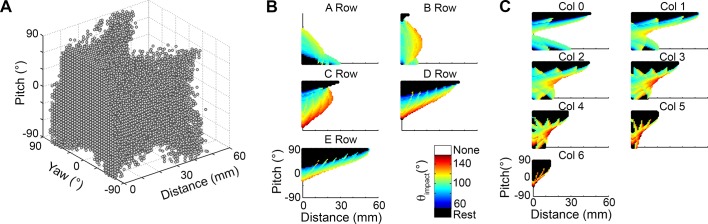
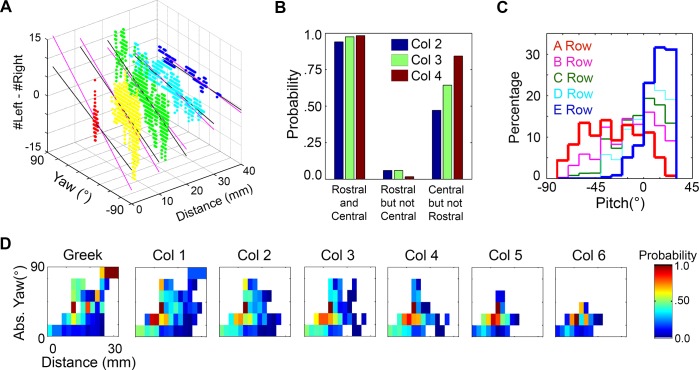
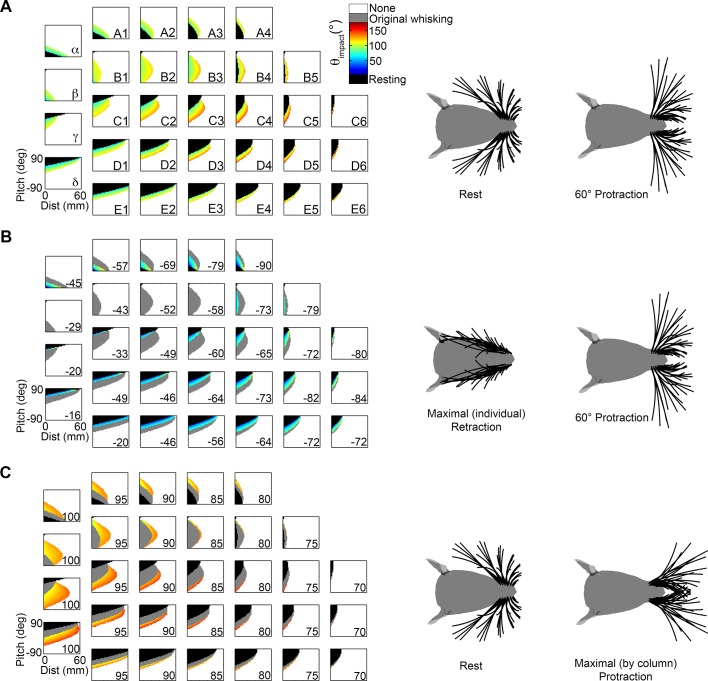
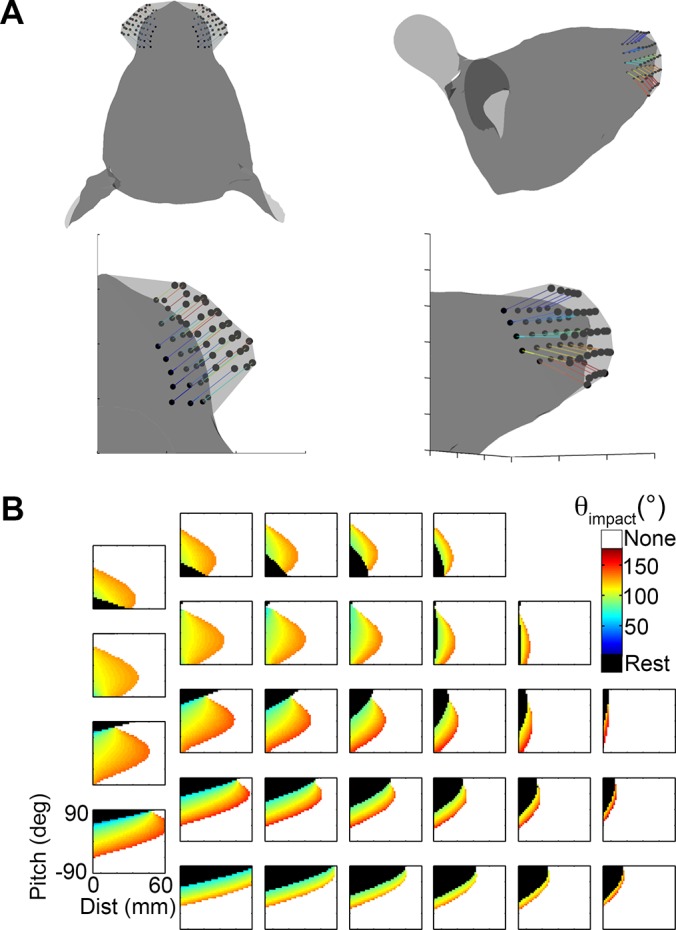
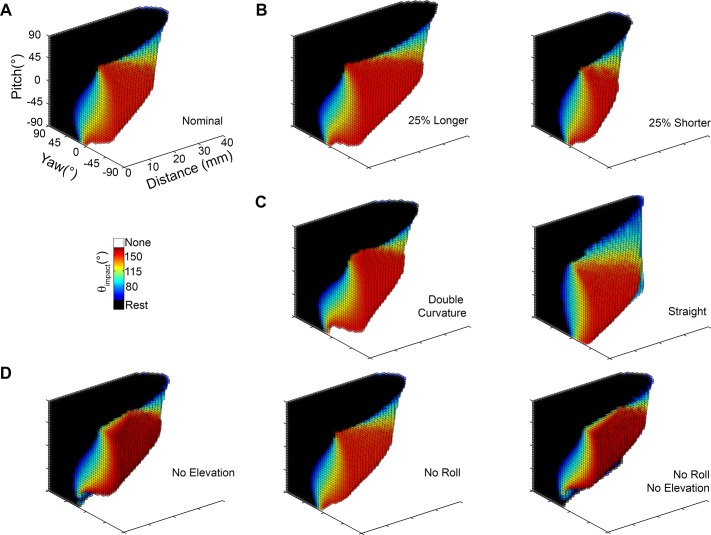
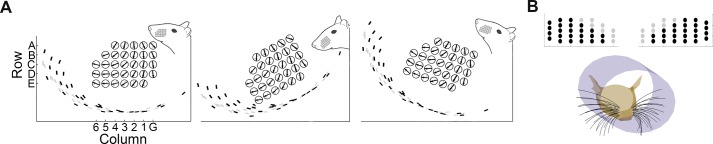
During natural exploration, rats exhibit two particularly conspicuous vibrissal-mediated behaviors: they follow along walls, and "dab" their snouts on the ground at frequencies related to the whisking cycle. In general, the walls and ground may be located at any distance from, and at any orientation relative to, the rat's head, which raises the question of how the rat might determine the position and orientation of these surfaces. Previous studies have compellingly demonstrated that rats can accurately determine the horizontal angle at which a vibrissa first touches an object, and we therefore asked whether this parameter could provide the rat with information about the pitch, distance, and yaw of a surface relative to its head. We used a three-dimensional model of the whisker array to construct mappings between the horizontal angle of contact of each vibrissa and every possible (pitch, distance, and yaw) configuration of the head relative to a flat surface. The mappings revealed striking differences in the patterns of contact for vibrissae in different regions of the array. The exterior (A, D, E) rows provide information about the relative pitch of the surface regardless of distance. The interior (B, C) rows provide distance cues regardless of head pitch. Yaw is linearly correlated with the difference between the number of right and left whiskers touching the surface. Compared to the long reaches that whiskers can make to the side and below the rat, the reachable distance in front of the rat's nose is relatively small. We confirmed key predictions of these functional groupings in a behavioral experiment that monitored the contact patterns that the vibrissae made with a flat vertical surface. These results suggest that vibrissae in different regions of the array are not interchangeable sensors, but rather functionally grouped to acquire particular types of information about the environment.


Conflict of interest statement

The authors have declared that no competing interests exist.

Figures

Fig 1
Fig 1. Definitions of whisker angles.
A. The angle θ is the protraction angle, ϕ is the elevation angle, and ζ is the roll of the vibrissa about its own axis. Figure adapted from Towal et al., 2011 [7]. B. With the exception of Fig 5D and Figs 15–17, all simulation results were obtained by protracting the vibrissae 60° from biomechanical rest. A 60° protraction from rest brings the rostral-most whiskers to an angular position of 172° and the caudal-most (Greek) whiskers to 108°. The C1 vibrissa is shown in red for reference.
Fig 2
Fig 2. Definitions of head angles.
A. Distance, yaw, and pitch are defined for the head. Following the convention of Towal et al. (2011), a head pitch of ϕhead = 0° was defined as the angle at which the whisker rows are parallel to the ground. In this orientation the rat’s head is tilted slightly upward [7]. B. In simulation, the pitch of the head was varied from ϕhead = -90° to ϕhead = +90°. The top row shows these orientations relative to a vertical wall. The bottom row shows the same head pitches relative to the ground (an offset of -90°).
Fig 3
Fig 3. Definitions of contact angles during whisking behavior.
A. θimpact is defined as the angle between the rostral-caudal axis and the vector tangent to the base of the vibrissa when it first makes contact with the object. Note that the illustrated curvature of the whiskers reflects their intrinsic curvature and does not simulate the whisker bending against the surface. B. Color code for the different types of vibrissal-object contact. Vibrissae in contact with the surface before protraction begins (resting-contacts) are plotted as black circles on a schematic of the mystacial pad. Vibrissae that never contact the surface at any point during the whisk (“no-contacts”) are shown in gray. Vibrissae that make contact at a particular protraction value of the whisk are color coded according to θimpact.
Fig 4
Fig 4. Effect of parameter variations on θimpact.
The mean and standard deviation of θimpact for each vibrissa across 42,000 parameter-varied simulations is plotted.
Fig 5
Fig 5. Reachable configuration space of the array.
A. Reachable space for the 31 vibrissae of the left array. The figure shows the configurations that allow at least one vibrissa of the left array to come in contact with an infinite surface. Both resting-contacts and whisking-contacts are included. Color indicates the number of vibrissae that make contact. Configurations in which no vibrissae contact the surface are left white (labeled “unreachable”). The broad red peak at the level of the white dashed line indicates that at any given value of yaw, pitches around 0° will maximize the number of whisker contacts with the surface. B. Reachable and unreachable spaces for both sides of the array acting together. The configuration space over which no vibrissae, from either the right or left side of the array, make contact is extremely small until the distance becomes large. The unreachable region is colored gray and labeled “unreachable.” C. Example “walls” at different orientations relative to the rat’s head demarcate the unreachable space. The dotted lines show that a wall directly in front of the rat’s nose (pitch = yaw = 0°, cyan) becomes unreachable at a smaller distance than a wall to the rat’s side (orange and purple walls) or below the rat (green wall). D. The “blind spot” is very different from the unreachable space. The blind spot is a small (x, y, z) region of space that the whiskers cannot touch, even at extreme protraction angles. The left subplot indicates a protraction of 60° from rest, and the blind spot takes the form of a niche in front of the rat’s nose. At protractions of 70° and 90° (right plot), a number of simulated whiskers become un-physical (they penetrate the rat’s face due to excessive protraction) and yet the small blind spot remains. Note that an imaginary vertical surface (gray line) passing through a central point in the blind spot is not un-reachable because some vibrissae can still contact it.
Fig 6
Fig 6. Mappings between distance, yaw, and θimpact.
A. Values of θimpact mapped to yaw and distance for the 31 vibrissae of the left array at pitch = 0°. Resting-contacts are shown in black, while whisking-contacts are color coded according to θimpact. A yaw value of +90 means that the left whiskers were turned towards the wall, resulting in a large number of resting-contacts. A yaw value of -90 means that the left whiskers were turned away from the wall, resulting in no contacts (white). B. The difference between the number of left and right vibrissae (nL—nR) in contact with the surface is shown as a function of yaw and distance. Each color represents a different pitch value. This difference is seen to increase as the yaw increases, providing the rat with information about yaw.
Fig 7
Fig 7. Mappings between distance, pitch, and θimpact for the 31 vibrissae of the left array.
Resting-contacts are shown in black, while whisking-contacts are color coded according to θimpact. A pitch value of +90 means that the head is pitched up and a pitch value of -90 means that the head is pitched down. Yaw is constant at 0°.
Fig 8
Fig 8. Vibrissae in exterior rows constrain values of relative pitch.
A. Vibrissae of the A-row show a relationship between θimpact, pitch, and distance that are close to a mirror image of the mappings for the D and E row vibrissae. Mappings for the E row are not shown, but Fig 7 shows they will closely resemble the mappings of the D row. B. Overlaying the mappings for dorsal and ventral vibrissae constrains the possible values of head pitch. The mappings of both (A) and (B) are shown for a value of yaw = 0°, but similar results were found for all values of yaw. As in all previous figures, resting-contacts are shown in black, while whisking-contacts are color coded according to θimpact.
Fig 9
Fig 9. Mappings of θimpact for the left B3 and C2 vibrissae.
In all subplots black corresponds to resting contacts, white corresponds to no contacts, and the value of θimpact is represented in the color scale. A. The B3 vibrissa is characteristic of the B and C rows, which show a correlation between θimpact and distance. The mapping is shown for yaw = 0°. B. The 3D mapping for the B3 vibrissa is convex near pitch and yaw values of 0°. Note that subplot A is a vertical cross section through this larger space. C. As the rat turns towards the wall the number of resting-contacts increases. For whisking-contacts, the overall functional relationship between θimpact and distance remains the same as seen in subplot A, regardless of yaw. D. The C2 vibrissa shows characteristics of the interior row, although is less symmetric about pitch = 0° than the B3 vibrissa. E. The 3D mapping of the C2 vibrissa shows the same convex structure as other vibrissae of the interior rows. F. The relationship between distance, pitch, and θimpact is shown for the C2 vibrissa for different values of yaw. Large positive values of yaw are again dominated by resting-contacts.
Fig 10
Fig 10. Correlation between θimpact and distance as a function of uncertainty in yaw and pitch.
Both analyses include whisking contacts only. A. For all rows, the correlation between θimpact and distance falls off rapidly as the uncertainty in yaw increases. The value of 0° on the x-axis corresponds to the yaw being known exactly, 180° corresponds to the yaw being allowed to take on any value. Pitch is held at a constant value of 0°. B. The correlation between θimpact and distance falls off differently for each row as uncertainty in pitch increases. The B and C rows show a greater robustness to uncertainty in pitch than do the exterior (A, D, and E) rows. The value of 0° on the x-axis corresponds to the pitch being known exactly, 180° corresponds to the pitch being allowed to take on any value. Yaw is held at a constant value of 0°.
Fig 11
Fig 11. Typical contact pattern of a rostral vibrissa.
The D6 vibrissa, like other small rostral vibrissae, tends to make resting-contacts with objects within 10mm of the rat’s snout. Whisking contacts are rare and tend to occur at only values of θimpact above 100°.
Fig 12
Fig 12. Vibrissae of the Greek column exhibit long reaches to the side.
The vibrissae of column 2 (right) show convex mappings when yaw and pitch are near zero (θ = 0°, ϕ = 0°), while the vibrissae of the Greek column (left) are concave near this region. This means that the whiskers of the Greek column cannot touch the surface if the rat faces it symmetrically with a level head. The rat must either pitch its head up or down, or turn its head to the side. In all subplots black indicates a resting-contact, white indicates no contact, and the color scale indicates the value of θimpact. To permit visual comparison across subplots, the values of θimpact have been normalized between 0 (dark blue) and 1 (dark red).
Fig 13
Fig 13. Values of θimpact across the array constrain possible head configurations relative to the surface.
A. A grey dot is placed at each distance-pitch-yaw configuration associated with a unique pattern of θimpact across the array. Approximately 37% of the configurations can be uniquely determined if the values of θimpact are known to within 5°. Note the non-unique region at distances less than 5mm. B. The value of θimpact averaged within each row for different distance and pitch configurations (yaw = 0°). C. The value of θimpact averaged within each column for the same configurations as in B (yaw = 0°).
Fig 14
Fig 14. Behavioral data validate many predictions of the simulation.
A. Behavioral data replicate the result of Fig 6B. The difference in the number of contacts between the left and right arrays provides information about yaw. Each data point corresponds to one msec in the behavioral data, and the data points have been color-coded by distance for visual clarity. The black lines are fit to the behavioral data and the magenta lines correspond to the predicted slope from Fig 6B (averaged across pitches). B. If a rostral vibrissa (Col 5, 6) is in contact with the surface, vibrissae of the central columns (Col 2, 3, 4) are almost guaranteed to be in contact. Similarly, if a rostral vibrissa in contact, it is rare that there is no contact by a central column vibrissa. Conversely, if a central vibrissa is in contact, the probability a rostral vibrissa being in contact is more moderate. C. Contact by vibrissae of the exterior rows (row A, D, E) provides information about pitch. The A row is more likely to be in contact for negative pitch values while the D and E row are more likely to be in contact for positive pitch values. The interior B and C rows show distributions intermediate between those of the A and E rows. D. The Greek vibrissae are able to contact the wall for large yaws and at large distances. The color of each box corresponds to the number of msec in which contact was observed for a given configuration divided by the total number of msec the rat spent in that configuration.
Fig 15
Fig 15. Mappings that include extreme retraction and protraction angles.
Each mapping shows the distance of the head to the wall on the x-axis and the head pitch on the y-axis, with color indicating the value of θimpact. The yaw of the head is always held fixed at 0°. The two figurines to the right of the mappings illustrate the angular ranges of the whiskers spanned in the mappings. A. The original distance-pitch mappings for each of the 31 vibrissae. Each whisker starts at its biomechanical rest and is simulated to protract 60°. This figure is identical to Fig 7, except that the color scale has been extended to match the range of θimpact shown in parts (B) and (C). B. Each vibrissa starts from its fully retracted position and is protracted 60° past its biomechanical rest position. Configurations that produce resting contacts in these mappings as well as the original mappings (from rest to 60°, Fig 15A) are shown in black. Configurations that produce whisking contacts in both mappings are shown in gray. Configurations that were resting contacts in the original mappings but have now become whisking contacts are colored according to θimpact. C. Each whisker starts from its biomechanical rest angle and protracts by the angle indicated in column 6 of Table 4, to its full protraction. As in subplot (B), resting contacts maintained from the original mappings are shown in black. Whisking contacts maintained from the original mappings are in gray. New whisking contacts are colored according to θimpact.
Fig 16
Fig 16. Effects of 3D basepoint translation.
A. Vibrissal basepoints were translated by the amounts shown in Table 5 over the course of the protraction values shown in column 6 of Table 4. (Left) The translations of the basepoints are shown in a top-down view. (Right) The translations of the basepoints are shown in a side-on view. B. Basepoint translations have some small effects on the details of the mappings (compare with Fig 15C) but do not alter the functional groupings.
Fig 17
Fig 17. Effects of whisker length, intrinsic curvature, roll, and elevation on mappings for the C2 whisker.
A. Original mapping. Seven changes were made to the C2 vibrissa and its kinematic equations: B. length was increased and decreased by 25%, C. intrinsic curvature was doubled or the whisker was made completely straight while retraining the same total length, and D. kinematic equations were modified to completely eliminate elevation, roll, and both roll and elevation. None of these seven alterations to the parameters alter the overall characteristics of the mappings or the functional groups.
Fig 18
Fig 18. Head pitch, intrinsic curvature, and implications for simulation patterns.
A. The intrinsic curvature for each vibrissa is shown relative to the head at a level pitch (left), the head pitched down (middle), and the head pitched up (right). Gray traces correspond to the direction of intrinsic curvature at rest and black corresponds to the direction of intrinsic curvature after a protraction of 60°. B. In a burrow most of the vibrissae are in resting contact with a surface, but the force exerted by the surface on the whiskers is in different directions for different rows.

Similar articles

Cited by

References

    1. Vincent SB (1912) The functions of the vibrissae in the behavior of the white rat: University of Chicago.
    1. Welker W (1964) Analysis of sniffing of the albino rat. Behaviour: 223–244.
    1. Deschenes M, Moore J, Kleinfeld D (2012) Sniffing and whisking in rodents. Current opinion in neurobiology 22: 243–250. 10.1016/j.conb.2011.11.013 - DOI - PMC - PubMed
    1. Hartmann MJ, Johnson NJ, Towal RB, Assad C (2003) Mechanical characteristics of rat vibrissae: resonant frequencies and damping in isolated whiskers and in the awake behaving animal. The Journal of neuroscience 23: 6510–6519. - PMC - PubMed
    1. Moore JD, Deschnes M, Furuta T, Huber D, Smear MC, et al. (2013) Hierarchy of orofacial rhythms revealed through whisking and breathing. Nature. - PMC - PubMed

Publication types

LinkOut - more resources